| Param | Original file | Final file |
|---|---|---|
| Filename | modeM0/AS1A13_018T01_9000005906_43838cztM0_level2.fits | modeM0/AS1A13_018T01_9000005906_43838cztM0_level2_quad_clean.evt |
| Size (bytes) | 618,111,360 | 101,502,720 |
| Size | 589.5 MB | 96.8 MB |
| Events in quadrant A | 4,548,621 | 711,630 |
| Events in quadrant B | 3,611,333 | 734,481 |
| Events in quadrant C | 6,073,846 | 680,185 |
| Events in quadrant D | 8,162,373 | 510,645 |
| Mode M0 | |||
|---|---|---|---|
| Quadrant | BADHDUFLAG | Total packets | Discarded packets |
| A | 0 | 18421 | 6 |
| B | 0 | 14687 | 1 |
| C | 0 | 22539 | 3 |
| D | 0 | 28471 | 4 |
| Mode SS | |||
|---|---|---|---|
| Quadrant | BADHDUFLAG | Total packets | Discarded packets |
| A | 0 | 128 | 0 |
| B | 0 | 128 | 0 |
| C | 0 | 128 | 0 |
| D | 0 | 126 | 0 |
| Mode M9 | |||
|---|---|---|---|
| Quadrant | BADHDUFLAG | Total packets | Discarded packets |
| A | 0 | 10 | 0 |
| B | 0 | 10 | 0 |
| C | 0 | 10 | 0 |
| D | 0 | 10 | 0 |
| Quadrant | Total seconds | Saturated seconds | Saturation percentage |
|---|---|---|---|
| A | 6250 | 197 | 3.152000% |
| B | 6253 | 187 | 2.990565% |
| C | 6252 | 557 | 8.909149% |
| D | 6252 | 1660 | 26.551504% |
Noise dominated data is calculated using 1-second bins in cleaned event files. If a bin has >2000 counts, and if more than 50% of those come from <1% of pixels, then it is considered to be noise-dominated and hence unusable.
| Quadrant | # 1 sec bins | Bins with >0 counts | Bins with >2000 counts | High rate bins dominated by noise | Noise dominated (total time) | Noise dominated (detector-on time) | Marked lightcurve |
|---|---|---|---|---|---|---|---|
| A | 7232 | 6252 | 19 | 19 | 0.26% | 0.30% | 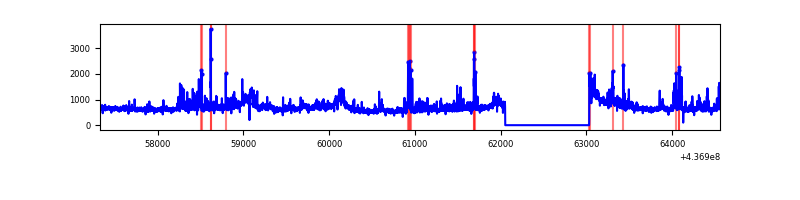 |
| B | 7233 | 6253 | 47 | 47 | 0.65% | 0.75% | 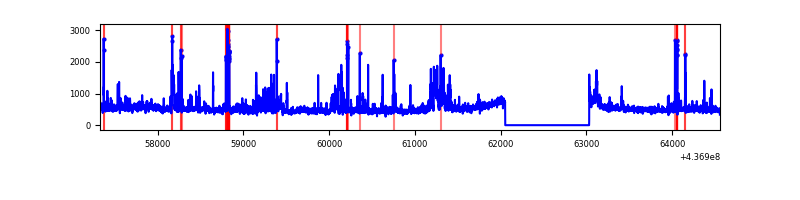 |
| C | 7233 | 6253 | 368 | 368 | 5.09% | 5.89% | 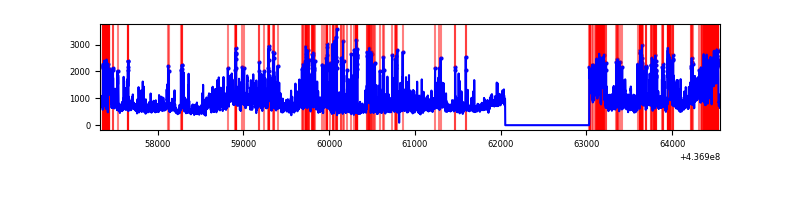 |
| D | 7232 | 6252 | 1579 | 1579 | 21.83% | 25.26% | 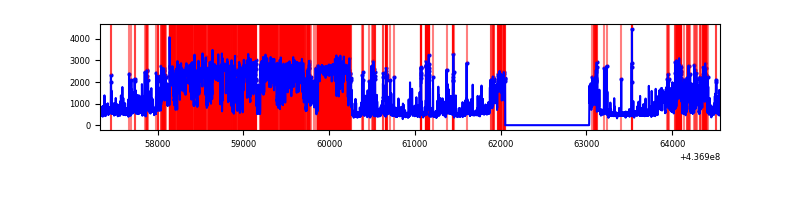 |
Top three noisy pixels from each quadrant. If the there are fewer than three noisy pixels in the level2.evt file, extra rows are filled as -1
| Pixel properties | Quadrant properties | ||||||
|---|---|---|---|---|---|---|---|
| Quadrant | DetID | PixID | Counts | Sigma | Mean | Median | Sigma |
| A | 10 | 83 | 929770 | 6103.18 | 740 | 726 | 152.2 |
| A | 15 | 223 | 642052 | 4213.07 | 740 | 726 | 152.2 |
| A | 13 | 248 | 38267 | 246.62 | 740 | 726 | 152.2 |
| B | 0 | 200 | 199276 | 1363.7 | 736 | 714 | 145.6 |
| B | 4 | 170 | 160610 | 1098.15 | 736 | 714 | 145.6 |
| B | 5 | 235 | 119260 | 814.16 | 736 | 714 | 145.6 |
| C | 3 | 233 | 3224093 | 19433.1 | 708 | 712 | 165.9 |
| C | 15 | 158 | 32160 | 189.59 | 708 | 712 | 165.9 |
| C | 15 | 157 | 27025 | 158.64 | 708 | 712 | 165.9 |
| D | 12 | 33 | 3885616 | 22666.39 | 662 | 641 | 171.4 |
| D | 5 | 235 | 513704 | 2993.4 | 662 | 641 | 171.4 |
| D | 1 | 52 | 255034 | 1484.22 | 662 | 641 | 171.4 |
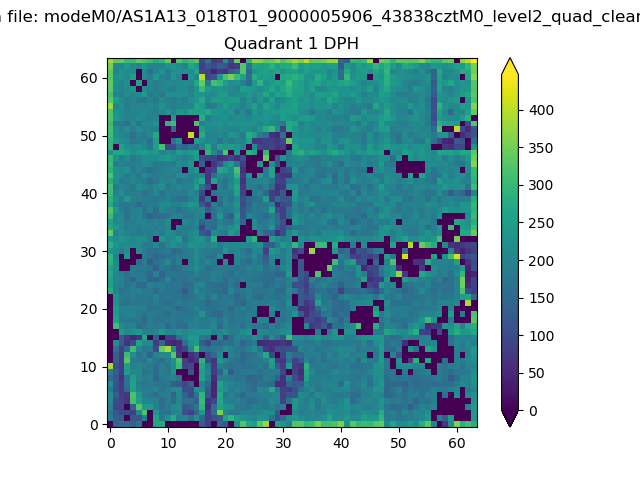
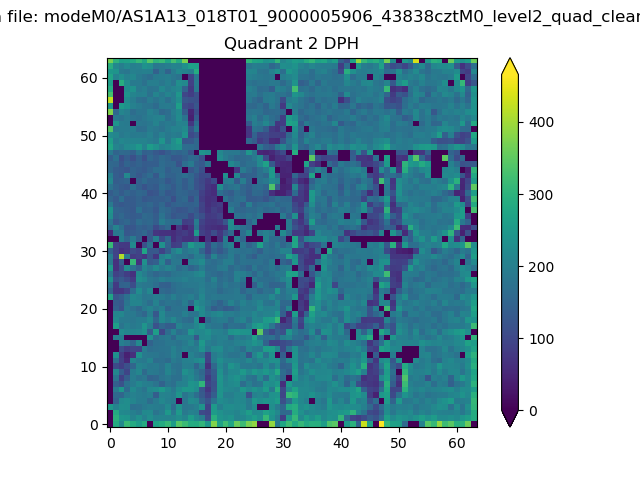
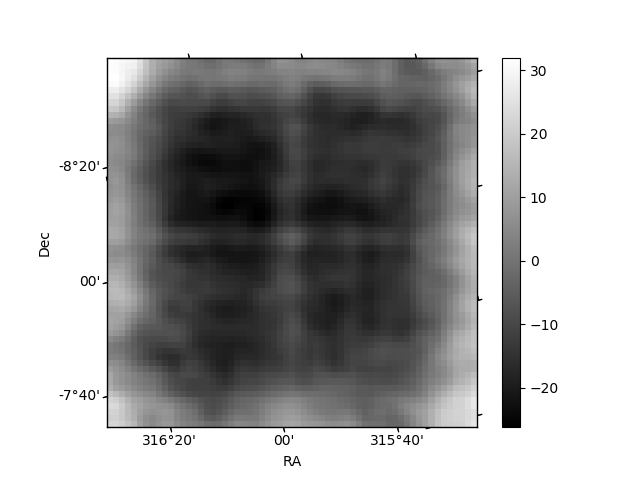
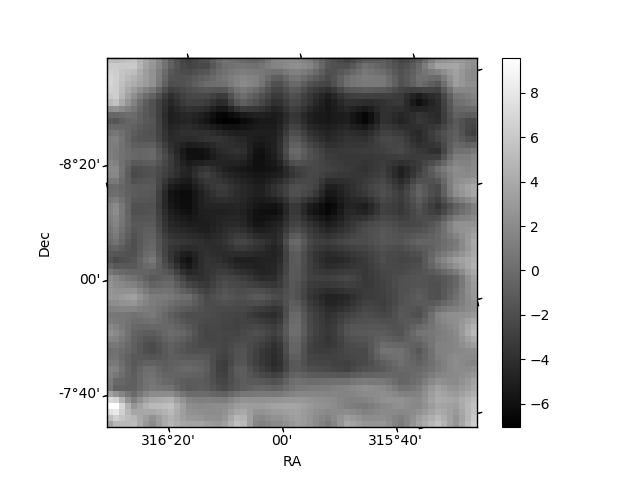
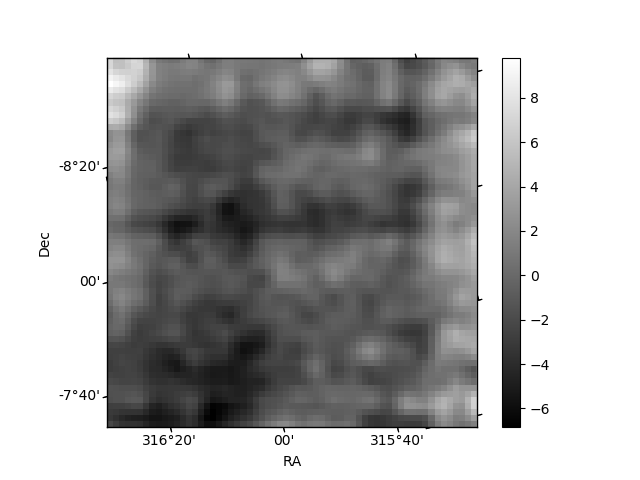
Histogram calculated using DETX and DETY for each event in the final _common_clean file
| Quadrant A |  |
 |
Quadrant B |
|---|---|---|---|
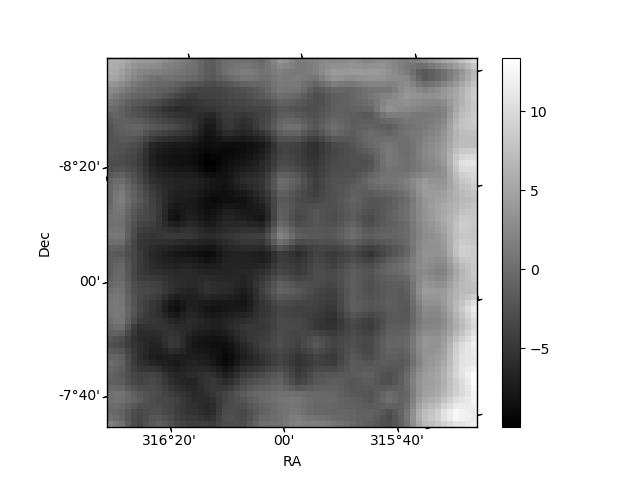
| Quadrant D | 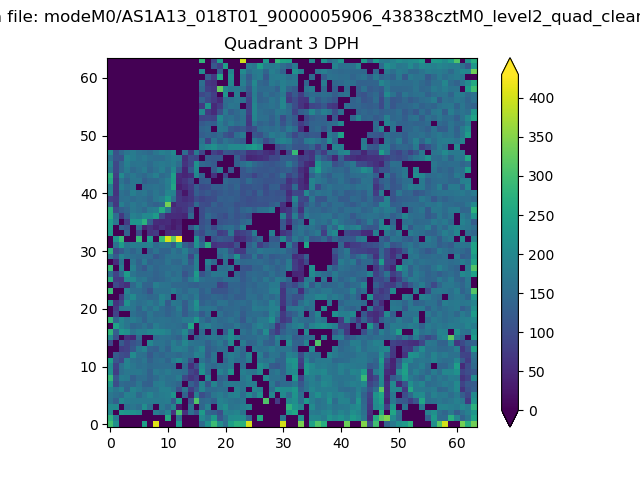 |
 |
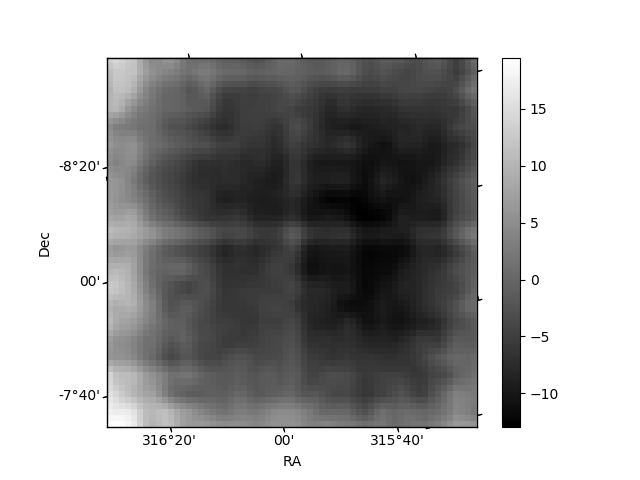
Quadrant C |
| Plot type | Count rate plots | Images |
|---|---|---|
| Comparison with Poisson distribution Blue bars denote a histogram of data divided into 1 sec bins. Red curve is a Poisson curve with rate = median count rate of data. |
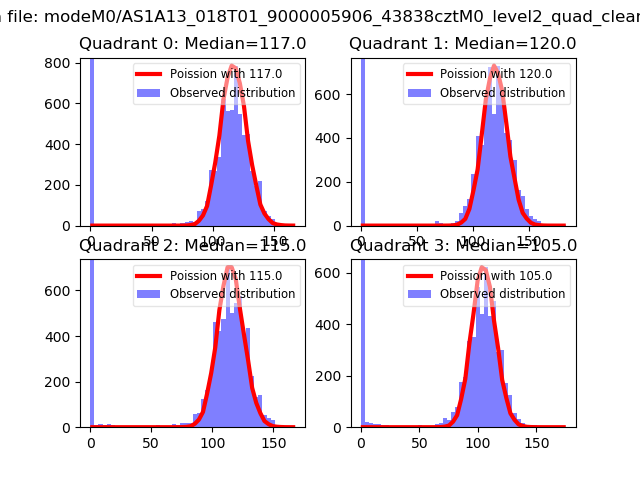 |
 |
| Quadrant-wise count rates Data is divided into 100 sec bins |
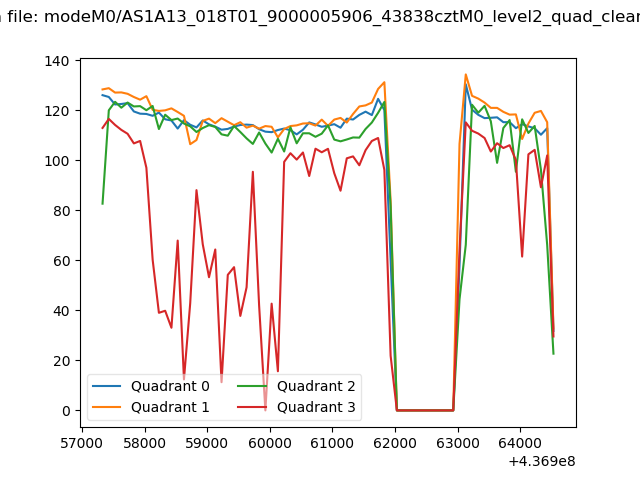 |
|
| Module-wise count rates for Quadrant A Data is divided into 100 sec bins |
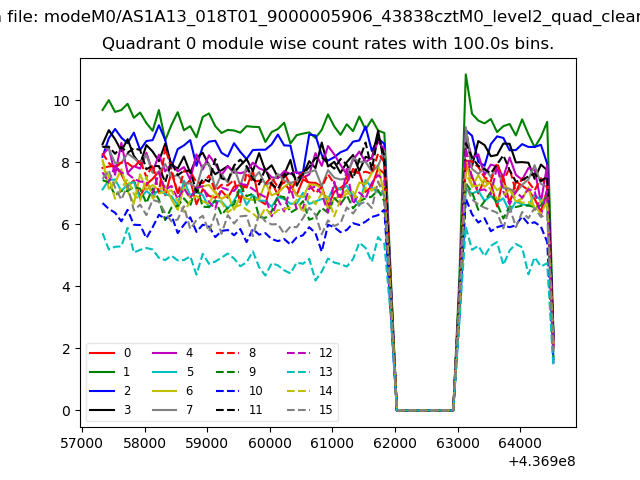 |
 |
| Module-wise count rates for Quadrant B Data is divided into 100 sec bins |
 |
 |
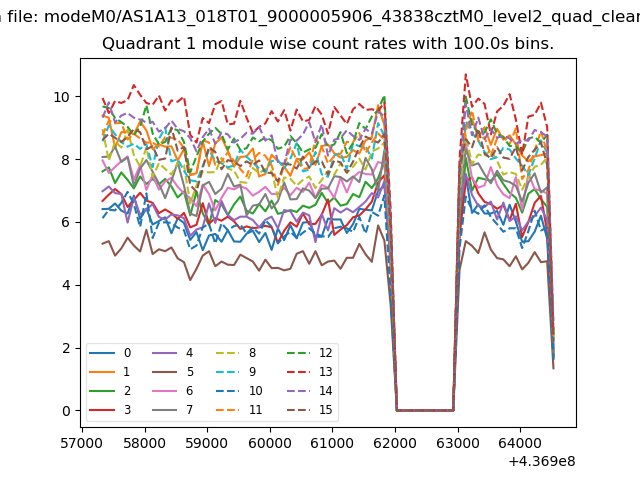
| Module-wise count rates for Quadrant C Data is divided into 100 sec bins |
 |
 |
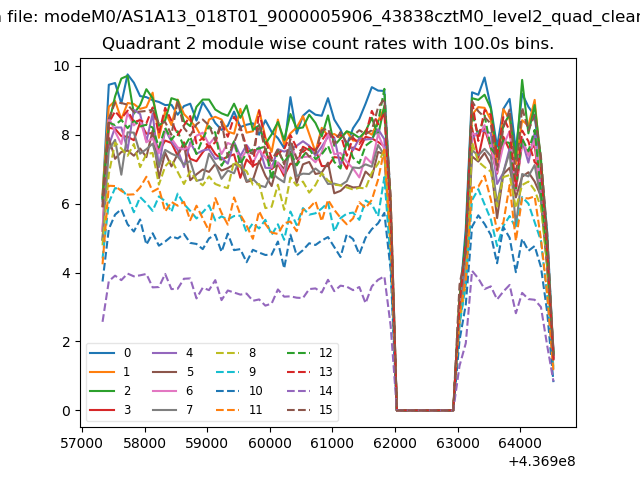
| Module-wise count rates for Quadrant D Data is divided into 100 sec bins |
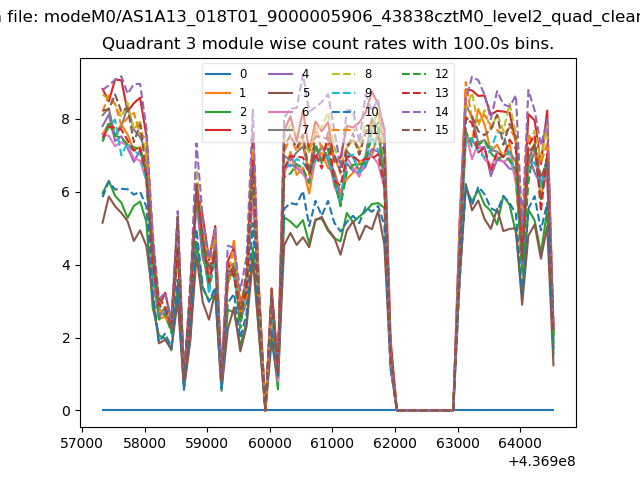 |
 |
| Parameter | Plot |
|---|---|
| CZT HV Monitor | 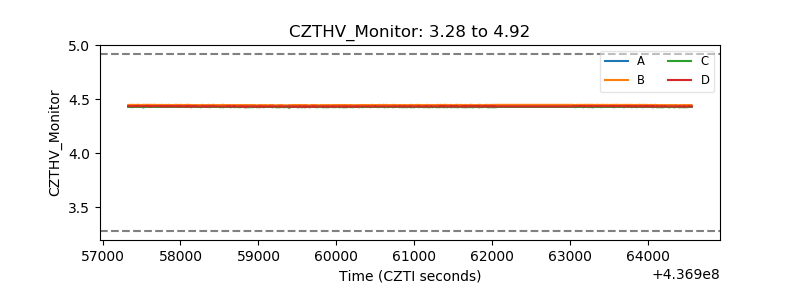 |
| D_VDD | 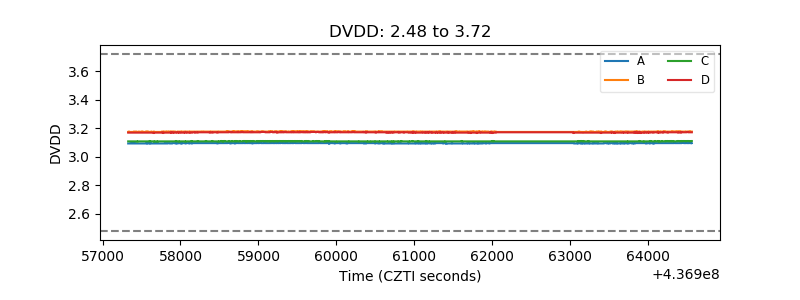 |
| Temperature 1 | 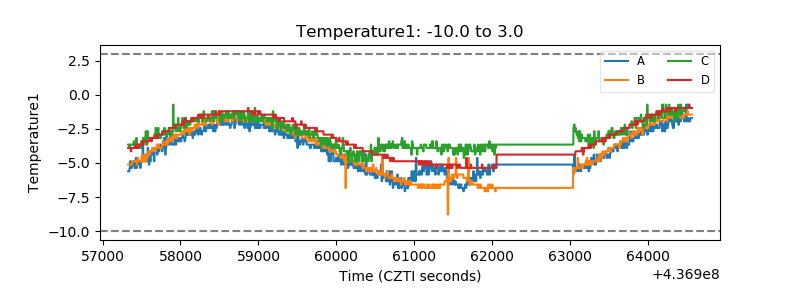 |
| Veto HV Monitor | 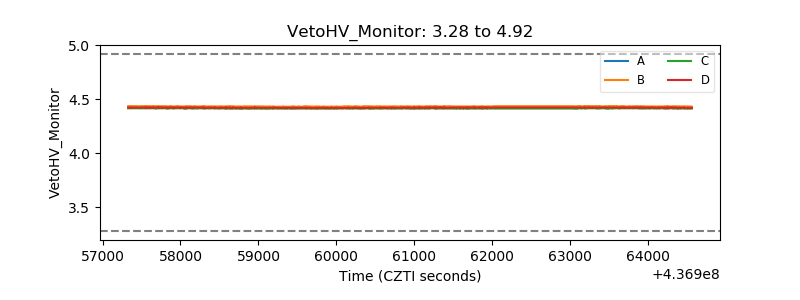 |
| Veto LLD | 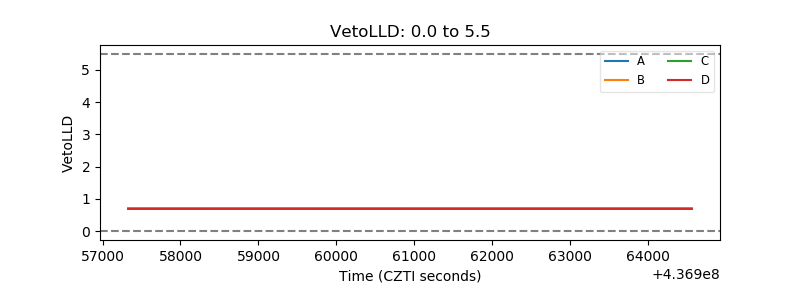 |
| Alpha Counter | 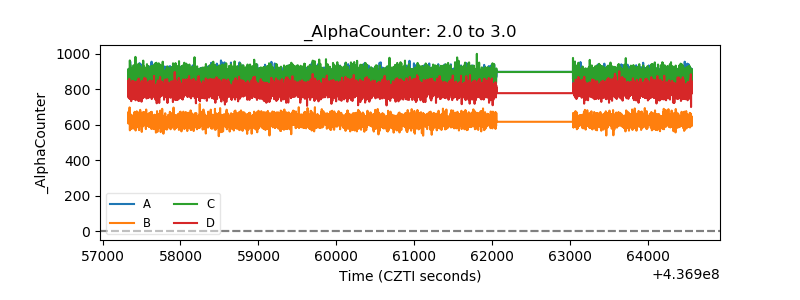 |
| _CPM_Rate | 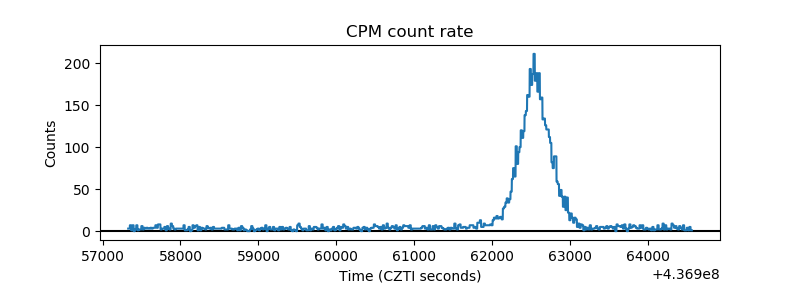 |
| CZT Counter | 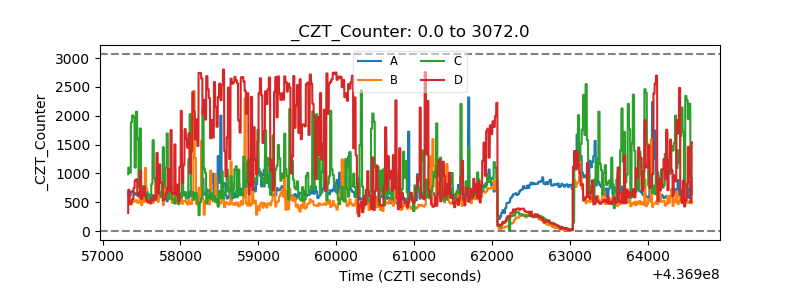 |
| +2.5 Volts monitor | 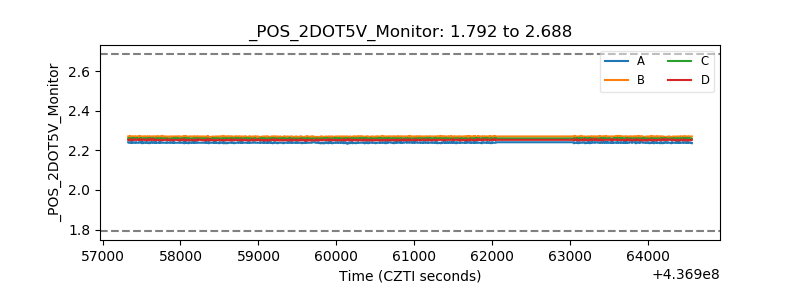 |
| +5 Volts monitor | 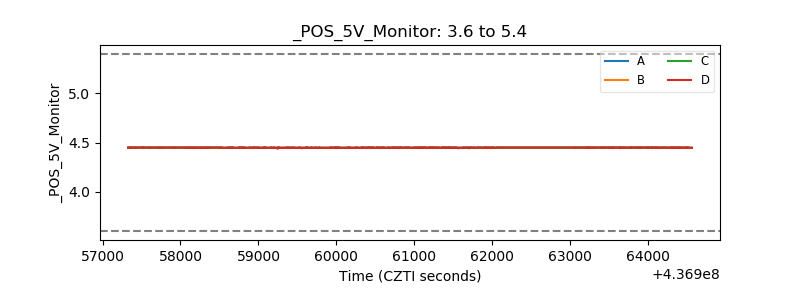 |
| _ROLL_ROT | 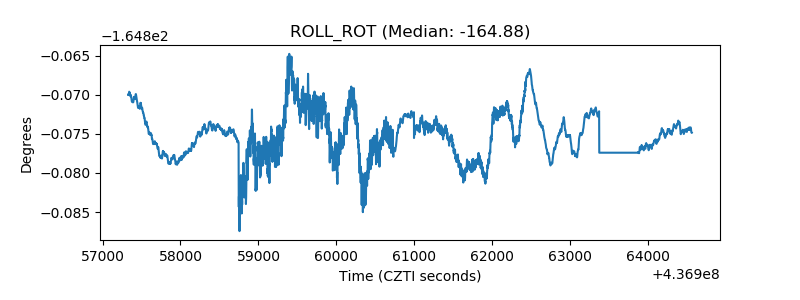 |
| _Roll_DEC | 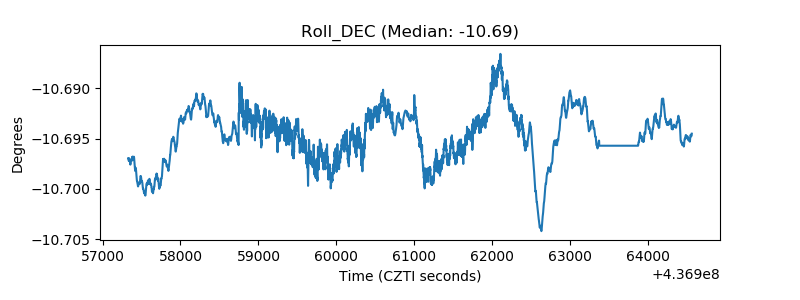 |
| _Roll_RA |  |
| Veto Counter | 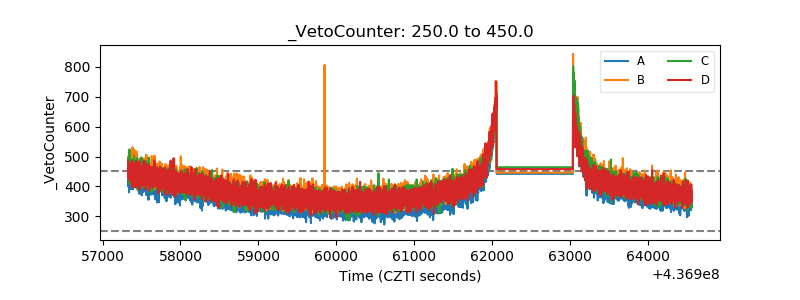 |