| Param | Original file | Final file |
|---|---|---|
| Filename | modeM0/AS1A13_018T01_9000005906_43839cztM0_level2.fits | modeM0/AS1A13_018T01_9000005906_43839cztM0_level2_quad_clean.evt |
| Size (bytes) | 623,059,200 | 96,667,200 |
| Size | 594.2 MB | 92.2 MB |
| Events in quadrant A | 5,828,603 | 623,904 |
| Events in quadrant B | 3,409,782 | 701,888 |
| Events in quadrant C | 6,070,732 | 649,464 |
| Events in quadrant D | 7,273,156 | 517,793 |
| Mode M0 | |||
|---|---|---|---|
| Quadrant | BADHDUFLAG | Total packets | Discarded packets |
| A | 0 | 21813 | 1 |
| B | 0 | 14101 | 1 |
| C | 0 | 22446 | 5 |
| D | 0 | 25902 | 3 |
| Mode SS | |||
|---|---|---|---|
| Quadrant | BADHDUFLAG | Total packets | Discarded packets |
| A | 0 | 126 | 0 |
| B | 0 | 126 | 0 |
| C | 0 | 126 | 0 |
| D | 0 | 126 | 0 |
| Mode M9 | |||
|---|---|---|---|
| Quadrant | BADHDUFLAG | Total packets | Discarded packets |
| A | 0 | 6 | 0 |
| B | 0 | 6 | 0 |
| C | 0 | 6 | 0 |
| D | 0 | 6 | 0 |
| Quadrant | Total seconds | Saturated seconds | Saturation percentage |
|---|---|---|---|
| A | 6216 | 772 | 12.419562% |
| B | 6217 | 211 | 3.393920% |
| C | 6216 | 571 | 9.185972% |
| D | 6215 | 1313 | 21.126307% |
Noise dominated data is calculated using 1-second bins in cleaned event files. If a bin has >2000 counts, and if more than 50% of those come from <1% of pixels, then it is considered to be noise-dominated and hence unusable.
| Quadrant | # 1 sec bins | Bins with >0 counts | Bins with >2000 counts | High rate bins dominated by noise | Noise dominated (total time) | Noise dominated (detector-on time) | Marked lightcurve |
|---|---|---|---|---|---|---|---|
| A | 6846 | 6216 | 320 | 320 | 4.67% | 5.15% | 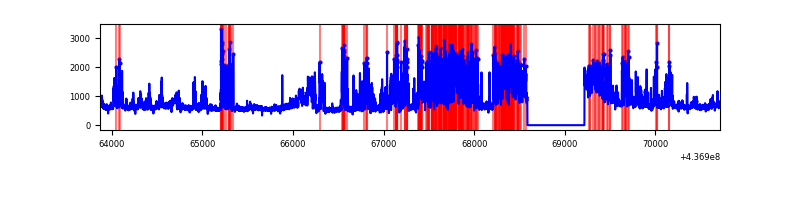 |
| B | 6847 | 6217 | 46 | 46 | 0.67% | 0.74% | 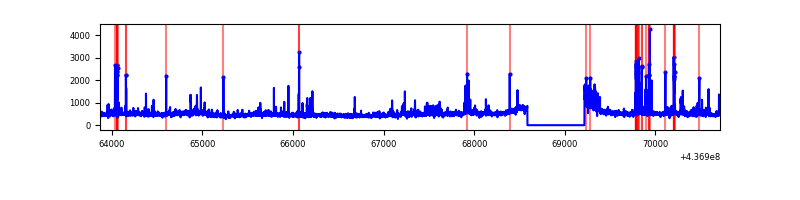 |
| C | 6846 | 6216 | 382 | 382 | 5.58% | 6.15% | 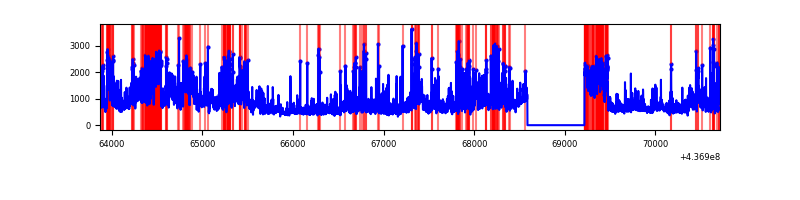 |
| D | 6846 | 6216 | 1220 | 1220 | 17.82% | 19.63% | 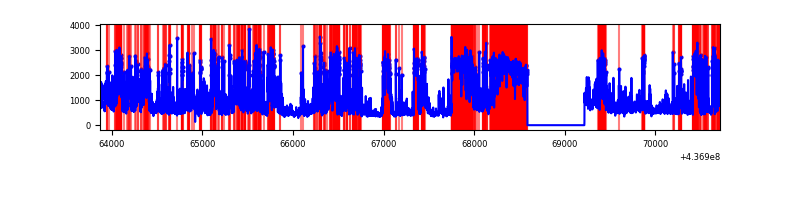 |
Top three noisy pixels from each quadrant. If the there are fewer than three noisy pixels in the level2.evt file, extra rows are filled as -1
| Pixel properties | Quadrant properties | ||||||
|---|---|---|---|---|---|---|---|
| Quadrant | DetID | PixID | Counts | Sigma | Mean | Median | Sigma |
| A | 15 | 223 | 1998667 | 13969.64 | 690 | 676 | 143.0 |
| A | 10 | 83 | 897988 | 6273.86 | 690 | 676 | 143.0 |
| A | 15 | 222 | 124085 | 862.85 | 690 | 676 | 143.0 |
| B | 4 | 170 | 153968 | 1082.87 | 713 | 691 | 141.5 |
| B | 5 | 172 | 100111 | 702.38 | 713 | 691 | 141.5 |
| B | 7 | 205 | 83804 | 587.17 | 713 | 691 | 141.5 |
| C | 3 | 233 | 3253564 | 20077.94 | 685 | 688 | 162.0 |
| C | 15 | 158 | 68360 | 417.7 | 685 | 688 | 162.0 |
| C | 15 | 157 | 36089 | 218.51 | 685 | 688 | 162.0 |
| D | 5 | 235 | 1264794 | 7721.02 | 639 | 618 | 163.7 |
| D | 4 | 221 | 1134044 | 6922.46 | 639 | 618 | 163.7 |
| D | 1 | 52 | 762102 | 4650.8 | 639 | 618 | 163.7 |
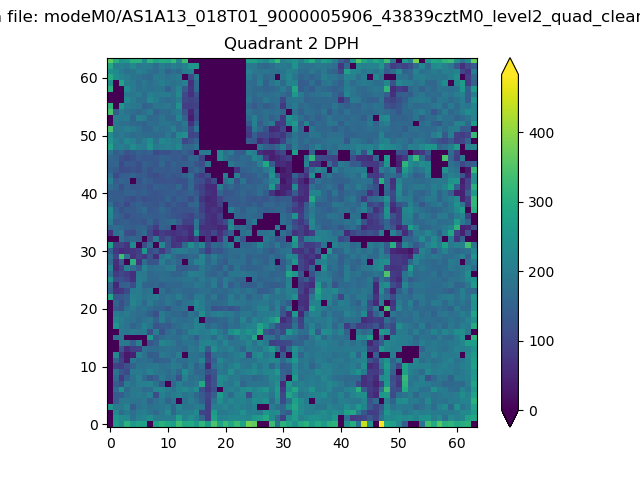
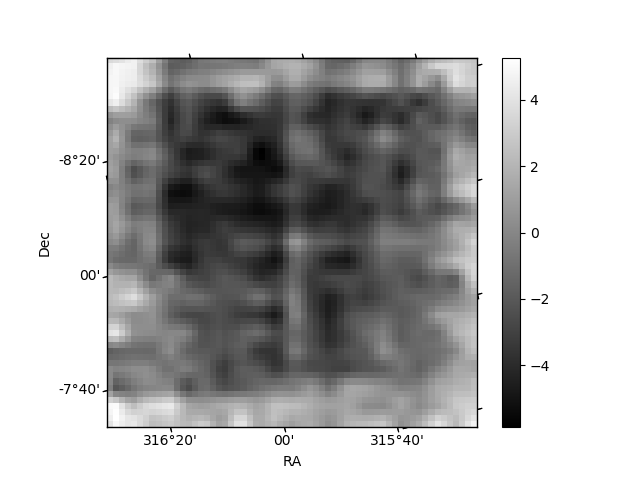
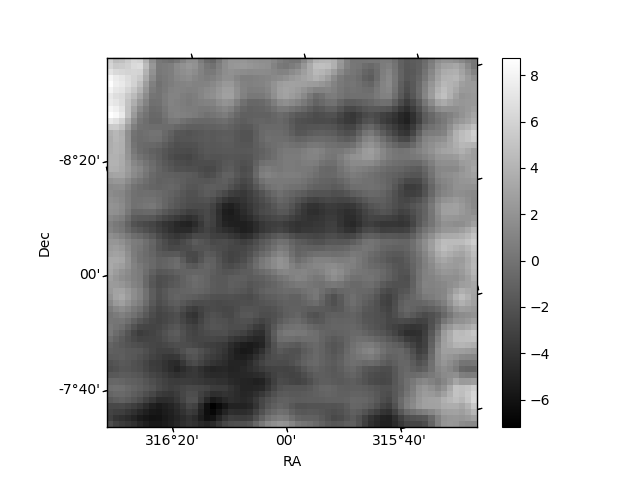
Histogram calculated using DETX and DETY for each event in the final _common_clean file
| Quadrant A | 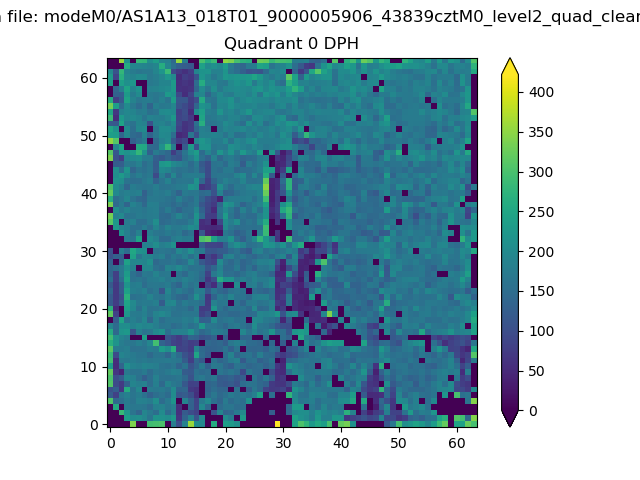 |
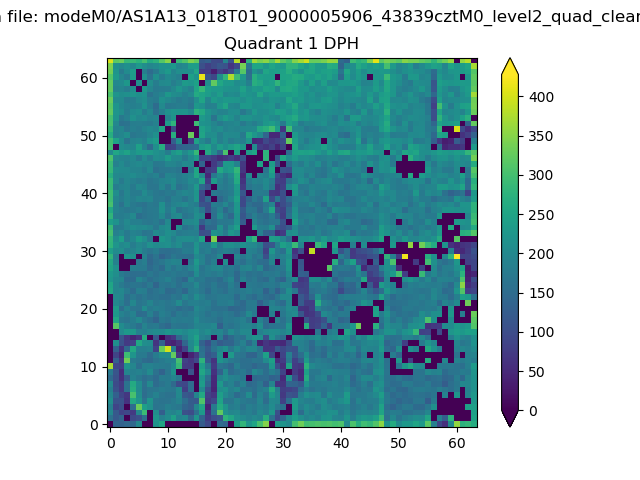 |
Quadrant B |
|---|---|---|---|
| Quadrant D | 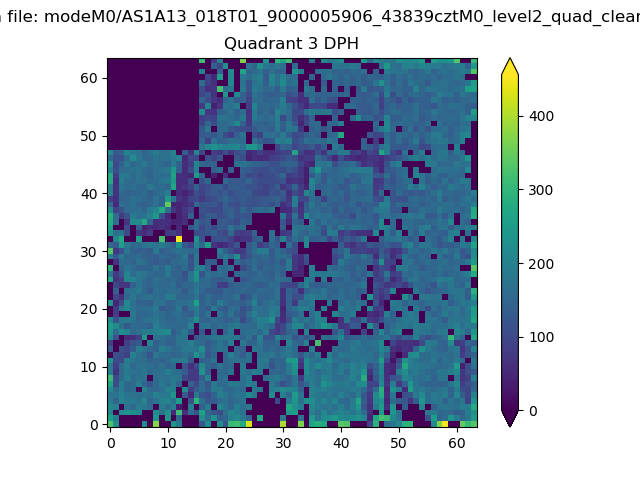 |
 |
Quadrant C |
| Plot type | Count rate plots | Images |
|---|---|---|
| Comparison with Poisson distribution Blue bars denote a histogram of data divided into 1 sec bins. Red curve is a Poisson curve with rate = median count rate of data. |
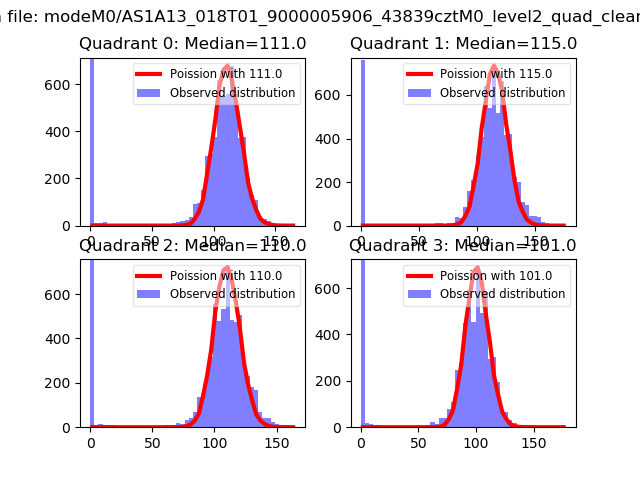 |
 |
| Quadrant-wise count rates Data is divided into 100 sec bins |
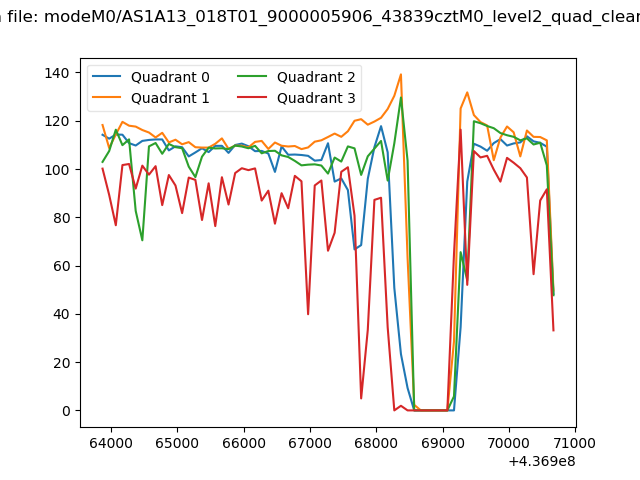 |
|
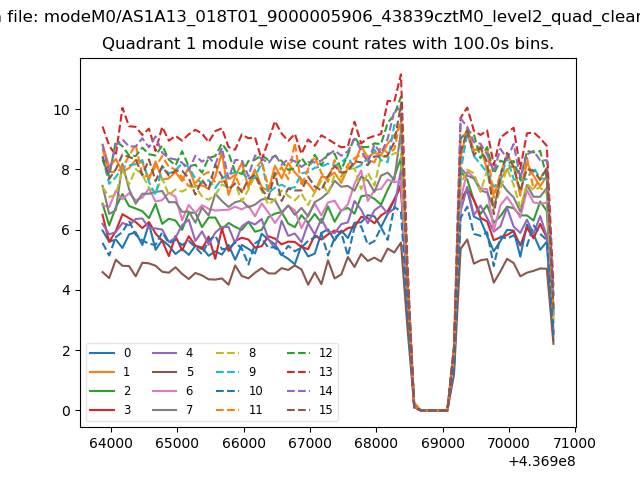
| Module-wise count rates for Quadrant A Data is divided into 100 sec bins |
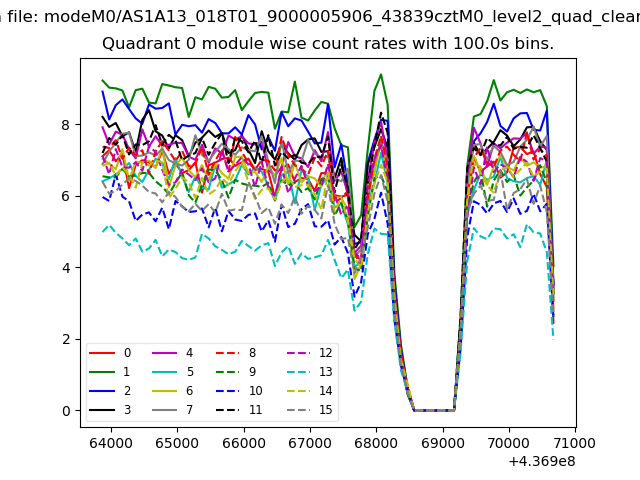 |
 |
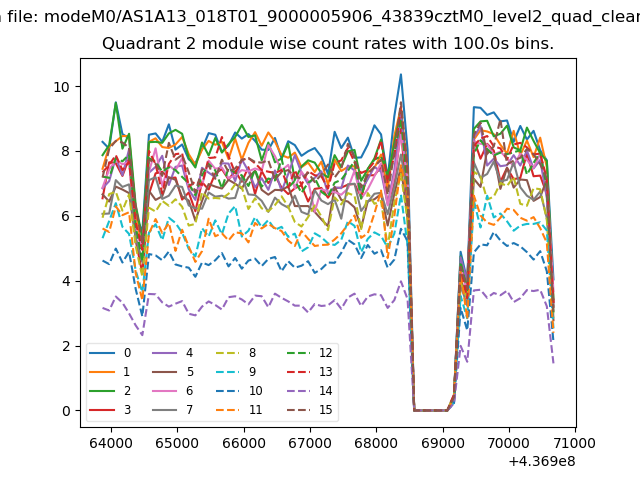
| Module-wise count rates for Quadrant B Data is divided into 100 sec bins |
 |
 |
| Module-wise count rates for Quadrant C Data is divided into 100 sec bins |
 |
 |
| Module-wise count rates for Quadrant D Data is divided into 100 sec bins |
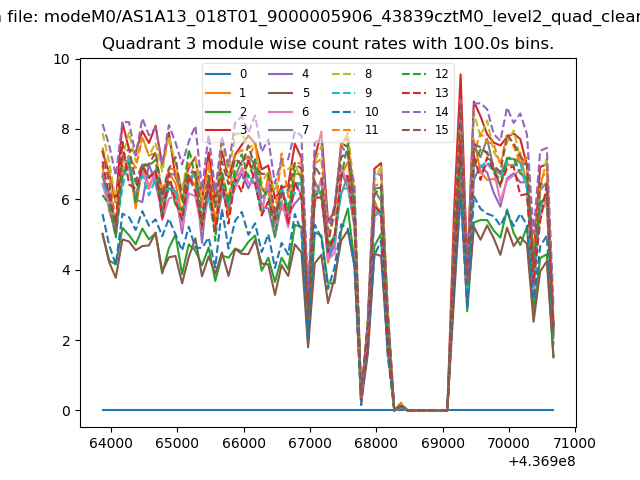 |
 |
| Parameter | Plot |
|---|---|
| CZT HV Monitor | 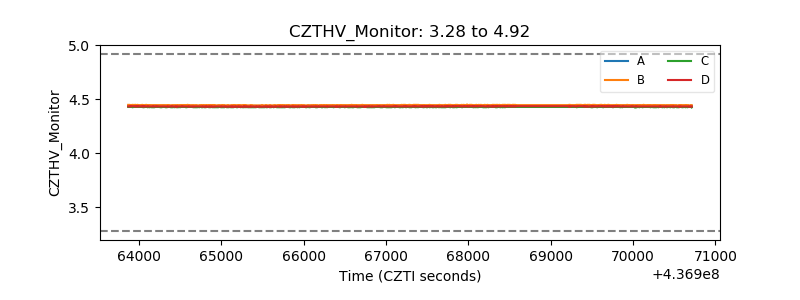 |
| D_VDD | 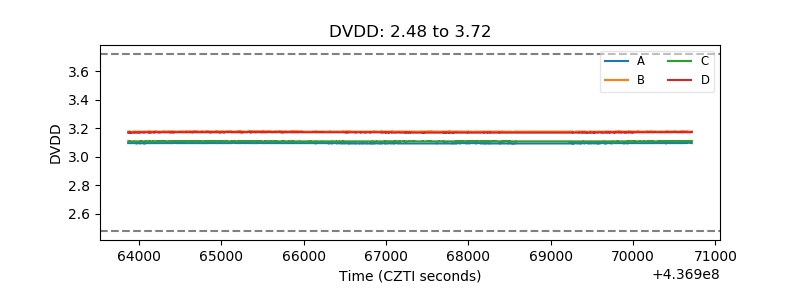 |
| Temperature 1 | 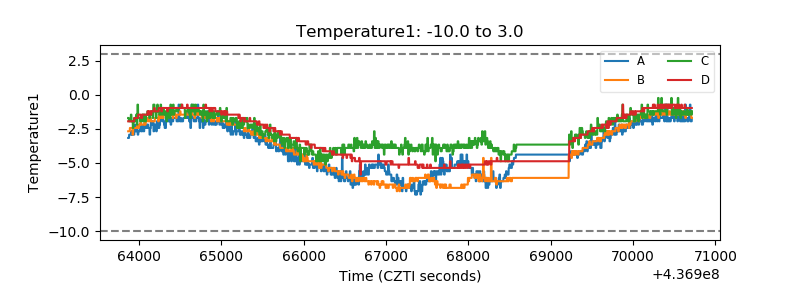 |
| Veto HV Monitor |  |
| Veto LLD | 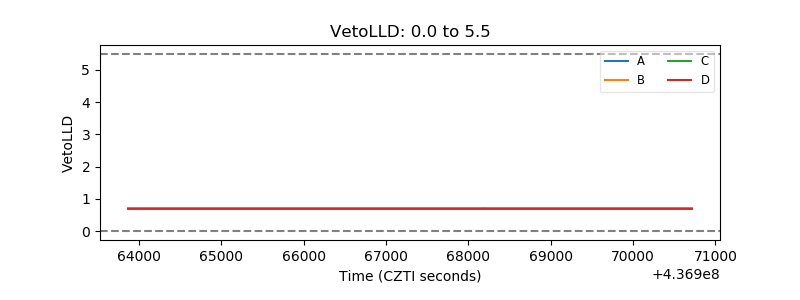 |
| Alpha Counter | 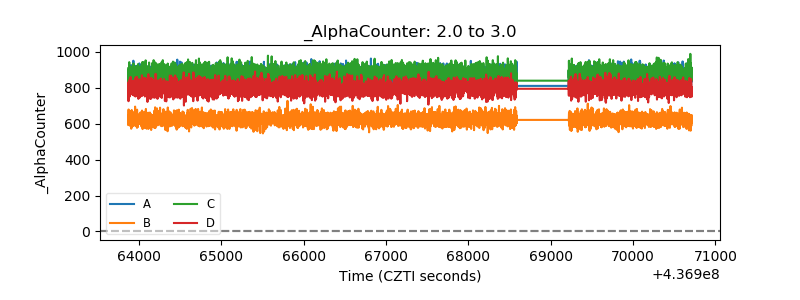 |
| _CPM_Rate | 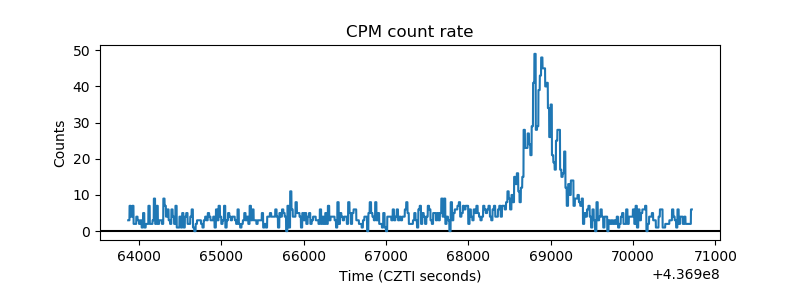 |
| CZT Counter | 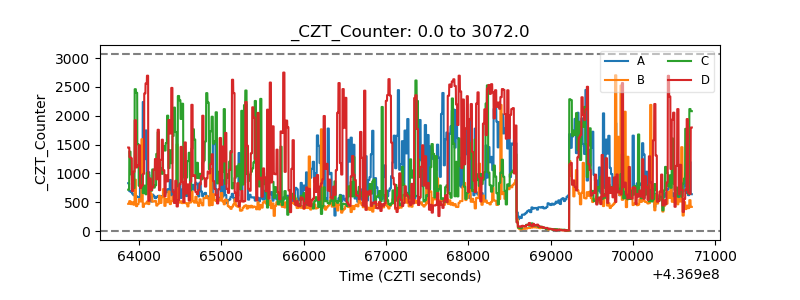 |
| +2.5 Volts monitor | 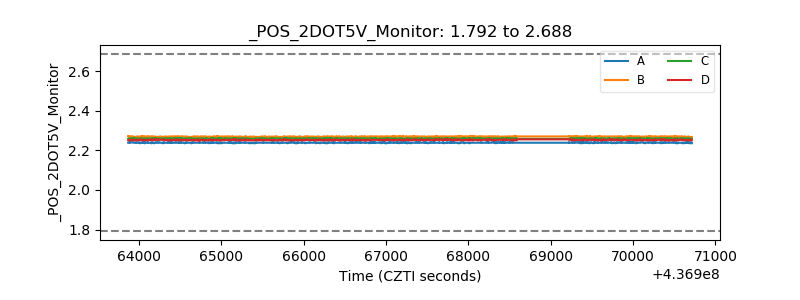 |
| +5 Volts monitor | 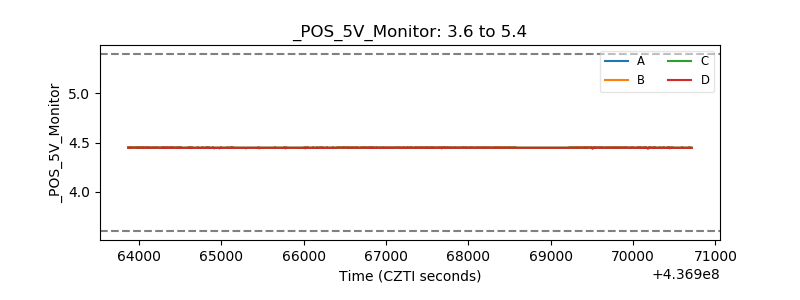 |
| _ROLL_ROT | 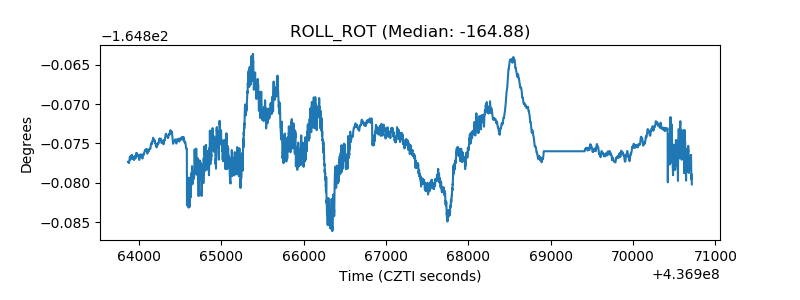 |
| _Roll_DEC | 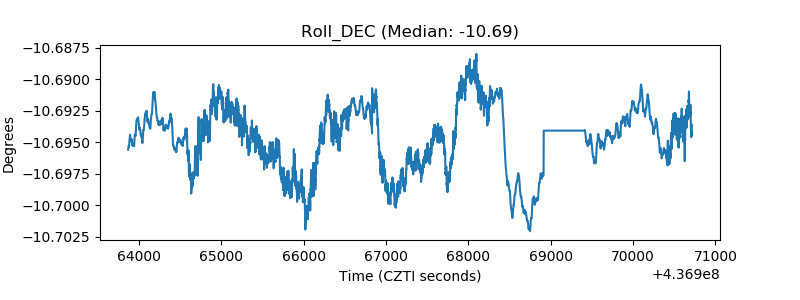 |
| _Roll_RA |  |
| Veto Counter | 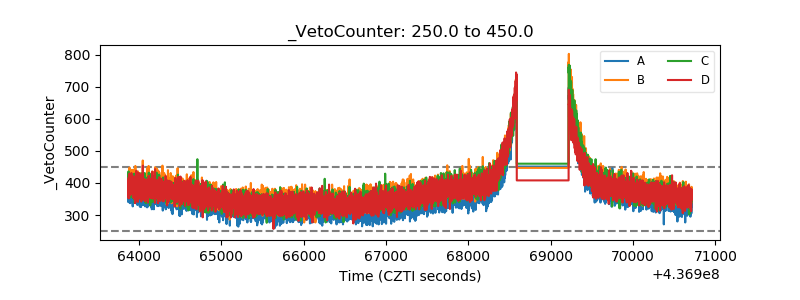 |