| Param | Original file | Final file |
|---|---|---|
| Filename | modeM0/AS1A13_018T01_9000005906_43840cztM0_level2.fits | modeM0/AS1A13_018T01_9000005906_43840cztM0_level2_quad_clean.evt |
| Size (bytes) | 754,920,000 | 121,109,760 |
| Size | 719.9 MB | 115.5 MB |
| Events in quadrant A | 6,027,231 | 821,284 |
| Events in quadrant B | 5,052,112 | 847,263 |
| Events in quadrant C | 8,410,535 | 773,290 |
| Events in quadrant D | 7,862,568 | 691,736 |
| Mode M0 | |||
|---|---|---|---|
| Quadrant | BADHDUFLAG | Total packets | Discarded packets |
| A | 0 | 23499 | 0 |
| B | 0 | 20146 | 0 |
| C | 0 | 30460 | 0 |
| D | 0 | 28701 | 0 |
| Mode SS | |||
|---|---|---|---|
| Quadrant | BADHDUFLAG | Total packets | Discarded packets |
| A | 0 | 154 | 0 |
| B | 0 | 154 | 0 |
| C | 0 | 154 | 0 |
| D | 0 | 154 | 0 |
| Quadrant | Total seconds | Saturated seconds | Saturation percentage |
|---|---|---|---|
| A | 7661 | 434 | 5.665057% |
| B | 7662 | 424 | 5.533803% |
| C | 7662 | 948 | 12.372749% |
| D | 7662 | 1108 | 14.460976% |
Noise dominated data is calculated using 1-second bins in cleaned event files. If a bin has >2000 counts, and if more than 50% of those come from <1% of pixels, then it is considered to be noise-dominated and hence unusable.
| Quadrant | # 1 sec bins | Bins with >0 counts | Bins with >2000 counts | High rate bins dominated by noise | Noise dominated (total time) | Noise dominated (detector-on time) | Marked lightcurve |
|---|---|---|---|---|---|---|---|
| A | 7661 | 7661 | 184 | 184 | 2.40% | 2.40% | 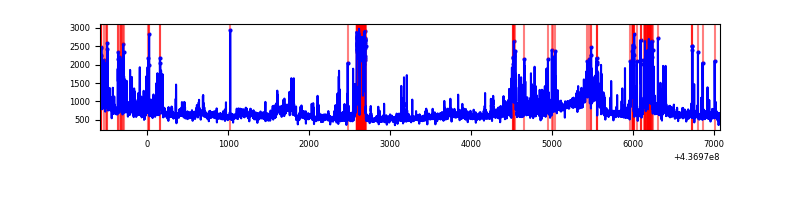 |
| B | 7662 | 7662 | 253 | 253 | 3.30% | 3.30% | 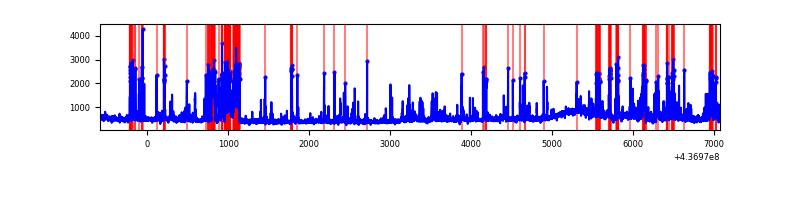 |
| C | 7662 | 7662 | 742 | 742 | 9.68% | 9.68% | 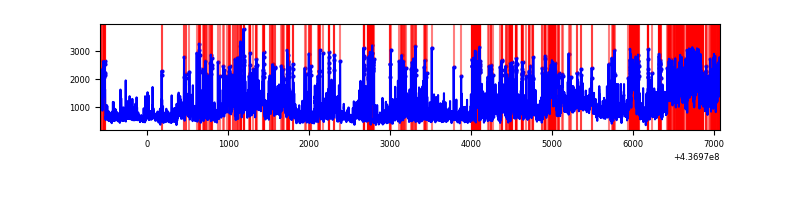 |
| D | 7662 | 7662 | 1015 | 1015 | 13.25% | 13.25% | 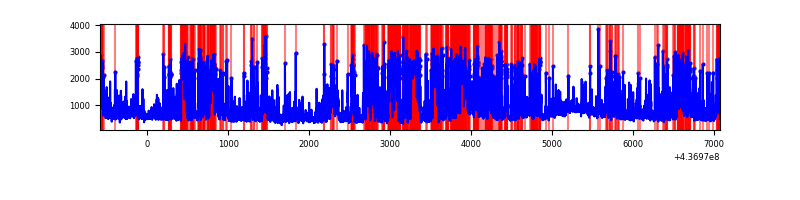 |
Top three noisy pixels from each quadrant. If the there are fewer than three noisy pixels in the level2.evt file, extra rows are filled as -1
| Pixel properties | Quadrant properties | ||||||
|---|---|---|---|---|---|---|---|
| Quadrant | DetID | PixID | Counts | Sigma | Mean | Median | Sigma |
| A | 15 | 223 | 1272871 | 6791.95 | 896 | 878 | 187.3 |
| A | 10 | 83 | 1063747 | 5675.31 | 896 | 878 | 187.3 |
| A | 8 | 4 | 73793 | 389.34 | 896 | 878 | 187.3 |
| B | 5 | 172 | 681215 | 3861.88 | 887 | 859 | 176.2 |
| B | 0 | 200 | 306547 | 1735.17 | 887 | 859 | 176.2 |
| B | 4 | 170 | 220394 | 1246.14 | 887 | 859 | 176.2 |
| C | 3 | 233 | 4784465 | 23673.43 | 853 | 859 | 202.1 |
| C | 15 | 158 | 149267 | 734.45 | 853 | 859 | 202.1 |
| C | 14 | 254 | 70800 | 346.13 | 853 | 859 | 202.1 |
| D | 4 | 221 | 1236906 | 5737.5 | 843 | 817 | 215.4 |
| D | 5 | 235 | 1168742 | 5421.1 | 843 | 817 | 215.4 |
| D | 1 | 52 | 737100 | 3417.57 | 843 | 817 | 215.4 |
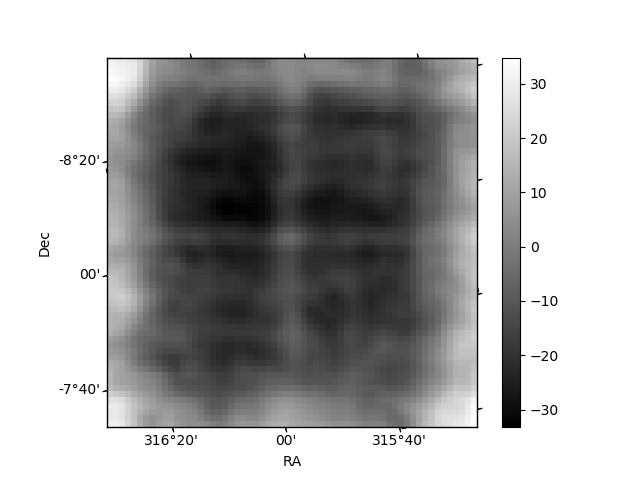
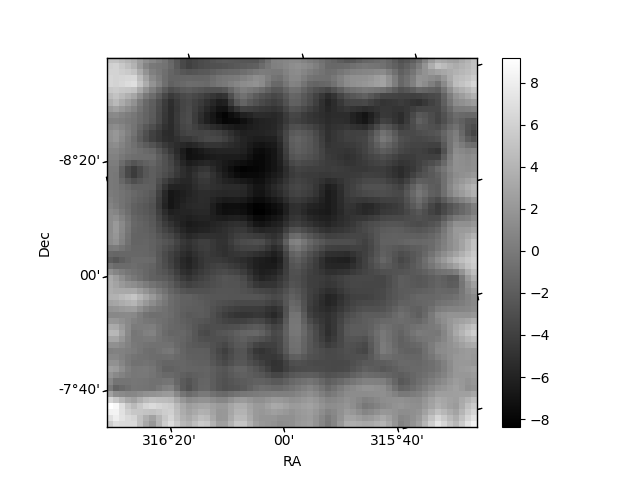
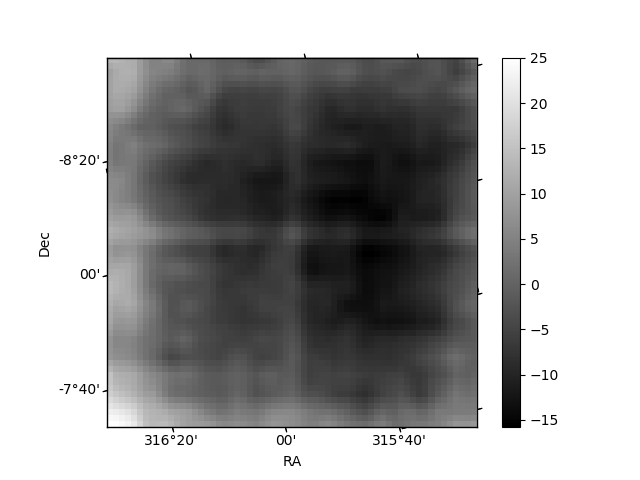
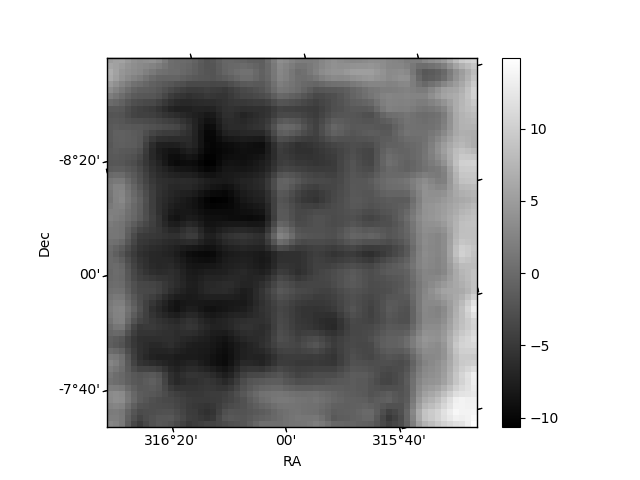
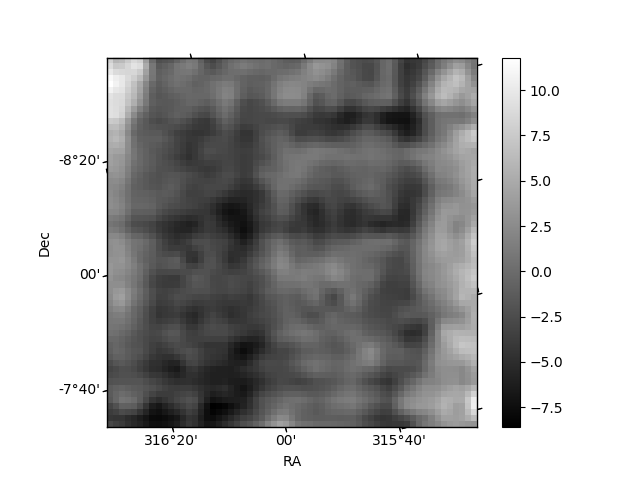
Histogram calculated using DETX and DETY for each event in the final _common_clean file
| Quadrant A | 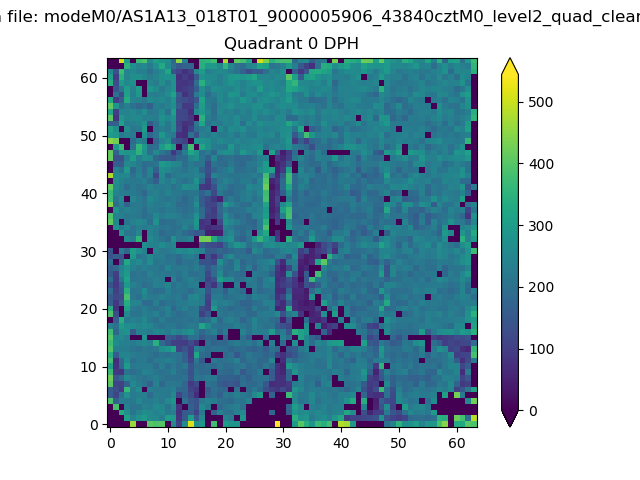 |
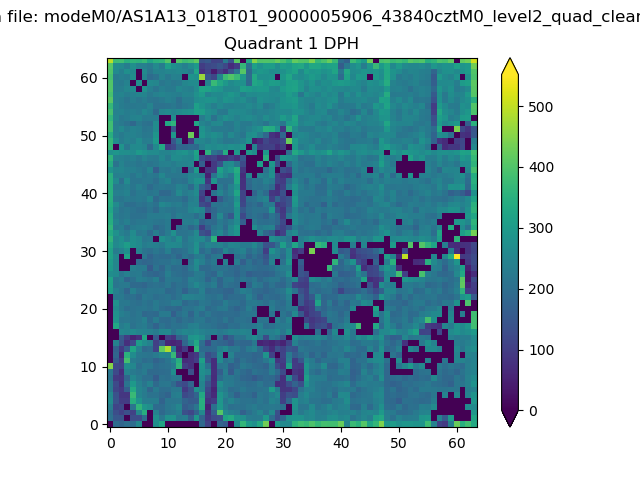 |
Quadrant B |
|---|---|---|---|
| Quadrant D | 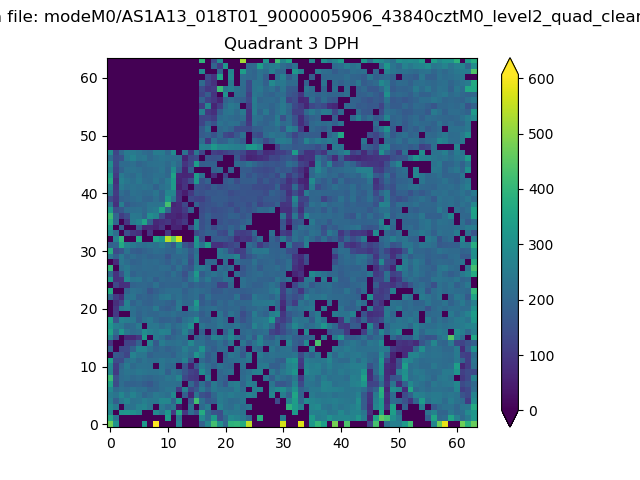 |
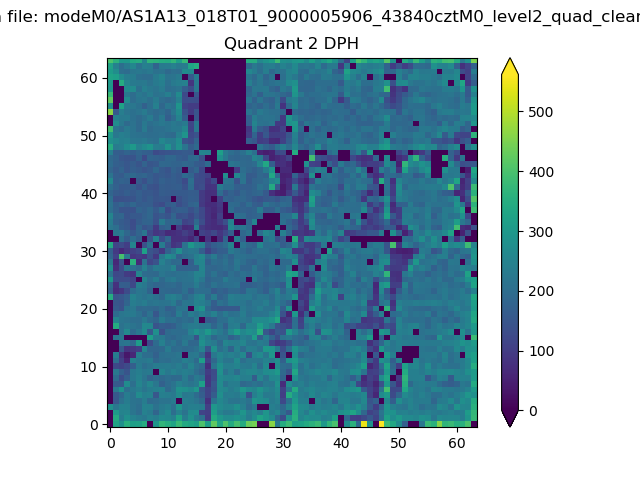 |
Quadrant C |
| Plot type | Count rate plots | Images |
|---|---|---|
| Comparison with Poisson distribution Blue bars denote a histogram of data divided into 1 sec bins. Red curve is a Poisson curve with rate = median count rate of data. |
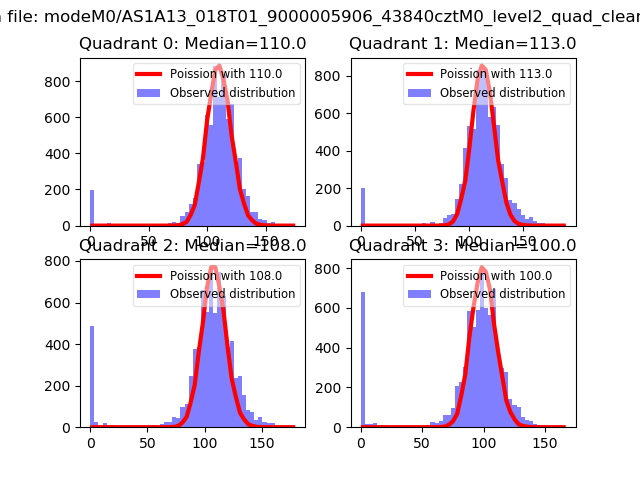 |
 |
| Quadrant-wise count rates Data is divided into 100 sec bins |
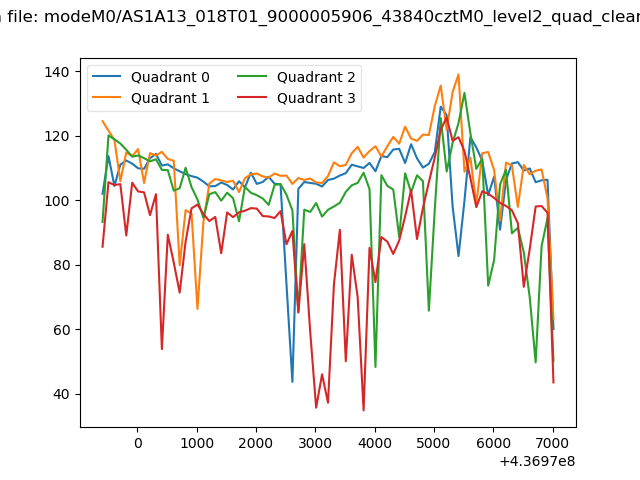 |
|
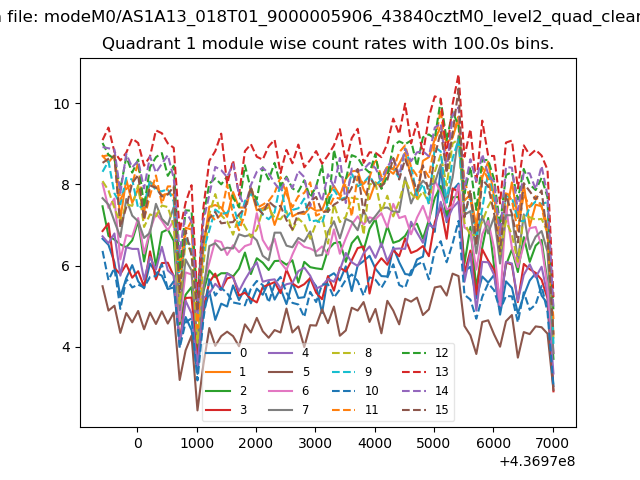
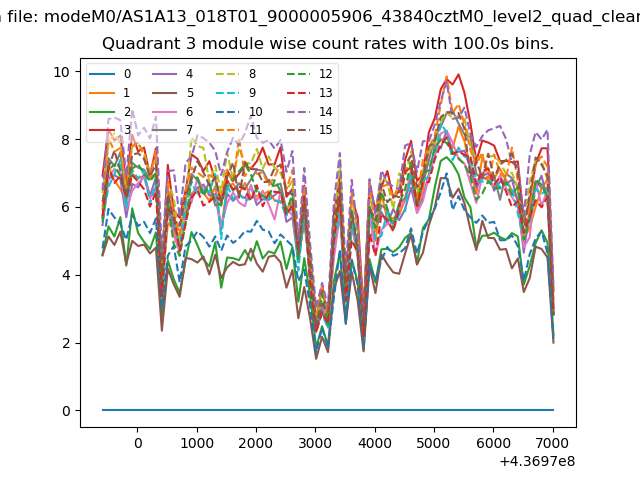
| Module-wise count rates for Quadrant A Data is divided into 100 sec bins |
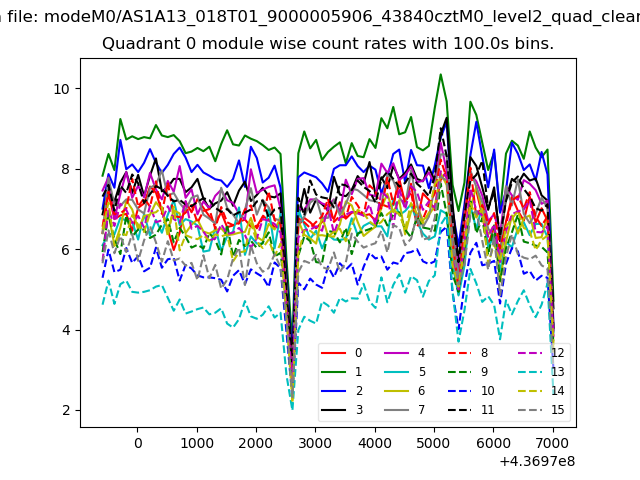 |
 |
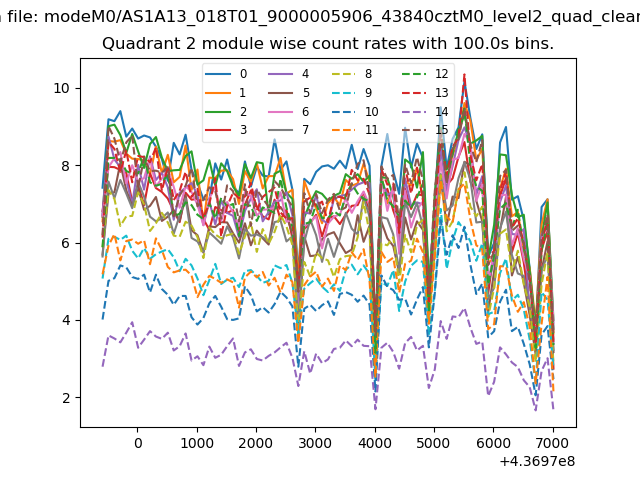
| Module-wise count rates for Quadrant B Data is divided into 100 sec bins |
 |
 |
| Module-wise count rates for Quadrant C Data is divided into 100 sec bins |
 |
 |
| Module-wise count rates for Quadrant D Data is divided into 100 sec bins |
 |
 |
| Parameter | Plot |
|---|---|
| CZT HV Monitor | 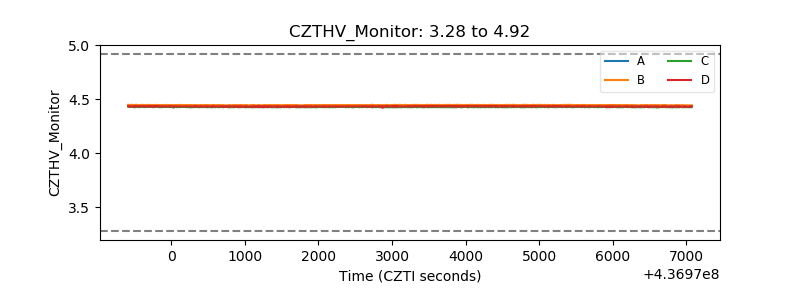 |
| D_VDD | 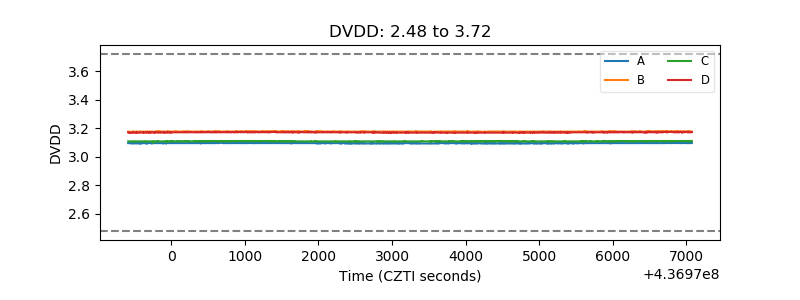 |
| Temperature 1 | 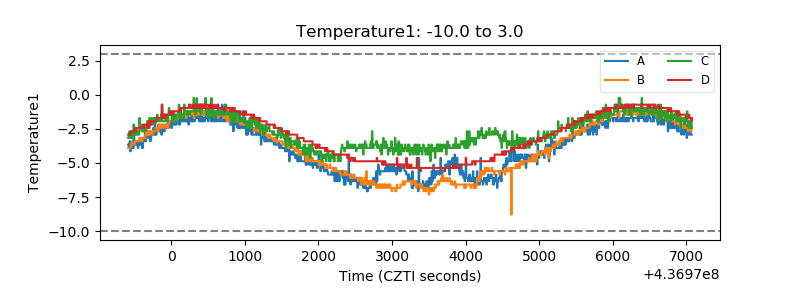 |
| Veto HV Monitor | 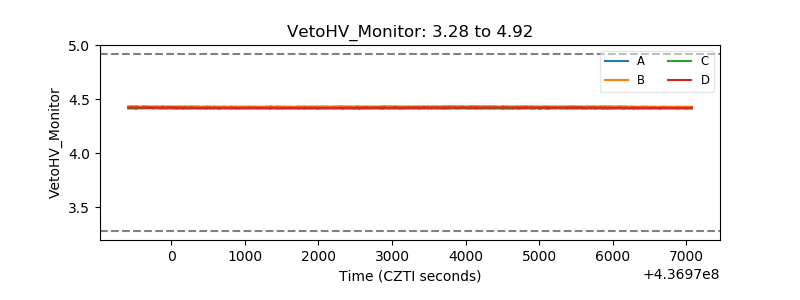 |
| Veto LLD | 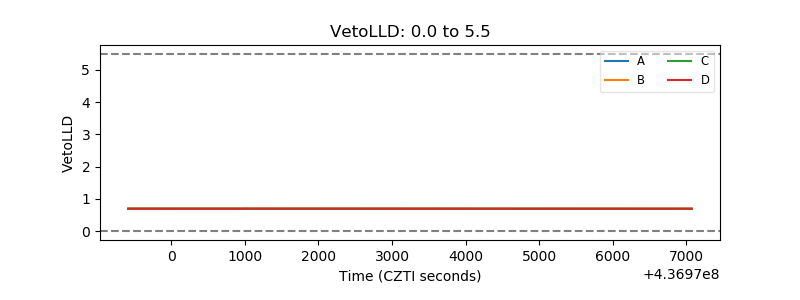 |
| Alpha Counter | 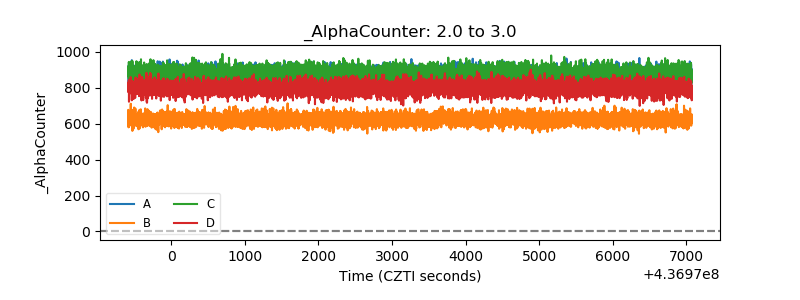 |
| _CPM_Rate | 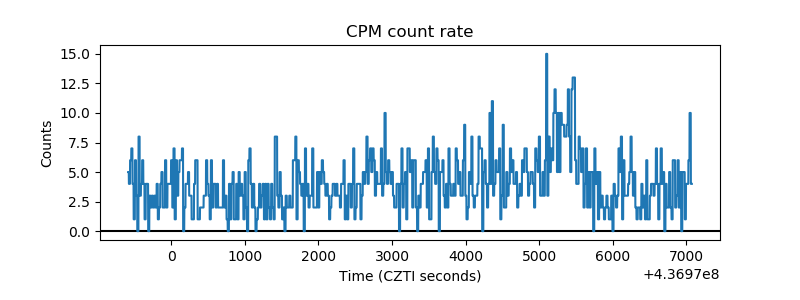 |
| CZT Counter | 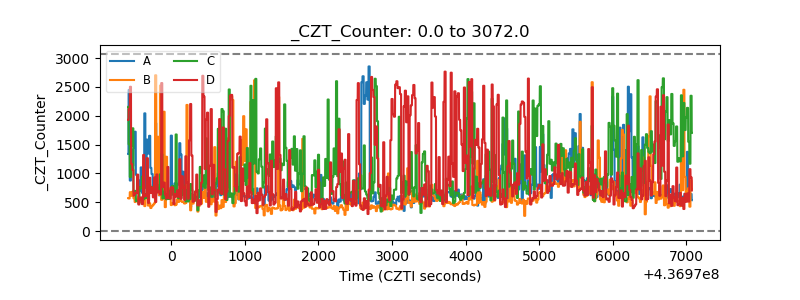 |
| +2.5 Volts monitor | 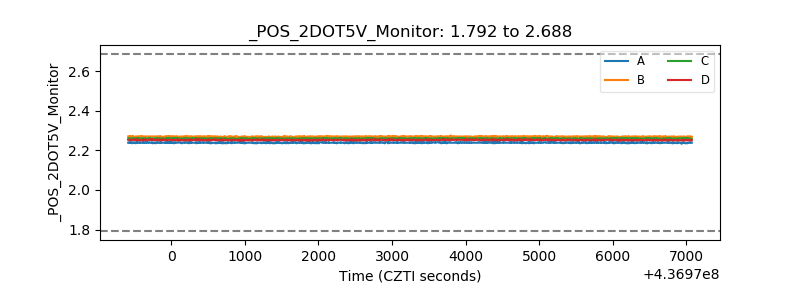 |
| +5 Volts monitor | 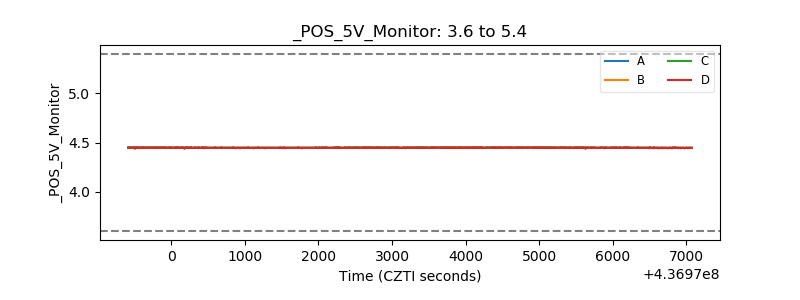 |
| _ROLL_ROT | 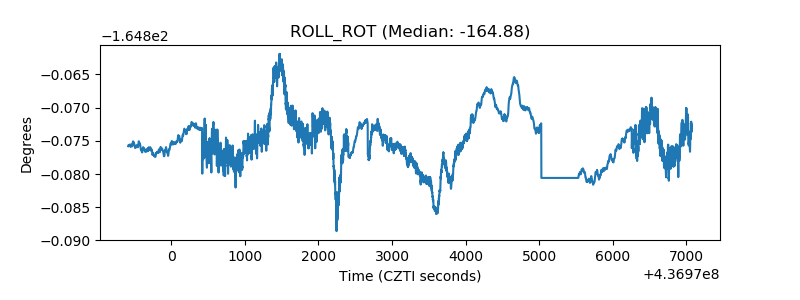 |
| _Roll_DEC | 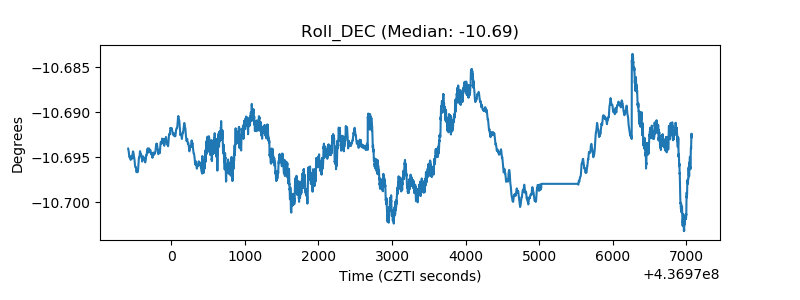 |
| _Roll_RA | 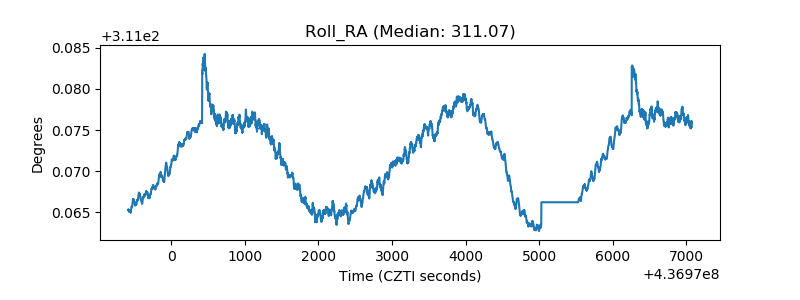 |
| Veto Counter | 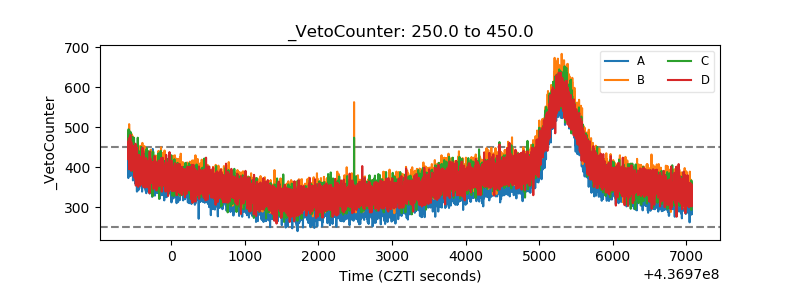 |