| Param | Original file | Final file |
|---|---|---|
| Filename | modeM0/AS1A13_018T01_9000005906_43841cztM0_level2.fits | modeM0/AS1A13_018T01_9000005906_43841cztM0_level2_quad_clean.evt |
| Size (bytes) | 855,336,960 | 123,390,720 |
| Size | 815.7 MB | 117.7 MB |
| Events in quadrant A | 6,623,040 | 849,462 |
| Events in quadrant B | 5,445,126 | 871,363 |
| Events in quadrant C | 10,914,093 | 765,476 |
| Events in quadrant D | 8,062,081 | 693,030 |
| Mode M0 | |||
|---|---|---|---|
| Quadrant | BADHDUFLAG | Total packets | Discarded packets |
| A | 0 | 25586 | 0 |
| B | 0 | 21566 | 0 |
| C | 0 | 38085 | 0 |
| D | 0 | 29489 | 0 |
| Mode SS | |||
|---|---|---|---|
| Quadrant | BADHDUFLAG | Total packets | Discarded packets |
| A | 0 | 160 | 0 |
| B | 0 | 160 | 0 |
| C | 0 | 160 | 0 |
| D | 0 | 160 | 0 |
| Quadrant | Total seconds | Saturated seconds | Saturation percentage |
|---|---|---|---|
| A | 8001 | 403 | 5.036870% |
| B | 8002 | 373 | 4.661335% |
| C | 8002 | 1381 | 17.258185% |
| D | 8002 | 1155 | 14.433892% |
Noise dominated data is calculated using 1-second bins in cleaned event files. If a bin has >2000 counts, and if more than 50% of those come from <1% of pixels, then it is considered to be noise-dominated and hence unusable.
| Quadrant | # 1 sec bins | Bins with >0 counts | Bins with >2000 counts | High rate bins dominated by noise | Noise dominated (total time) | Noise dominated (detector-on time) | Marked lightcurve |
|---|---|---|---|---|---|---|---|
| A | 8001 | 8001 | 273 | 273 | 3.41% | 3.41% | 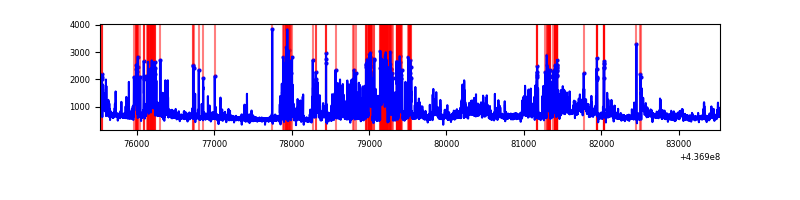 |
| B | 8001 | 8001 | 256 | 256 | 3.20% | 3.20% | 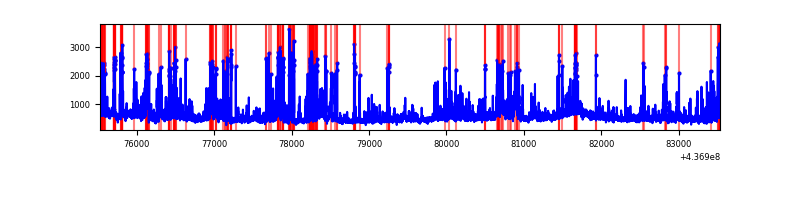 |
| C | 8002 | 8002 | 1280 | 1280 | 16.00% | 16.00% | 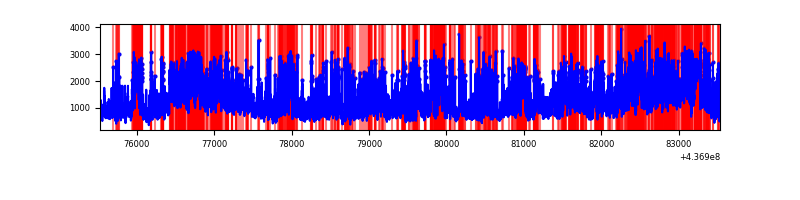 |
| D | 8002 | 8002 | 1076 | 1076 | 13.45% | 13.45% | 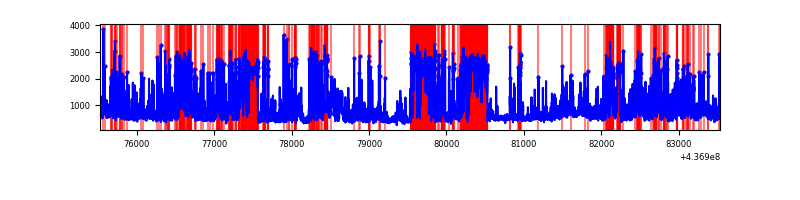 |
Top three noisy pixels from each quadrant. If the there are fewer than three noisy pixels in the level2.evt file, extra rows are filled as -1
| Pixel properties | Quadrant properties | ||||||
|---|---|---|---|---|---|---|---|
| Quadrant | DetID | PixID | Counts | Sigma | Mean | Median | Sigma |
| A | 15 | 223 | 1877743 | 9968.64 | 901 | 883 | 188.3 |
| A | 10 | 83 | 1107131 | 5875.66 | 901 | 883 | 188.3 |
| A | 2 | 79 | 47101 | 245.48 | 901 | 883 | 188.3 |
| B | 0 | 200 | 561634 | 3183.39 | 892 | 867 | 176.2 |
| B | 5 | 235 | 361512 | 2047.33 | 892 | 867 | 176.2 |
| B | 5 | 172 | 315566 | 1786.5 | 892 | 867 | 176.2 |
| C | 3 | 233 | 5898512 | 29526.19 | 844 | 849 | 199.7 |
| C | 15 | 158 | 1447368 | 7241.89 | 844 | 849 | 199.7 |
| C | 15 | 174 | 122775 | 610.41 | 844 | 849 | 199.7 |
| D | 5 | 235 | 1657379 | 7952.35 | 829 | 803 | 208.3 |
| D | 10 | 102 | 1272725 | 6105.83 | 829 | 803 | 208.3 |
| D | 12 | 2 | 371422 | 1779.15 | 829 | 803 | 208.3 |
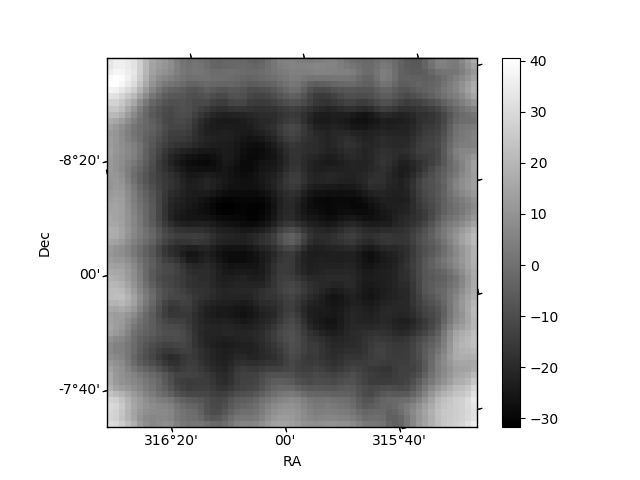
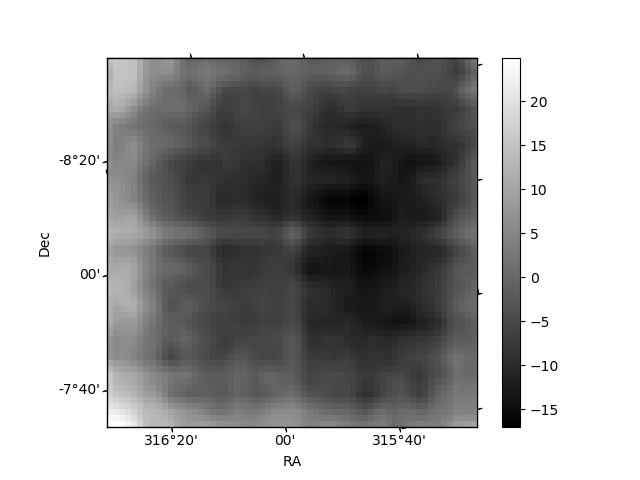
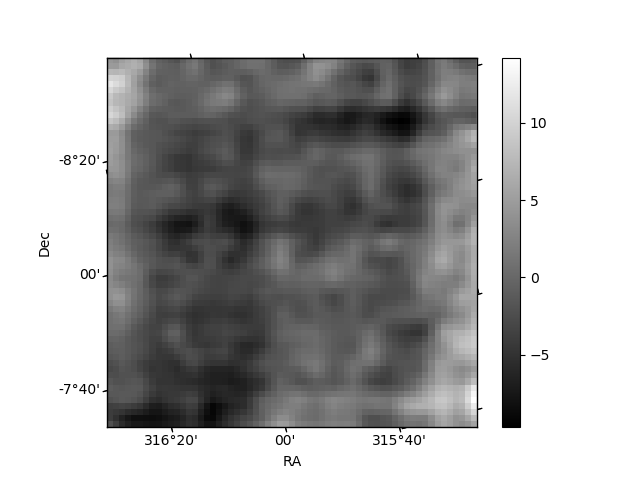
Histogram calculated using DETX and DETY for each event in the final _common_clean file
| Quadrant A | 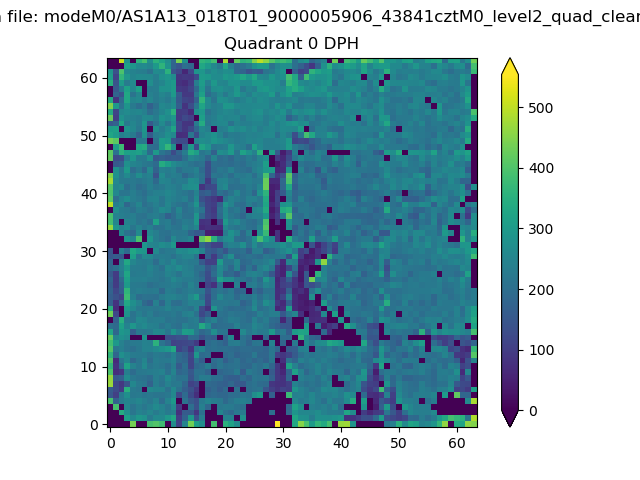 |
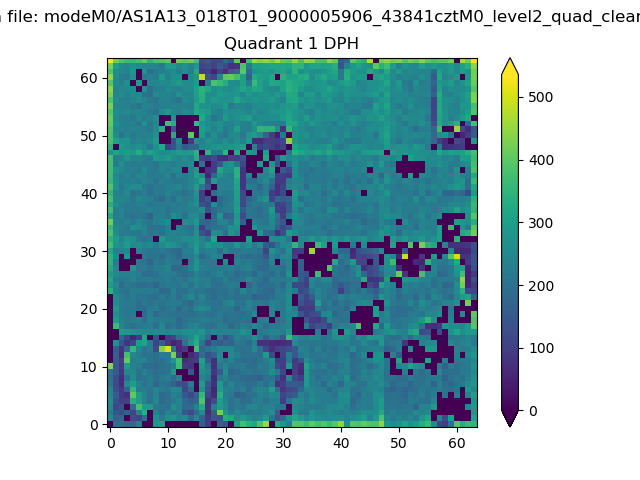 |
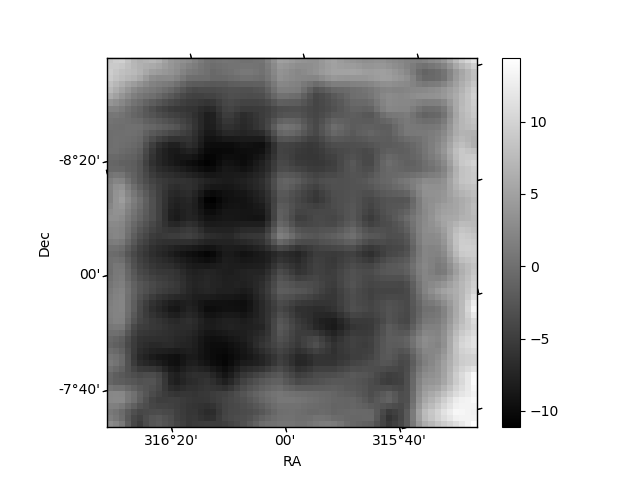
Quadrant B |
|---|---|---|---|
| Quadrant D | 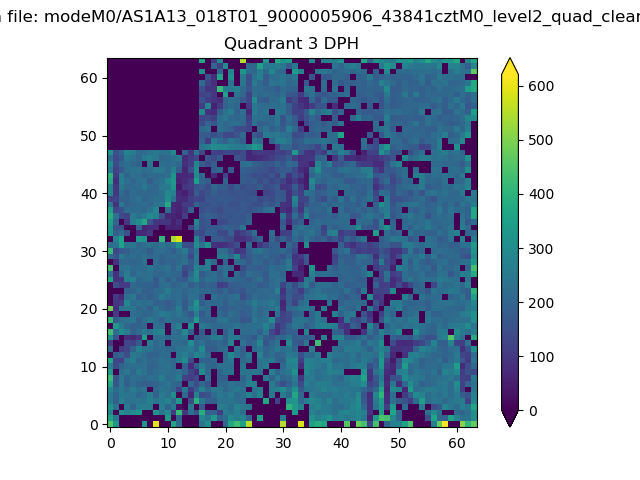 |
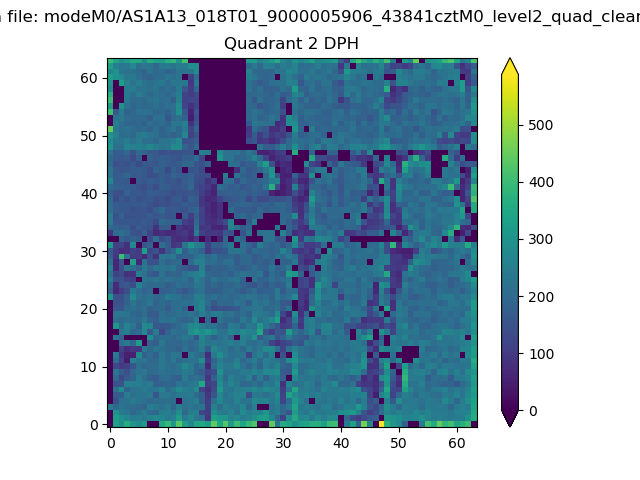 |
Quadrant C |
| Plot type | Count rate plots | Images |
|---|---|---|
| Comparison with Poisson distribution Blue bars denote a histogram of data divided into 1 sec bins. Red curve is a Poisson curve with rate = median count rate of data. |
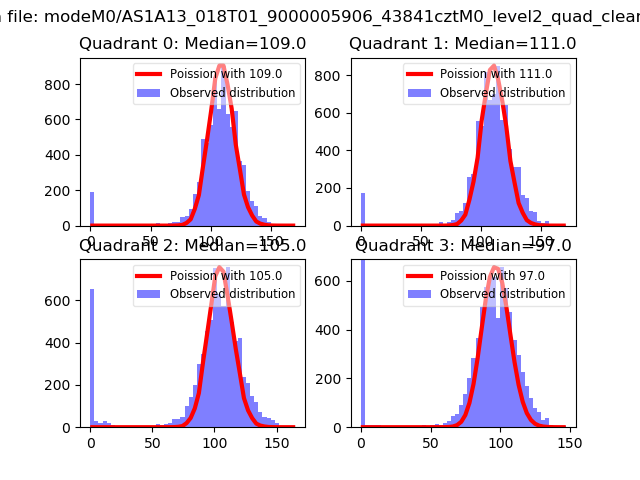 |
 |
| Quadrant-wise count rates Data is divided into 100 sec bins |
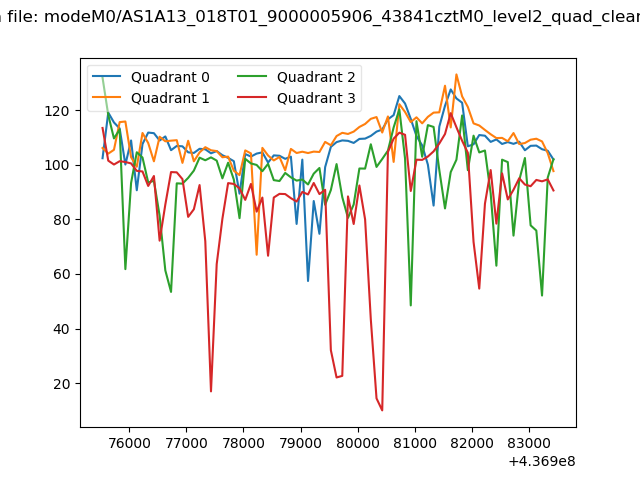 |
|
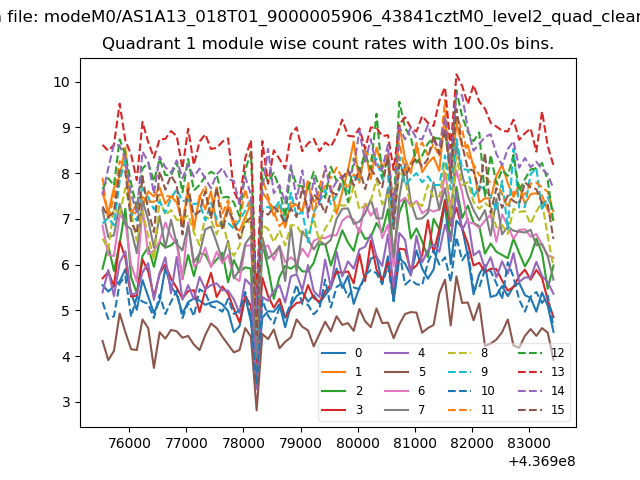
| Module-wise count rates for Quadrant A Data is divided into 100 sec bins |
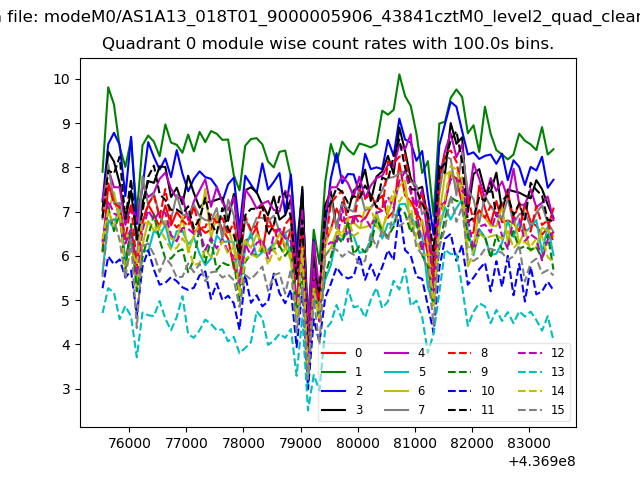 |
 |
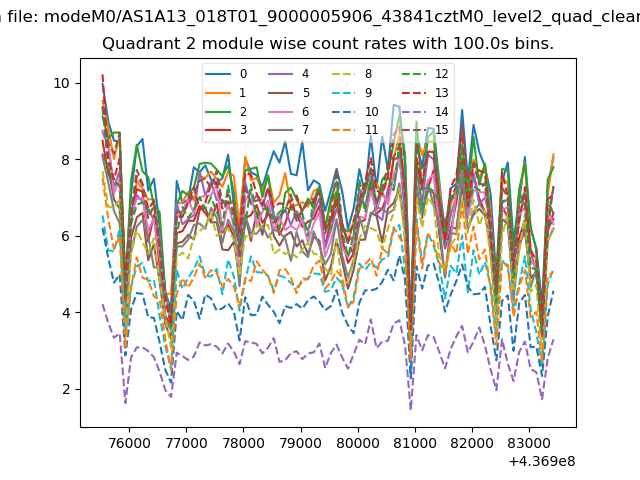
| Module-wise count rates for Quadrant B Data is divided into 100 sec bins |
 |
 |
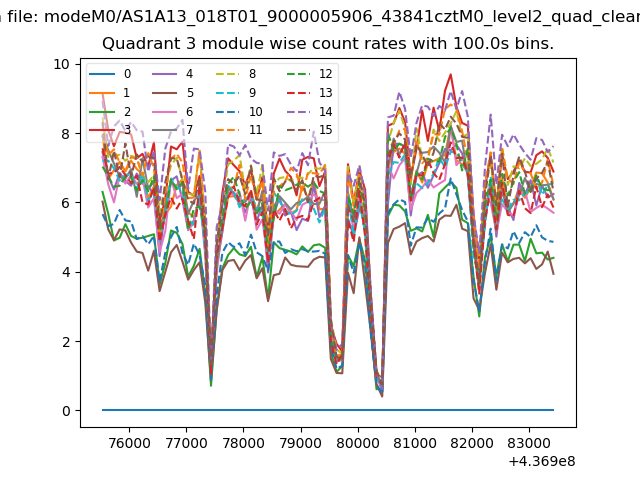
| Module-wise count rates for Quadrant C Data is divided into 100 sec bins |
 |
 |
| Module-wise count rates for Quadrant D Data is divided into 100 sec bins |
 |
 |
| Parameter | Plot |
|---|---|
| CZT HV Monitor | 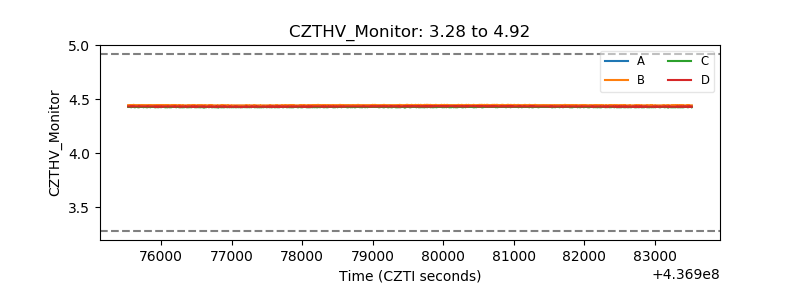 |
| D_VDD | 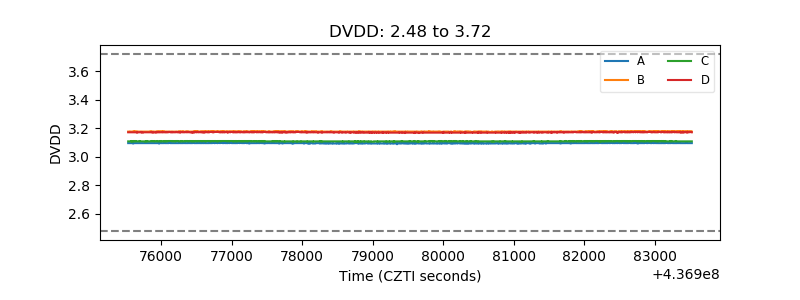 |
| Temperature 1 | 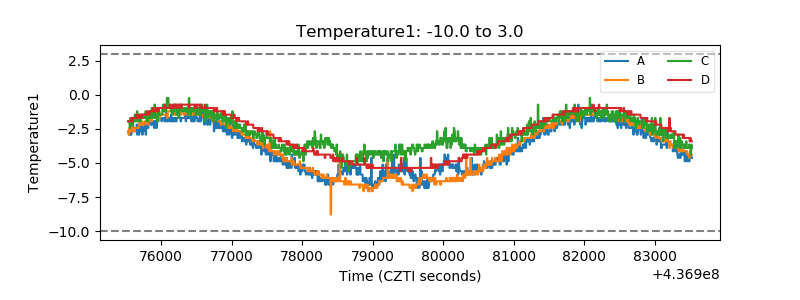 |
| Veto HV Monitor | 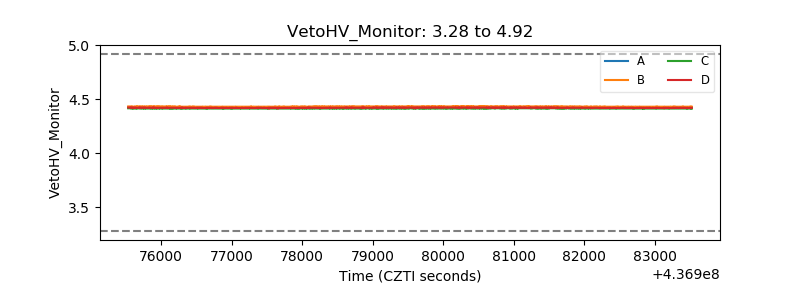 |
| Veto LLD | 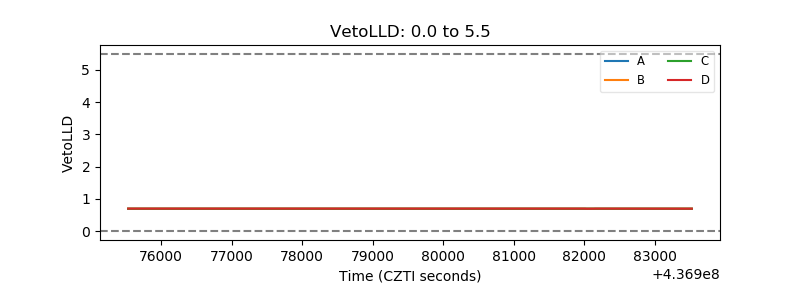 |
| Alpha Counter | 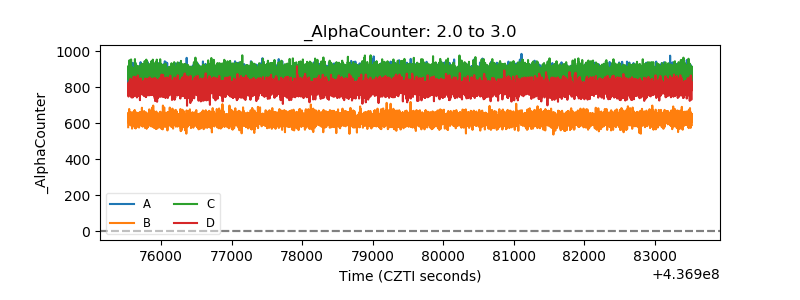 |
| _CPM_Rate | 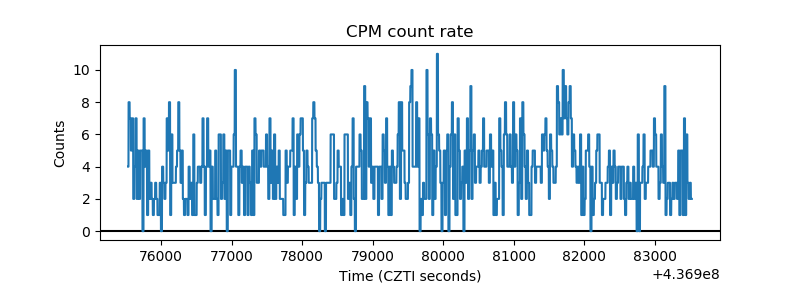 |
| CZT Counter | 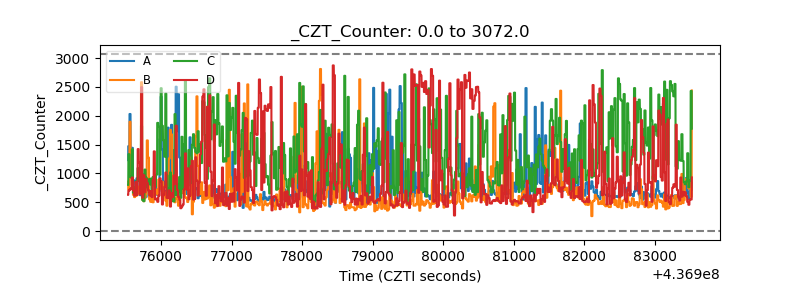 |
| +2.5 Volts monitor | 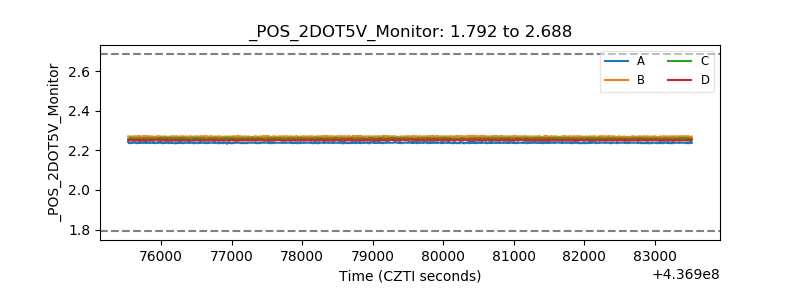 |
| +5 Volts monitor | 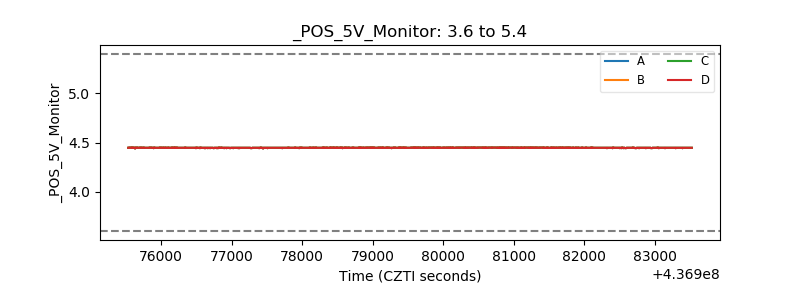 |
| _ROLL_ROT | 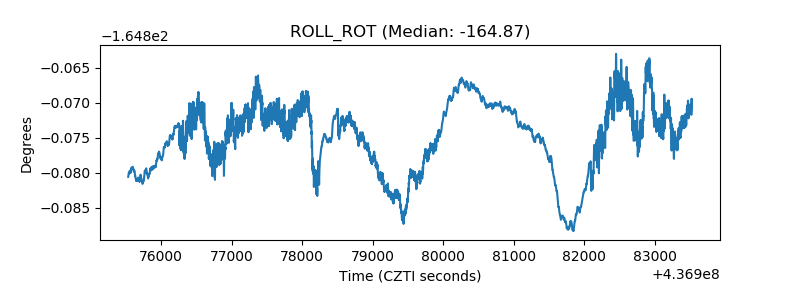 |
| _Roll_DEC | 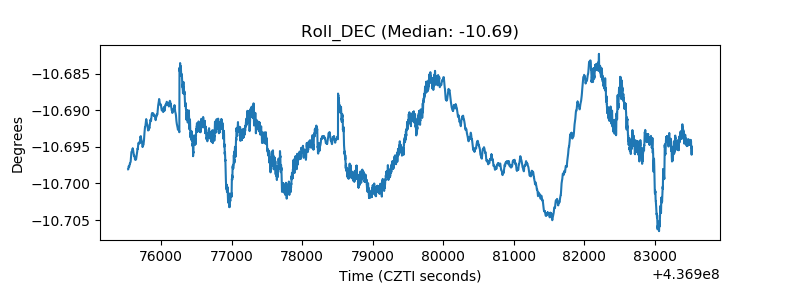 |
| _Roll_RA | 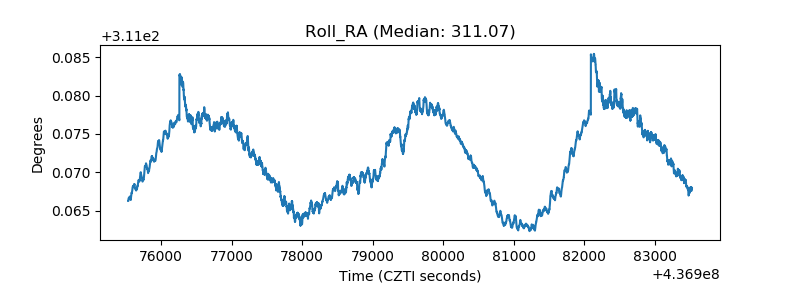 |
| Veto Counter | 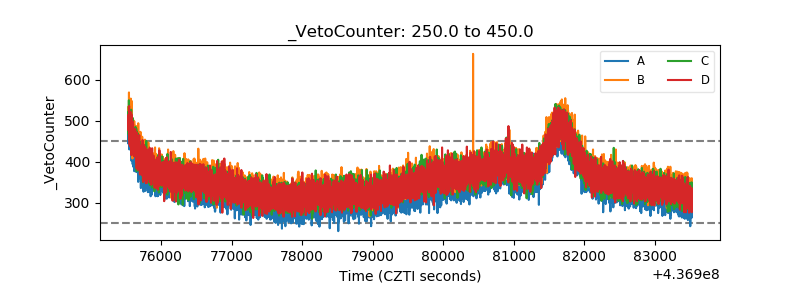 |