| Param | Original file | Final file |
|---|---|---|
| Filename | modeM0/AS1A13_018T01_9000005906_43844cztM0_level2.fits | modeM0/AS1A13_018T01_9000005906_43844cztM0_level2_quad_clean.evt |
| Size (bytes) | 858,205,440 | 114,963,840 |
| Size | 818.4 MB | 109.6 MB |
| Events in quadrant A | 6,267,039 | 808,503 |
| Events in quadrant B | 4,995,794 | 840,933 |
| Events in quadrant C | 13,224,589 | 565,798 |
| Events in quadrant D | 6,675,036 | 719,932 |
| Mode M0 | |||
|---|---|---|---|
| Quadrant | BADHDUFLAG | Total packets | Discarded packets |
| A | 0 | 24331 | 257 |
| B | 0 | 20367 | 199 |
| C | 0 | 45628 | 897 |
| D | 0 | 25548 | 415 |
| Mode SS | |||
|---|---|---|---|
| Quadrant | BADHDUFLAG | Total packets | Discarded packets |
| A | 0 | 159 | 1 |
| B | 0 | 160 | 0 |
| C | 0 | 160 | 0 |
| D | 0 | 160 | 0 |
| Mode M9 | |||
|---|---|---|---|
| Quadrant | BADHDUFLAG | Total packets | Discarded packets |
| A | 0 | 3 | 0 |
| B | 0 | 3 | 0 |
| C | 0 | 3 | 0 |
| D | 0 | 3 | 0 |
| Quadrant | Total seconds | Saturated seconds | Saturation percentage |
|---|---|---|---|
| A | 7856 | 464 | 5.906314% |
| B | 7865 | 341 | 4.335664% |
| C | 7785 | 2931 | 37.649326% |
| D | 7837 | 629 | 8.026030% |
Noise dominated data is calculated using 1-second bins in cleaned event files. If a bin has >2000 counts, and if more than 50% of those come from <1% of pixels, then it is considered to be noise-dominated and hence unusable.
| Quadrant | # 1 sec bins | Bins with >0 counts | Bins with >2000 counts | High rate bins dominated by noise | Noise dominated (total time) | Noise dominated (detector-on time) | Marked lightcurve |
|---|---|---|---|---|---|---|---|
| A | 8199 | 7926 | 299 | 299 | 3.65% | 3.77% | 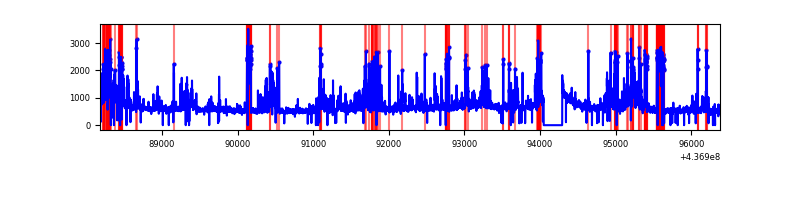 |
| B | 8200 | 7925 | 155 | 155 | 1.89% | 1.96% | 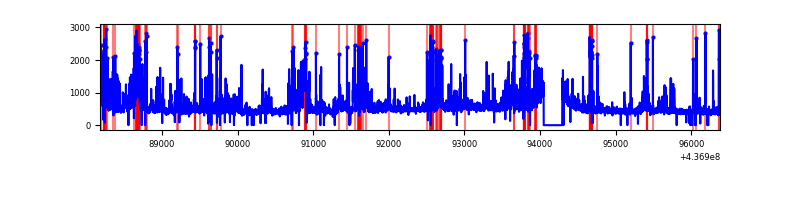 |
| C | 8200 | 7881 | 2651 | 2651 | 32.33% | 33.64% | 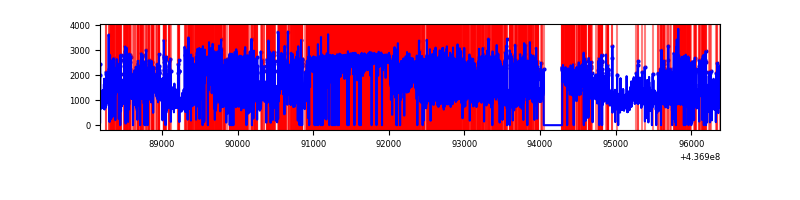 |
| D | 8200 | 7909 | 542 | 542 | 6.61% | 6.85% | 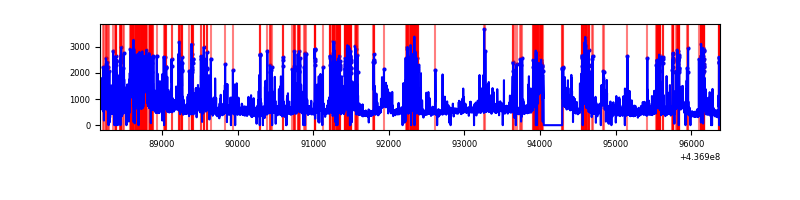 |
Top three noisy pixels from each quadrant. If the there are fewer than three noisy pixels in the level2.evt file, extra rows are filled as -1
| Pixel properties | Quadrant properties | ||||||
|---|---|---|---|---|---|---|---|
| Quadrant | DetID | PixID | Counts | Sigma | Mean | Median | Sigma |
| A | 15 | 223 | 1668106 | 9392.45 | 857 | 841 | 177.5 |
| A | 10 | 83 | 1095689 | 6167.77 | 857 | 841 | 177.5 |
| A | 2 | 79 | 45659 | 252.48 | 857 | 841 | 177.5 |
| B | 5 | 235 | 595396 | 3513.04 | 866 | 844 | 169.2 |
| B | 5 | 172 | 222437 | 1309.33 | 866 | 844 | 169.2 |
| B | 0 | 213 | 217160 | 1278.15 | 866 | 844 | 169.2 |
| C | 3 | 233 | 6070656 | 35925.99 | 717 | 721 | 169.0 |
| C | 15 | 174 | 2036133 | 12046.95 | 717 | 721 | 169.0 |
| C | 15 | 158 | 1638552 | 9693.79 | 717 | 721 | 169.0 |
| D | 5 | 235 | 936145 | 4425.39 | 829 | 800 | 211.4 |
| D | 10 | 102 | 685222 | 3238.2 | 829 | 800 | 211.4 |
| D | 4 | 221 | 360245 | 1700.64 | 829 | 800 | 211.4 |
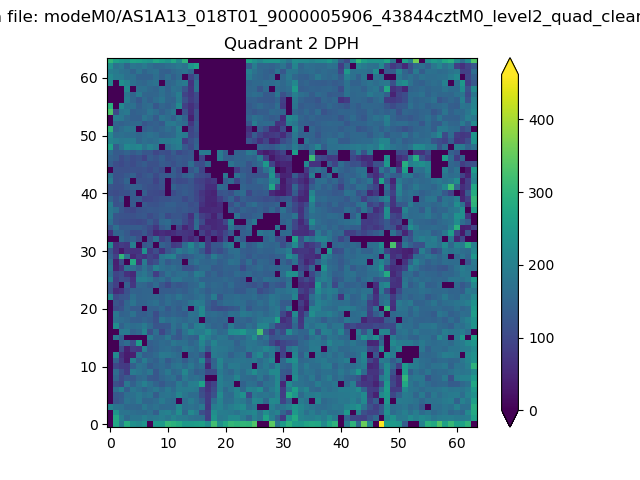
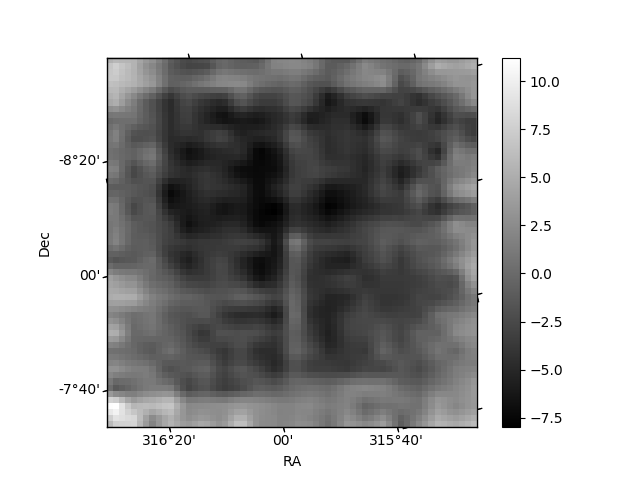
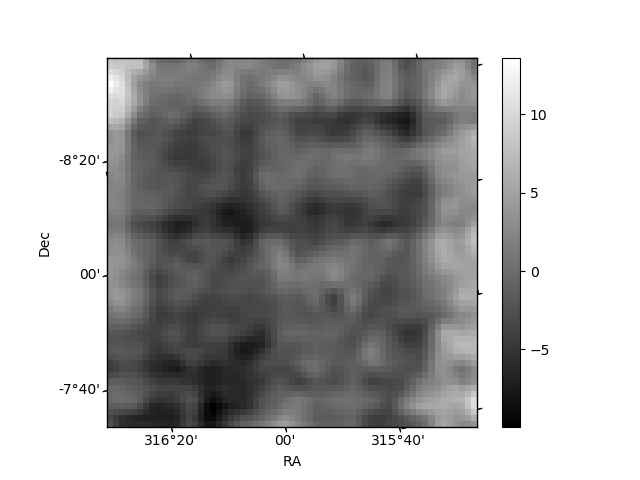
Histogram calculated using DETX and DETY for each event in the final _common_clean file
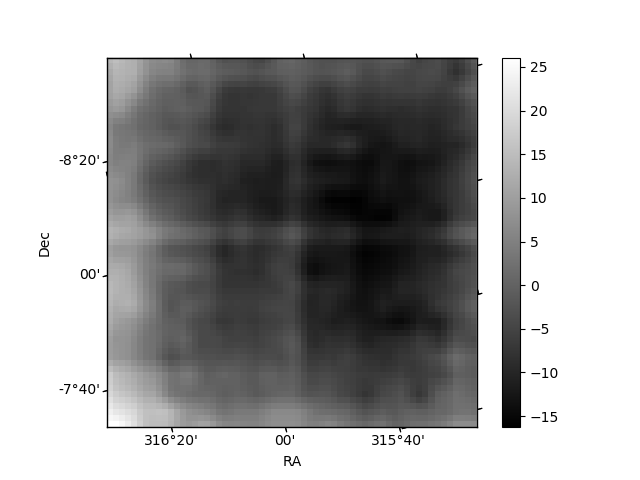
| Quadrant A | 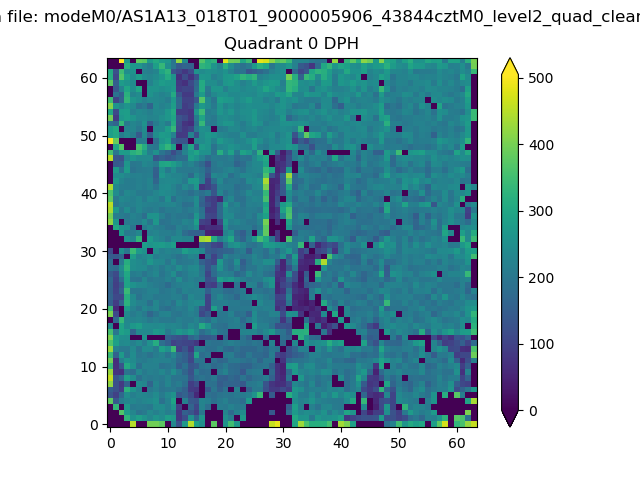 |
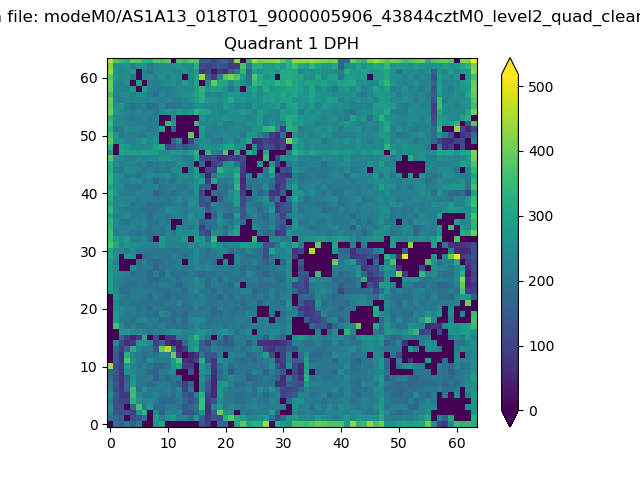 |
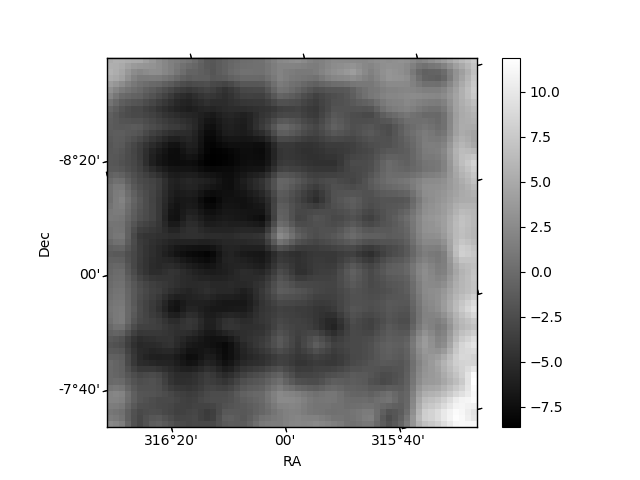
Quadrant B |
|---|---|---|---|
| Quadrant D | 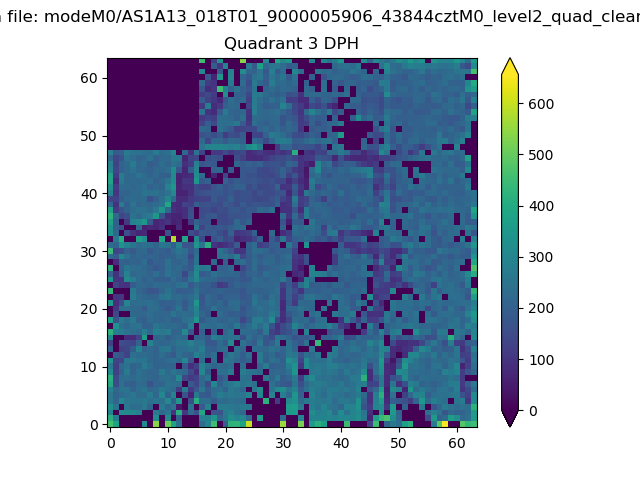 |
 |
Quadrant C |
| Plot type | Count rate plots | Images |
|---|---|---|
| Comparison with Poisson distribution Blue bars denote a histogram of data divided into 1 sec bins. Red curve is a Poisson curve with rate = median count rate of data. |
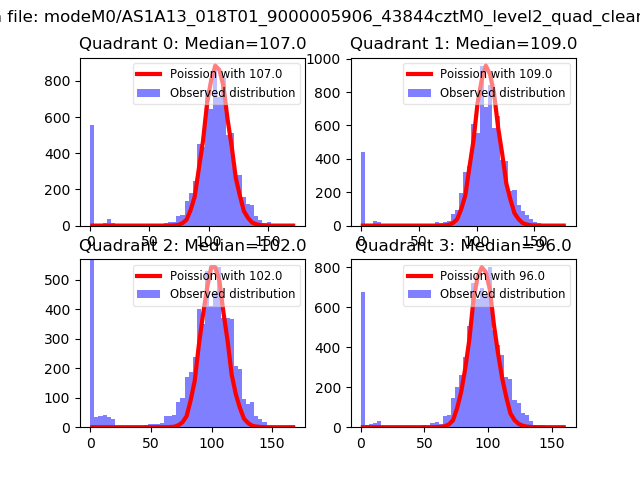 |
 |
| Quadrant-wise count rates Data is divided into 100 sec bins |
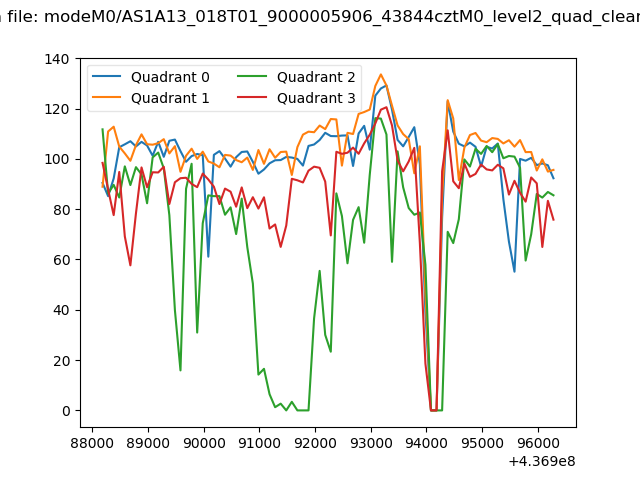 |
|
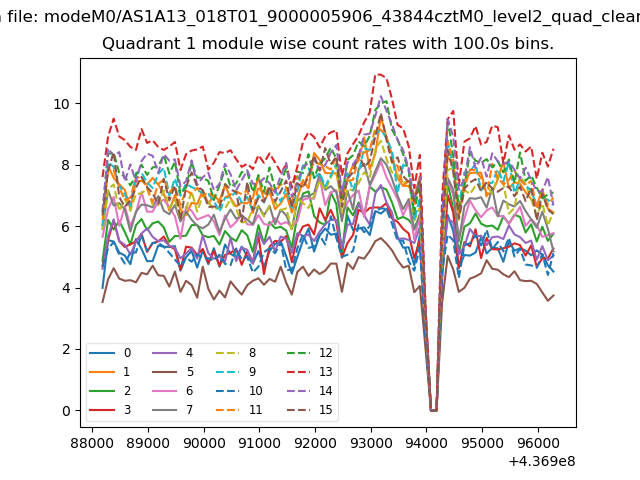
| Module-wise count rates for Quadrant A Data is divided into 100 sec bins |
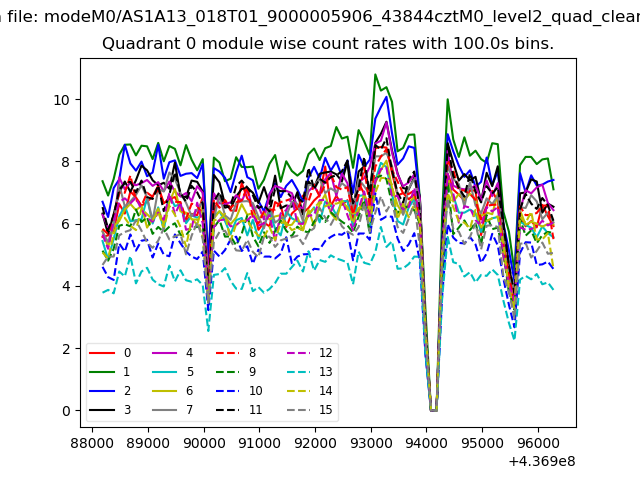 |
 |
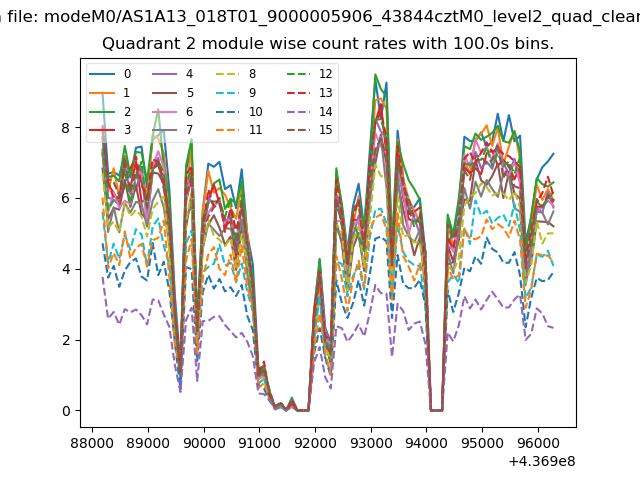
| Module-wise count rates for Quadrant B Data is divided into 100 sec bins |
 |
 |
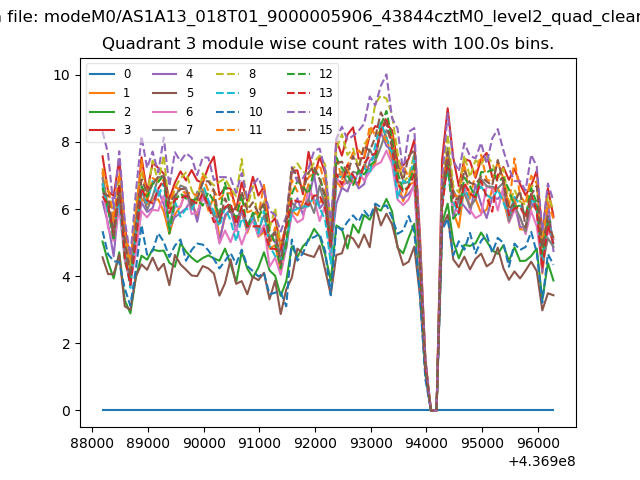
| Module-wise count rates for Quadrant C Data is divided into 100 sec bins |
 |
 |
| Module-wise count rates for Quadrant D Data is divided into 100 sec bins |
 |
 |
| Parameter | Plot |
|---|---|
| CZT HV Monitor | 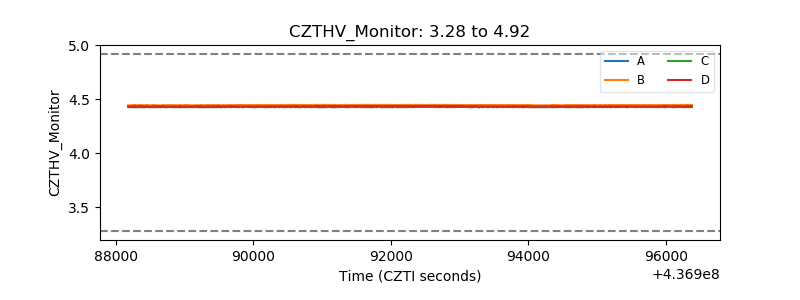 |
| D_VDD | 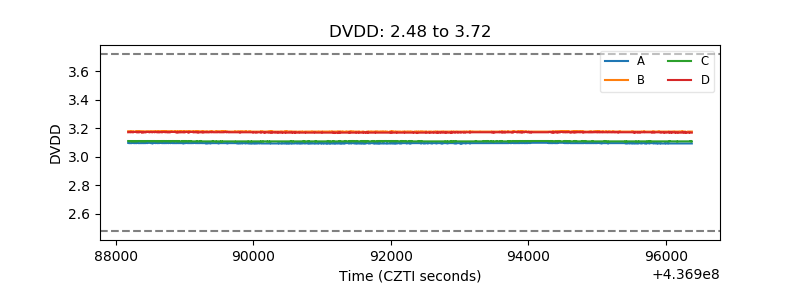 |
| Temperature 1 | 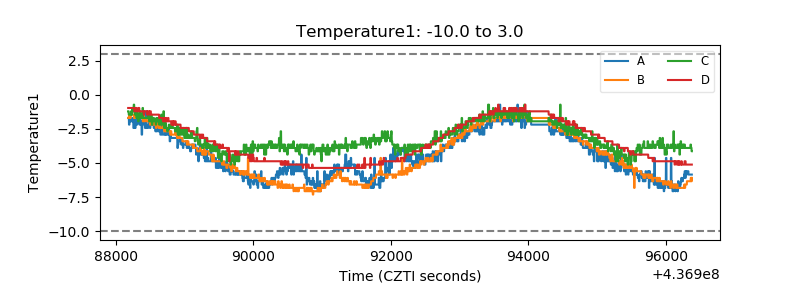 |
| Veto HV Monitor | 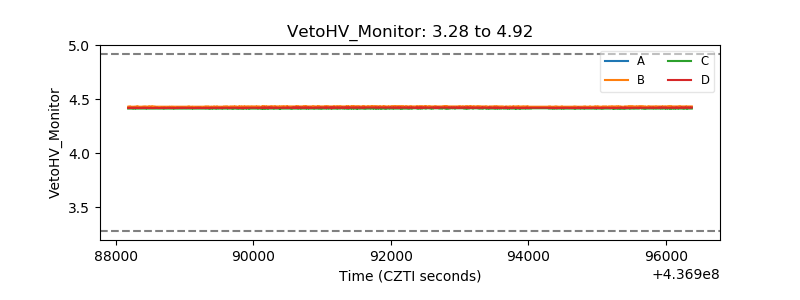 |
| Veto LLD | 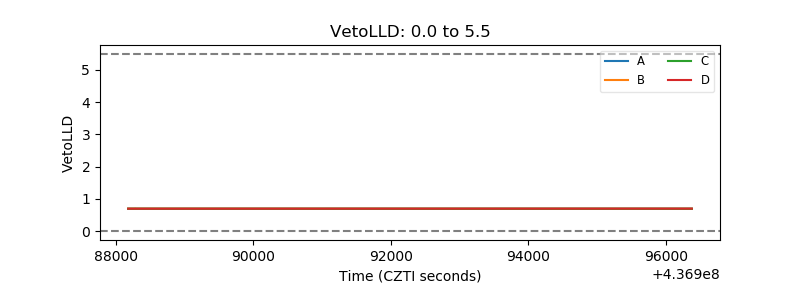 |
| Alpha Counter | 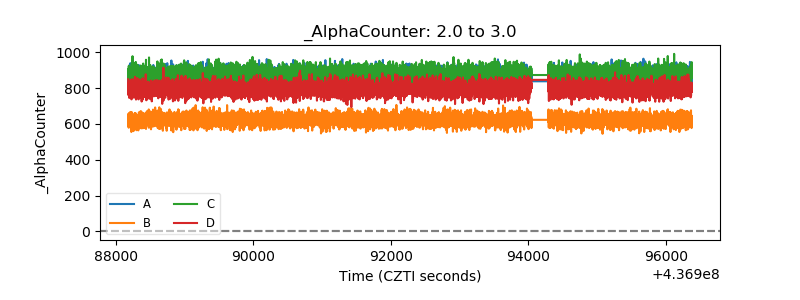 |
| _CPM_Rate | 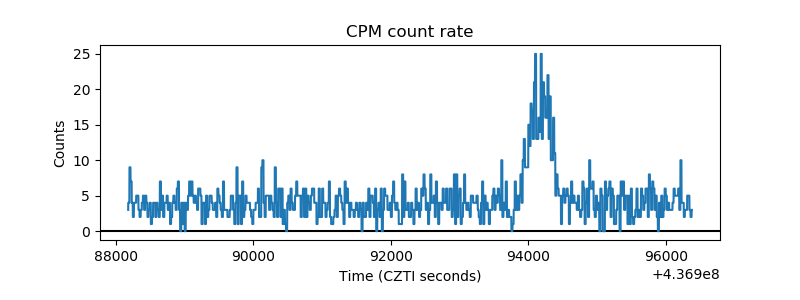 |
| CZT Counter | 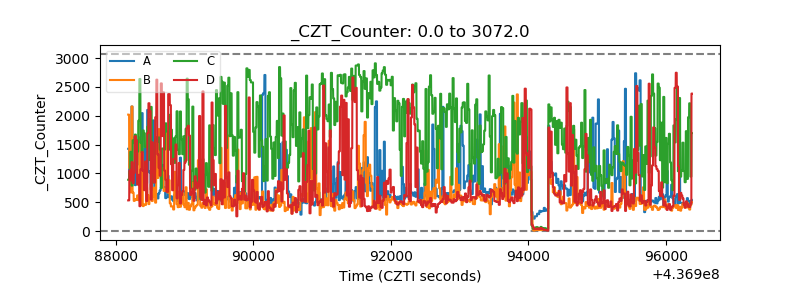 |
| +2.5 Volts monitor | 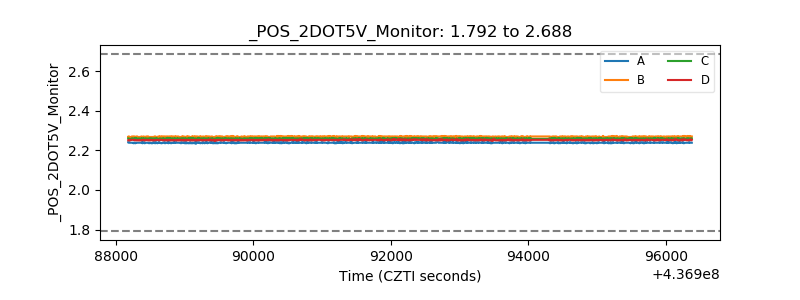 |
| +5 Volts monitor | 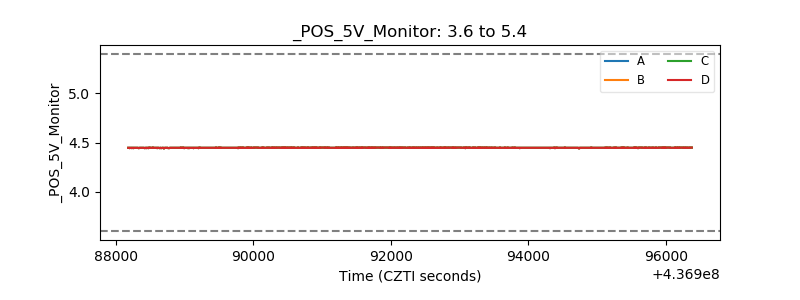 |
| _ROLL_ROT | 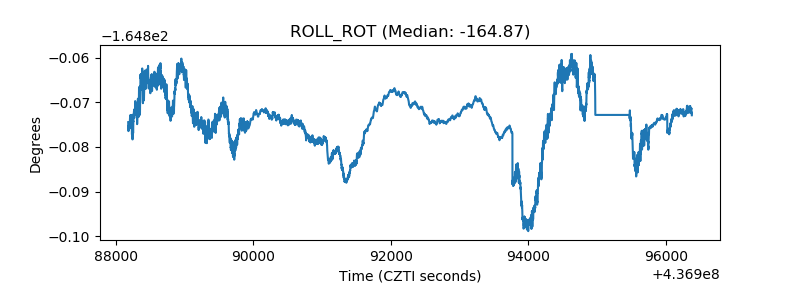 |
| _Roll_DEC | 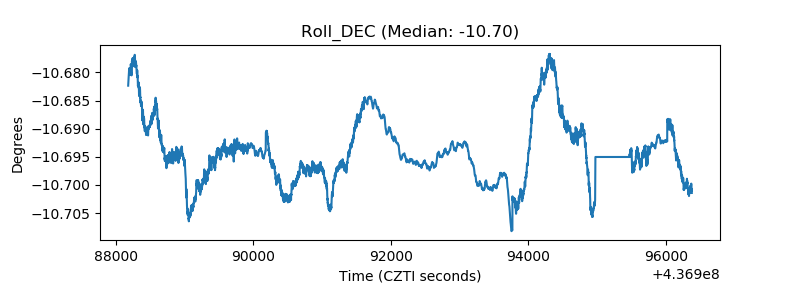 |
| _Roll_RA | 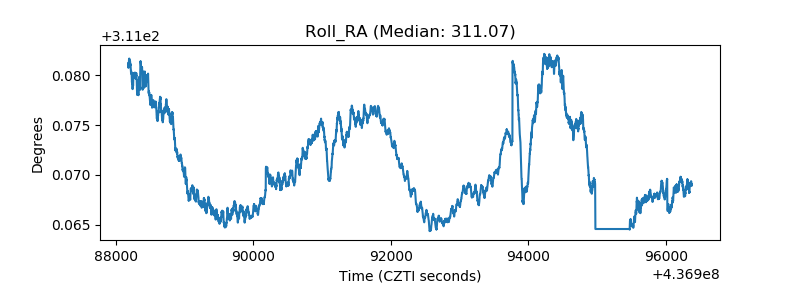 |
| Veto Counter | 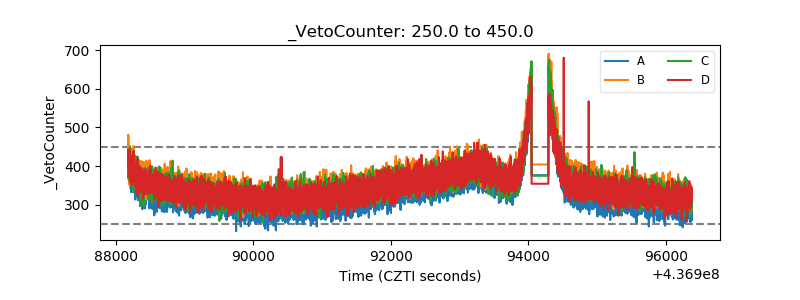 |