| Param | Original file | Final file |
|---|---|---|
| Filename | modeM0/AS1A13_018T01_9000005906_43845cztM0_level2.fits | modeM0/AS1A13_018T01_9000005906_43845cztM0_level2_quad_clean.evt |
| Size (bytes) | 1,192,461,120 | 174,055,680 |
| Size | 1.1 GB | 166.0 MB |
| Events in quadrant A | 8,637,018 | 1,197,050 |
| Events in quadrant B | 6,184,923 | 1,275,143 |
| Events in quadrant C | 18,245,309 | 965,846 |
| Events in quadrant D | 10,167,913 | 1,019,281 |
| Mode M0 | |||
|---|---|---|---|
| Quadrant | BADHDUFLAG | Total packets | Discarded packets |
| A | 0 | 33408 | 7 |
| B | 0 | 26268 | 5 |
| C | 0 | 62415 | 2 |
| D | 0 | 38357 | 7 |
| Mode SS | |||
|---|---|---|---|
| Quadrant | BADHDUFLAG | Total packets | Discarded packets |
| A | 0 | 236 | 0 |
| B | 0 | 236 | 0 |
| C | 0 | 236 | 0 |
| D | 0 | 236 | 0 |
| Mode M9 | |||
|---|---|---|---|
| Quadrant | BADHDUFLAG | Total packets | Discarded packets |
| A | 0 | 14 | 0 |
| B | 0 | 14 | 0 |
| C | 0 | 14 | 0 |
| D | 0 | 14 | 0 |
| Quadrant | Total seconds | Saturated seconds | Saturation percentage |
|---|---|---|---|
| A | 11744 | 583 | 4.964237% |
| B | 11744 | 159 | 1.353883% |
| C | 11746 | 3056 | 26.017368% |
| D | 11745 | 1291 | 10.991911% |
Noise dominated data is calculated using 1-second bins in cleaned event files. If a bin has >2000 counts, and if more than 50% of those come from <1% of pixels, then it is considered to be noise-dominated and hence unusable.
| Quadrant | # 1 sec bins | Bins with >0 counts | Bins with >2000 counts | High rate bins dominated by noise | Noise dominated (total time) | Noise dominated (detector-on time) | Marked lightcurve |
|---|---|---|---|---|---|---|---|
| A | 13066 | 11746 | 445 | 445 | 3.41% | 3.79% | 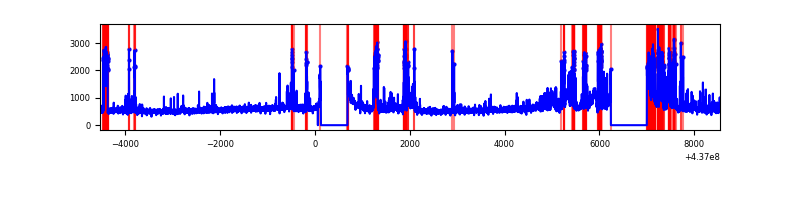 |
| B | 13066 | 11746 | 79 | 79 | 0.60% | 0.67% | 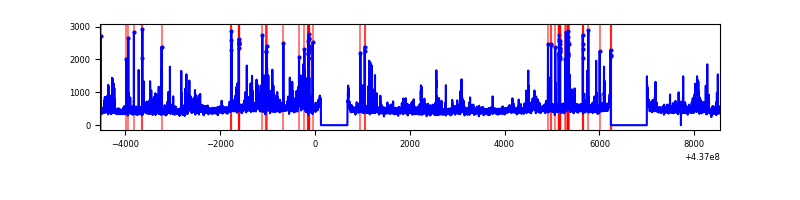 |
| C | 13066 | 11746 | 2746 | 2746 | 21.02% | 23.38% | 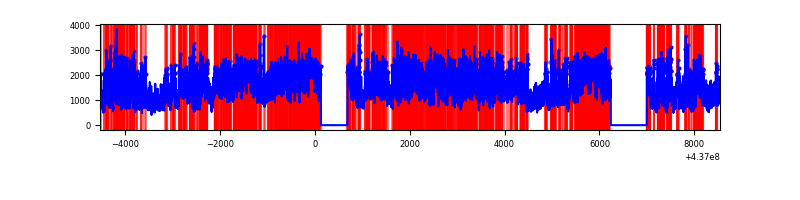 |
| D | 13066 | 11747 | 1230 | 1230 | 9.41% | 10.47% | 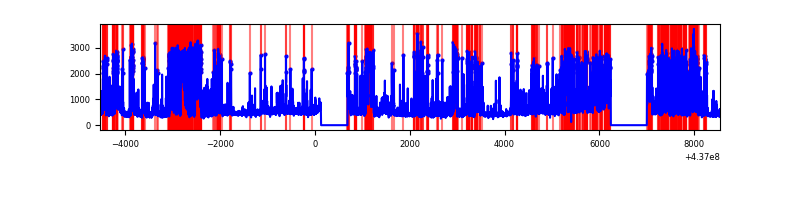 |
Top three noisy pixels from each quadrant. If the there are fewer than three noisy pixels in the level2.evt file, extra rows are filled as -1
| Pixel properties | Quadrant properties | ||||||
|---|---|---|---|---|---|---|---|
| Quadrant | DetID | PixID | Counts | Sigma | Mean | Median | Sigma |
| A | 15 | 223 | 1897797 | 7181.28 | 1278 | 1253 | 264.1 |
| A | 10 | 83 | 1613756 | 6105.76 | 1278 | 1253 | 264.1 |
| A | 8 | 4 | 49907 | 184.23 | 1278 | 1253 | 264.1 |
| B | 5 | 235 | 252284 | 973.63 | 1294 | 1253 | 257.8 |
| B | 4 | 170 | 214992 | 828.99 | 1294 | 1253 | 257.8 |
| B | 0 | 200 | 170051 | 654.69 | 1294 | 1253 | 257.8 |
| C | 3 | 233 | 11429511 | 41176.64 | 1179 | 1186 | 277.5 |
| C | 0 | 239 | 1275453 | 4591.23 | 1179 | 1186 | 277.5 |
| C | 15 | 158 | 407840 | 1465.19 | 1179 | 1186 | 277.5 |
| D | 5 | 235 | 2738516 | 8768.05 | 1222 | 1183 | 312.2 |
| D | 12 | 2 | 494541 | 1580.29 | 1222 | 1183 | 312.2 |
| D | 4 | 221 | 418237 | 1335.88 | 1222 | 1183 | 312.2 |
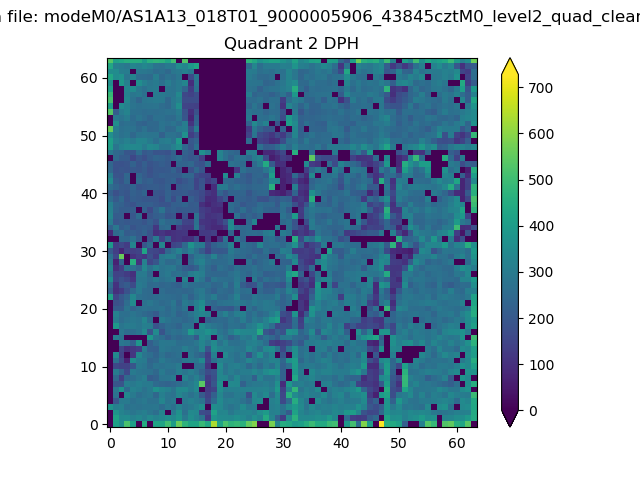
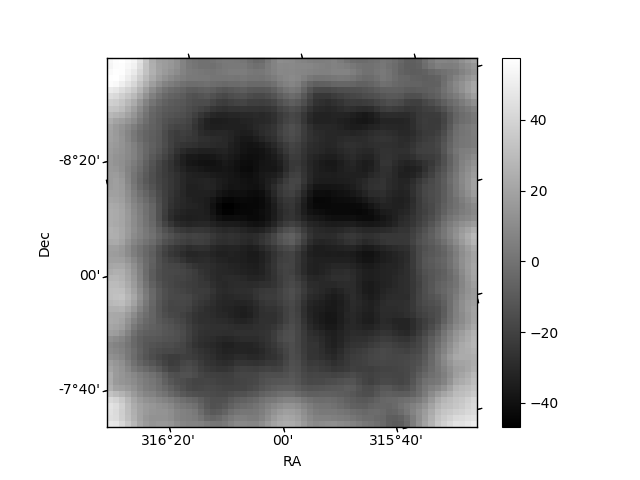
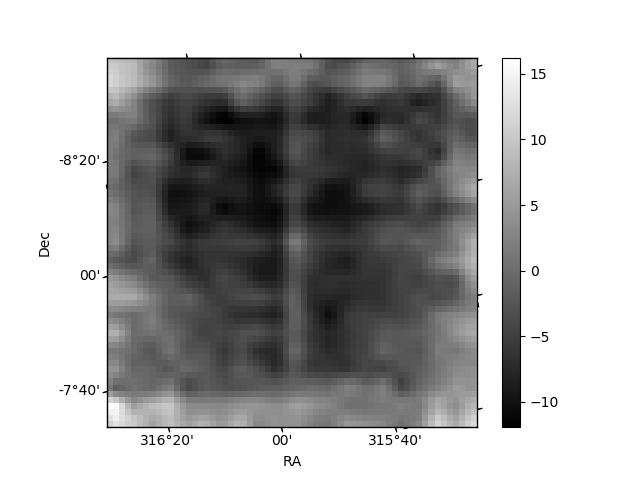
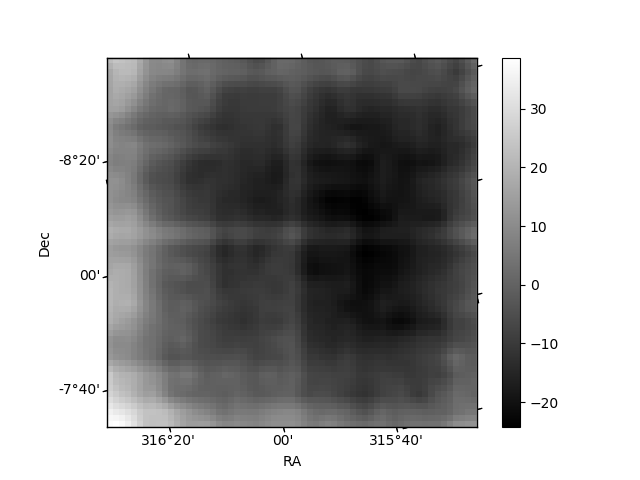
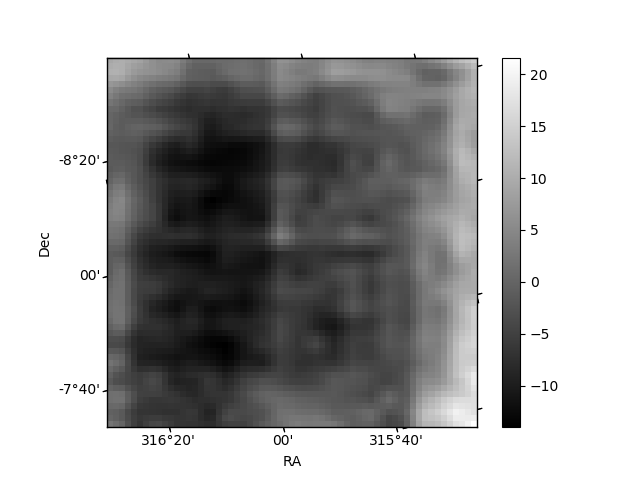
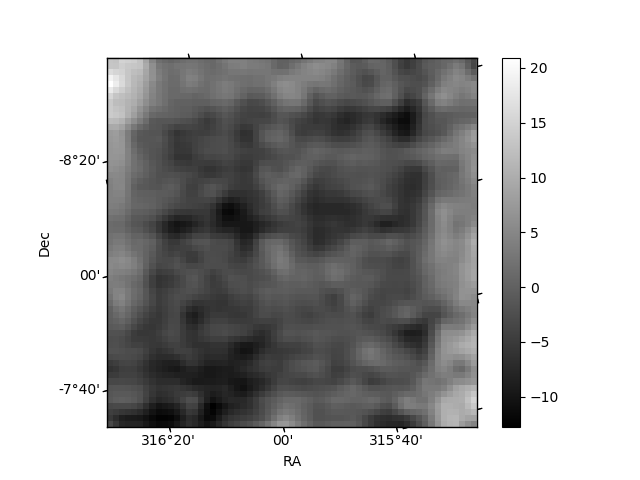
Histogram calculated using DETX and DETY for each event in the final _common_clean file
| Quadrant A | 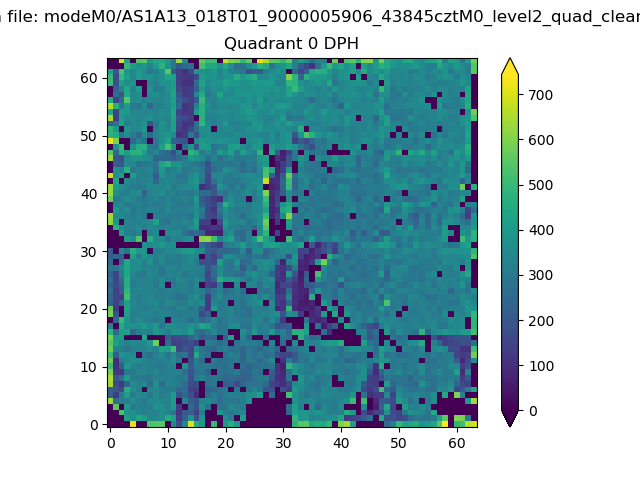 |
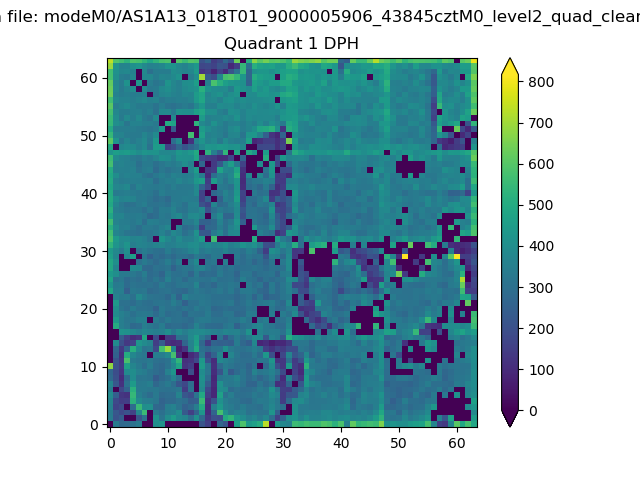 |
Quadrant B |
|---|---|---|---|
| Quadrant D | 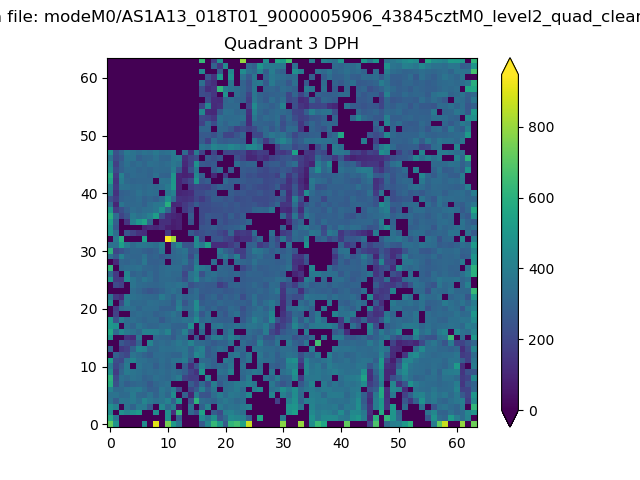 |
 |
Quadrant C |
| Plot type | Count rate plots | Images |
|---|---|---|
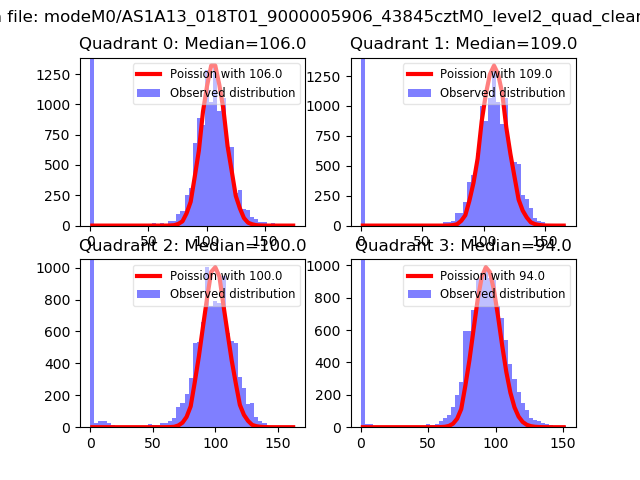
| Comparison with Poisson distribution Blue bars denote a histogram of data divided into 1 sec bins. Red curve is a Poisson curve with rate = median count rate of data. |
 |
 |
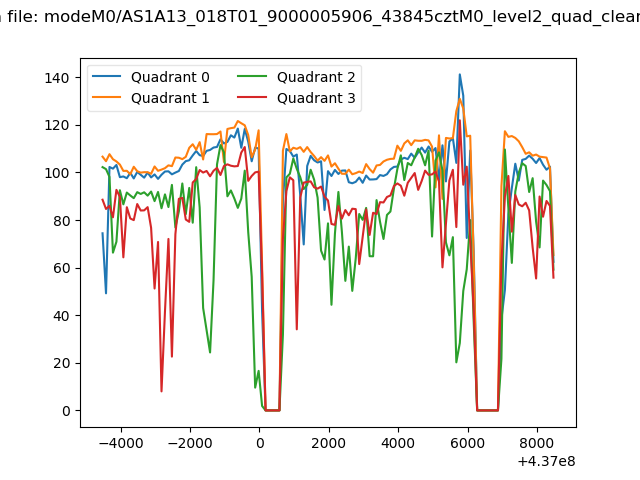
| Quadrant-wise count rates Data is divided into 100 sec bins |
 |
|
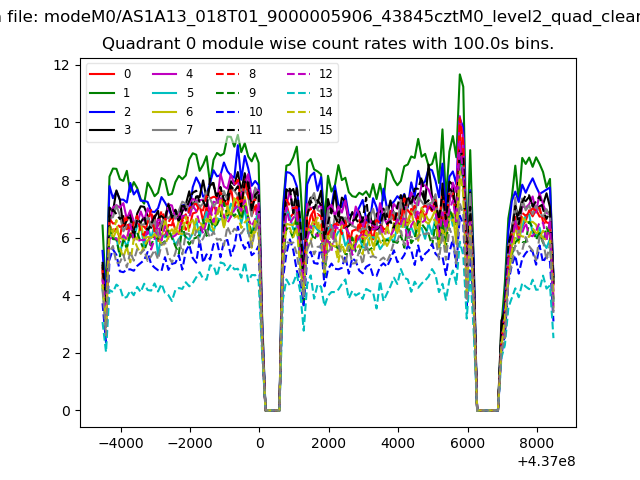
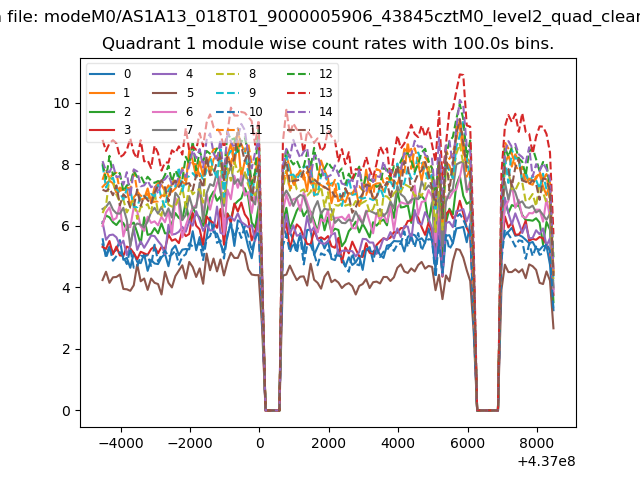
| Module-wise count rates for Quadrant A Data is divided into 100 sec bins |
 |
 |
| Module-wise count rates for Quadrant B Data is divided into 100 sec bins |
 |
 |
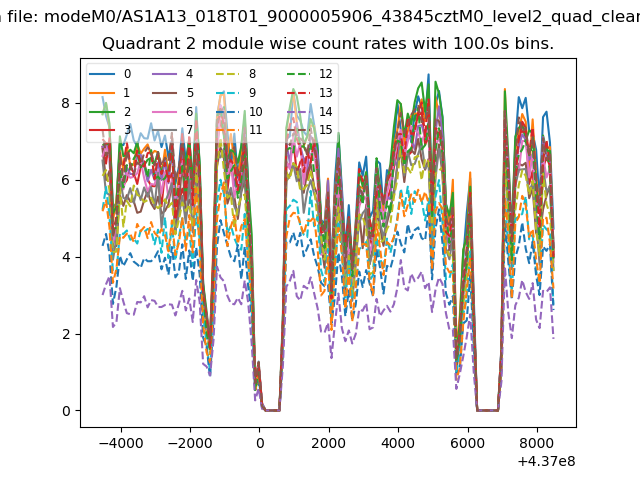
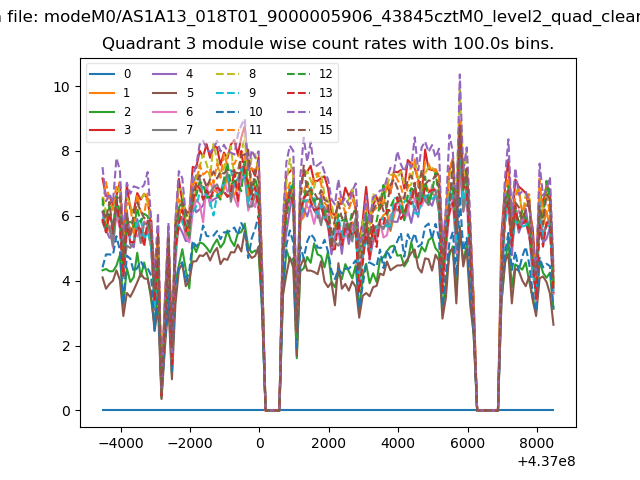
| Module-wise count rates for Quadrant C Data is divided into 100 sec bins |
 |
 |
| Module-wise count rates for Quadrant D Data is divided into 100 sec bins |
 |
 |
| Parameter | Plot |
|---|---|
| CZT HV Monitor | 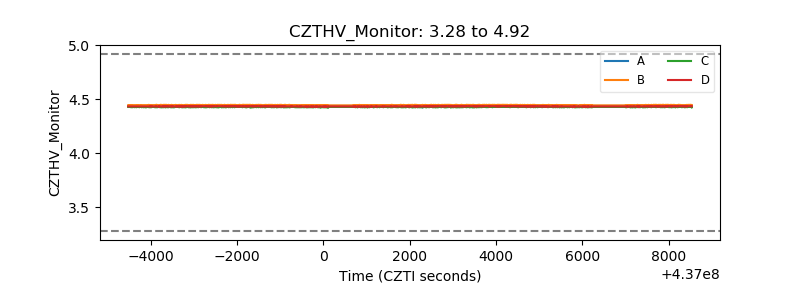 |
| D_VDD | 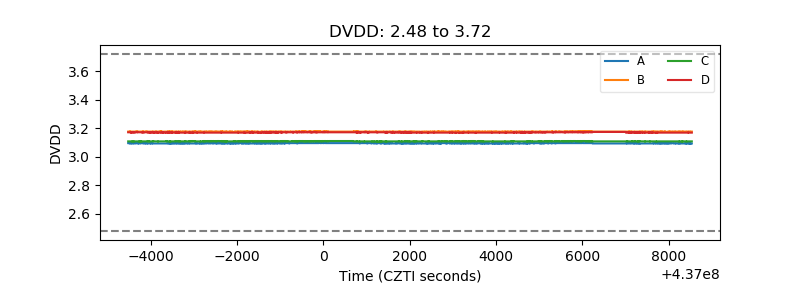 |
| Temperature 1 | 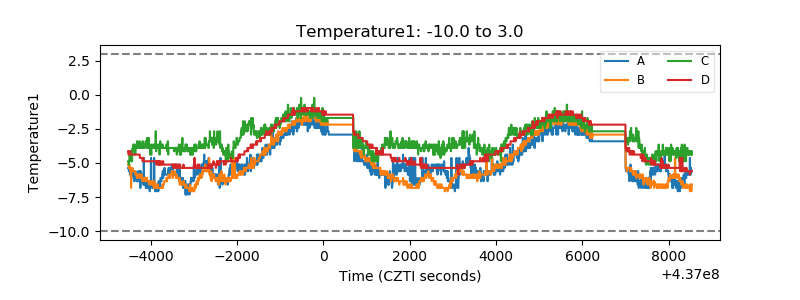 |
| Veto HV Monitor | 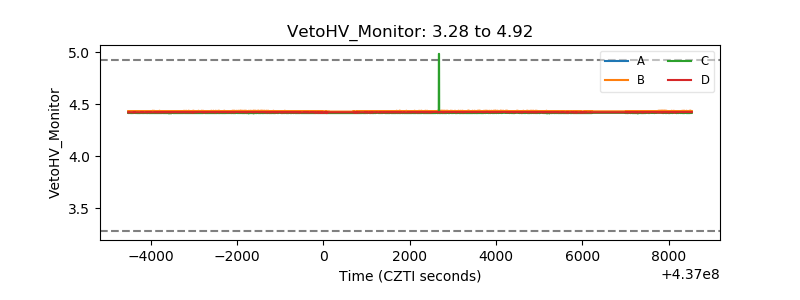 |
| Veto LLD | 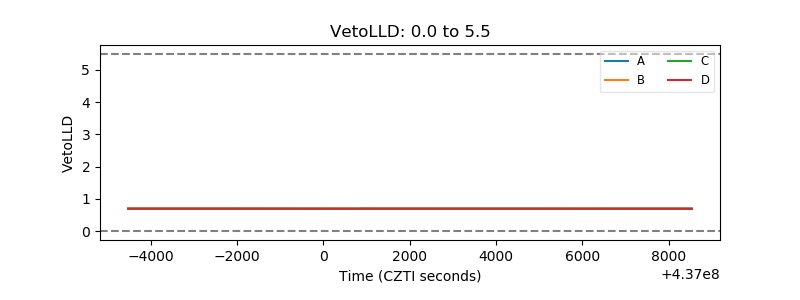 |
| Alpha Counter | 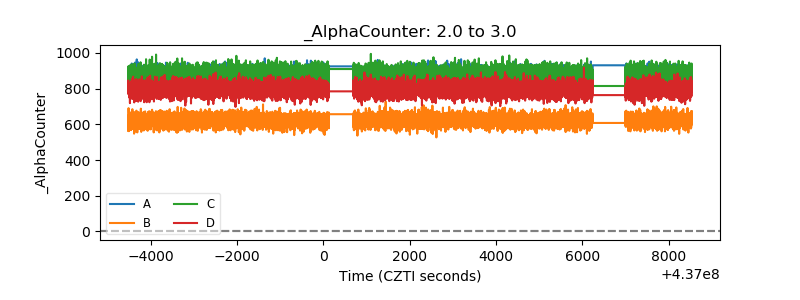 |
| _CPM_Rate | 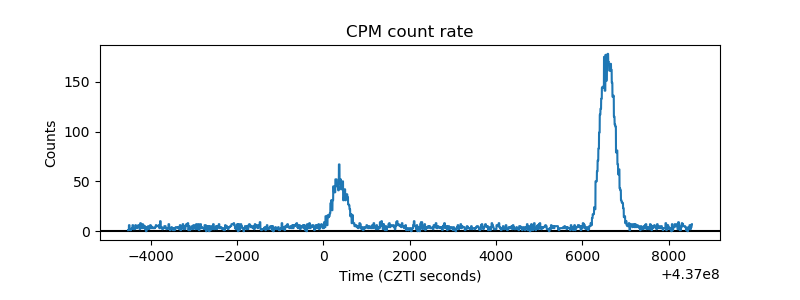 |
| CZT Counter | 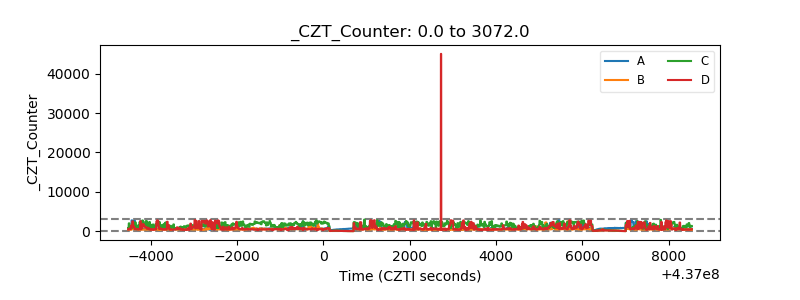 |
| +2.5 Volts monitor | 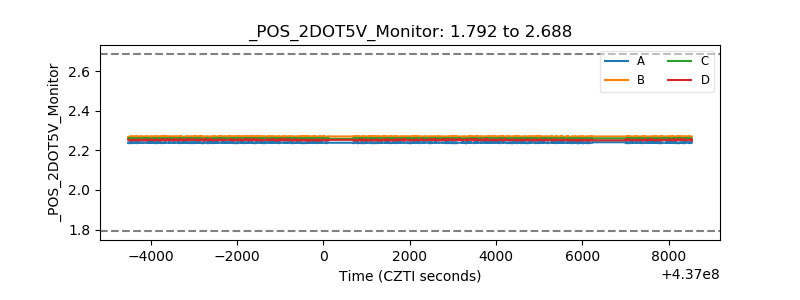 |
| +5 Volts monitor | 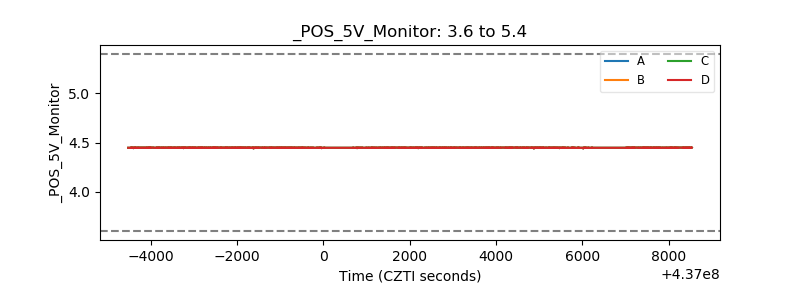 |
| _ROLL_ROT | 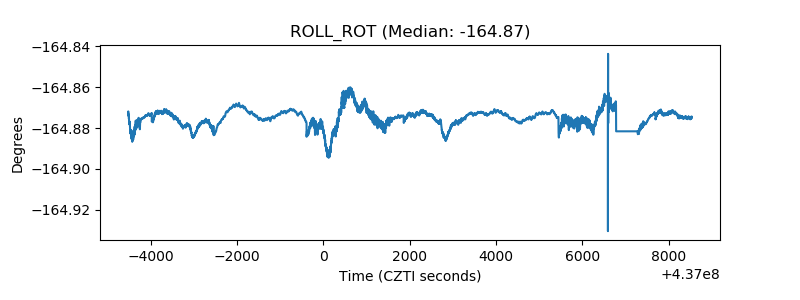 |
| _Roll_DEC | 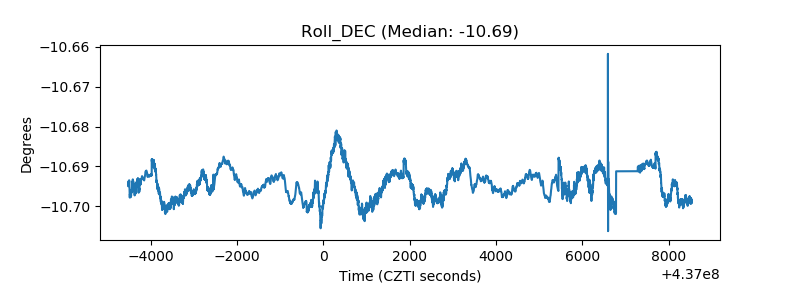 |
| _Roll_RA | 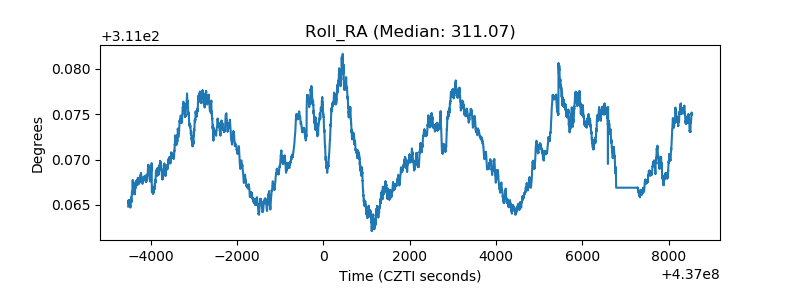 |
| Veto Counter | 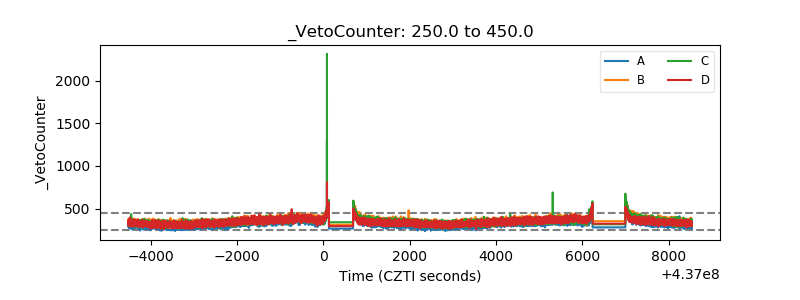 |