| Param | Original file | Final file |
|---|---|---|
| Filename | modeM0/AS1A13_087T01_9000005908_43848cztM0_level2.fits | modeM0/AS1A13_087T01_9000005908_43848cztM0_level2_quad_clean.evt |
| Size (bytes) | 376,695,360 | 74,784,960 |
| Size | 359.2 MB | 71.3 MB |
| Events in quadrant A | 3,056,703 | 504,813 |
| Events in quadrant B | 2,508,132 | 527,062 |
| Events in quadrant C | 5,535,603 | 454,620 |
| Events in quadrant D | 2,494,896 | 462,884 |
| Mode M9 | |||
|---|---|---|---|
| Quadrant | BADHDUFLAG | Total packets | Discarded packets |
| A | 0 | 11 | 0 |
| B | 0 | 11 | 0 |
| C | 0 | 11 | 0 |
| D | 0 | 11 | 0 |
| Mode M0 | |||
|---|---|---|---|
| Quadrant | BADHDUFLAG | Total packets | Discarded packets |
| A | 0 | 12082 | 2 |
| B | 0 | 10323 | 1 |
| C | 0 | 19612 | 2 |
| D | 0 | 10525 | 4 |
| Mode SS | |||
|---|---|---|---|
| Quadrant | BADHDUFLAG | Total packets | Discarded packets |
| A | 0 | 90 | 0 |
| B | 0 | 90 | 0 |
| C | 0 | 90 | 0 |
| D | 0 | 90 | 0 |
| Quadrant | Total seconds | Saturated seconds | Saturation percentage |
|---|---|---|---|
| A | 4487 | 128 | 2.852686% |
| B | 4488 | 81 | 1.804813% |
| C | 4486 | 611 | 13.620152% |
| D | 4486 | 100 | 2.229157% |
Noise dominated data is calculated using 1-second bins in cleaned event files. If a bin has >2000 counts, and if more than 50% of those come from <1% of pixels, then it is considered to be noise-dominated and hence unusable.
| Quadrant | # 1 sec bins | Bins with >0 counts | Bins with >2000 counts | High rate bins dominated by noise | Noise dominated (total time) | Noise dominated (detector-on time) | Marked lightcurve |
|---|---|---|---|---|---|---|---|
| A | 5562 | 4488 | 63 | 63 | 1.13% | 1.40% | 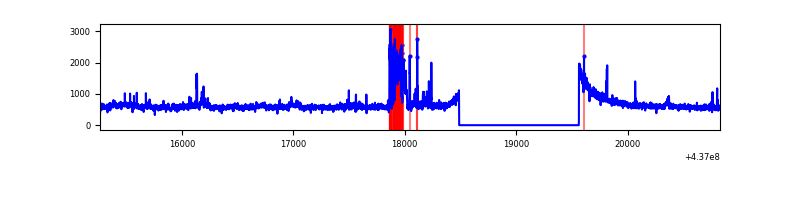 |
| B | 5563 | 4489 | 37 | 37 | 0.67% | 0.82% | 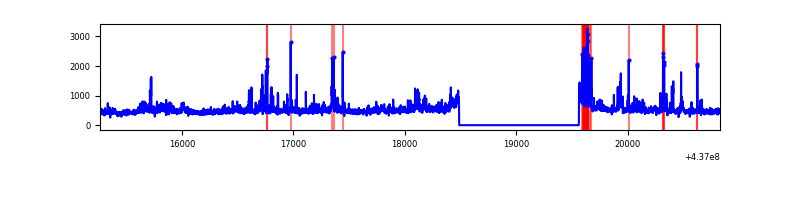 |
| C | 5562 | 4487 | 489 | 489 | 8.79% | 10.90% | 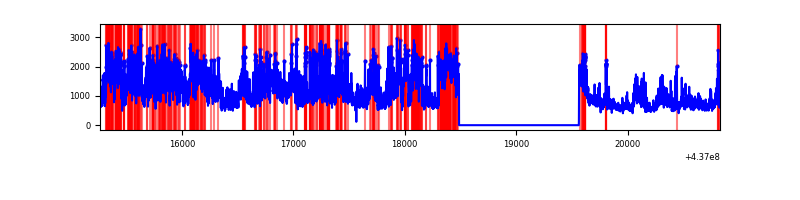 |
| D | 5562 | 4488 | 78 | 78 | 1.40% | 1.74% | 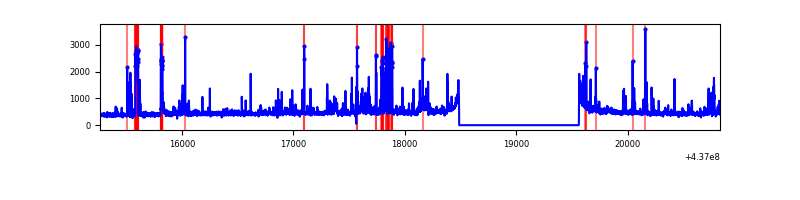 |
Top three noisy pixels from each quadrant. If the there are fewer than three noisy pixels in the level2.evt file, extra rows are filled as -1
| Pixel properties | Quadrant properties | ||||||
|---|---|---|---|---|---|---|---|
| Quadrant | DetID | PixID | Counts | Sigma | Mean | Median | Sigma |
| A | 10 | 83 | 647767 | 6054.41 | 514 | 505 | 106.9 |
| A | 15 | 223 | 350513 | 3273.93 | 514 | 505 | 106.9 |
| A | 2 | 79 | 30325 | 278.93 | 514 | 505 | 106.9 |
| B | 5 | 235 | 154320 | 1501.38 | 514 | 498 | 102.5 |
| B | 4 | 170 | 86938 | 843.7 | 514 | 498 | 102.5 |
| B | 0 | 199 | 69777 | 676.2 | 514 | 498 | 102.5 |
| C | 3 | 233 | 2644510 | 22607.9 | 491 | 495 | 117.0 |
| C | 15 | 174 | 527478 | 4506.02 | 491 | 495 | 117.0 |
| C | 0 | 239 | 331170 | 2827.47 | 491 | 495 | 117.0 |
| D | 5 | 235 | 213488 | 1677.97 | 506 | 491 | 126.9 |
| D | 13 | 171 | 109144 | 855.96 | 506 | 491 | 126.9 |
| D | 4 | 221 | 40557 | 315.64 | 506 | 491 | 126.9 |
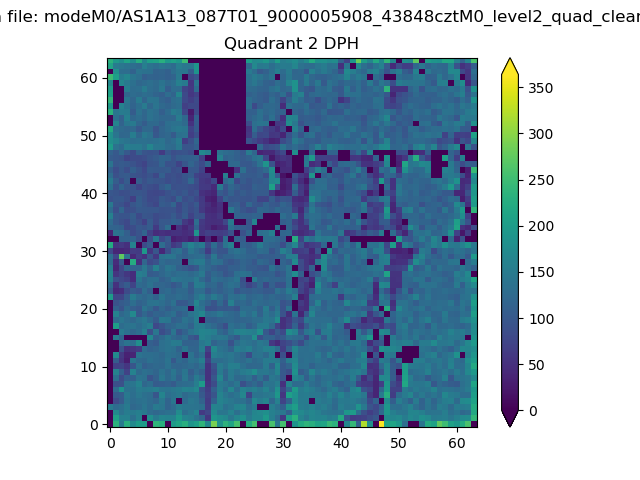
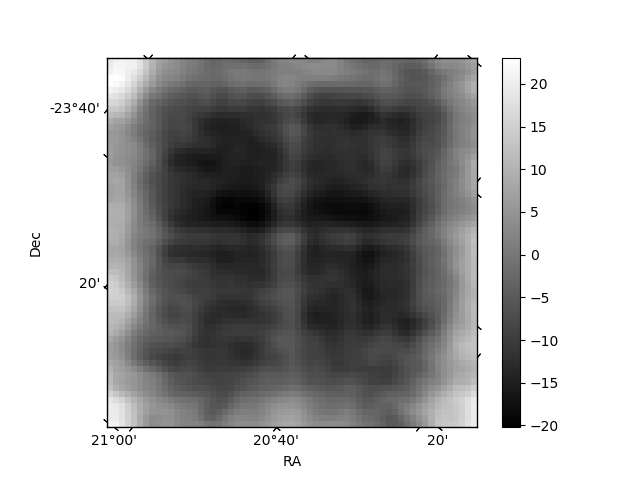
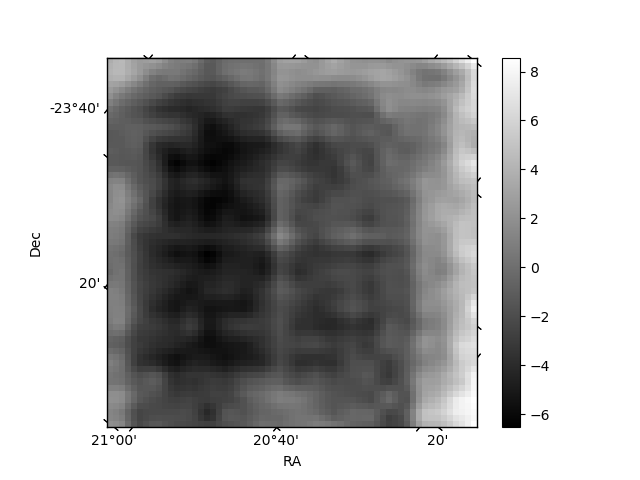
Histogram calculated using DETX and DETY for each event in the final _common_clean file
| Quadrant A | 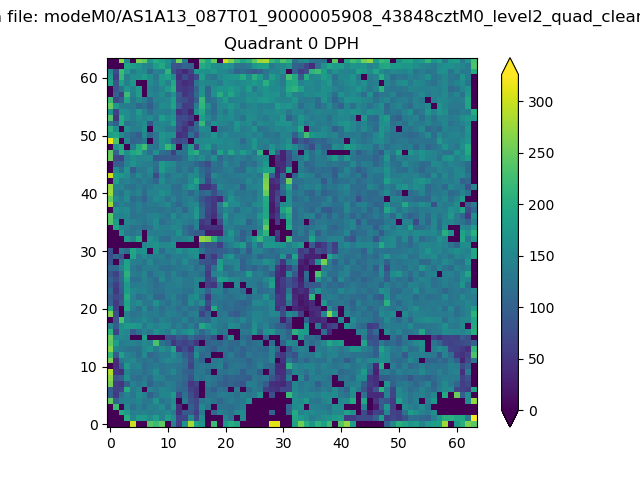 |
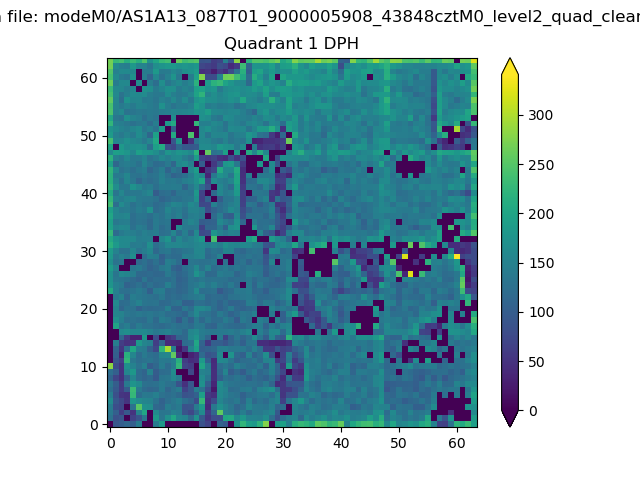 |
Quadrant B |
|---|---|---|---|
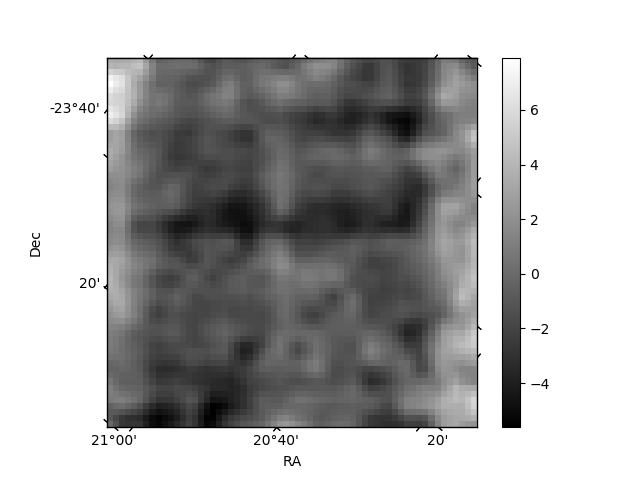
| Quadrant D | 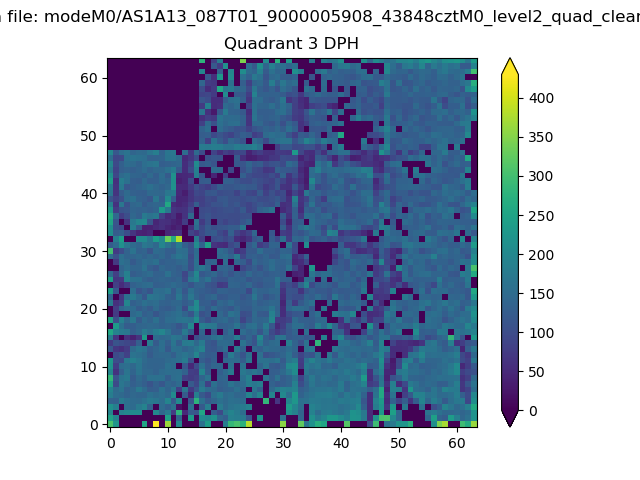 |
 |
Quadrant C |
| Plot type | Count rate plots | Images |
|---|---|---|
| Comparison with Poisson distribution Blue bars denote a histogram of data divided into 1 sec bins. Red curve is a Poisson curve with rate = median count rate of data. |
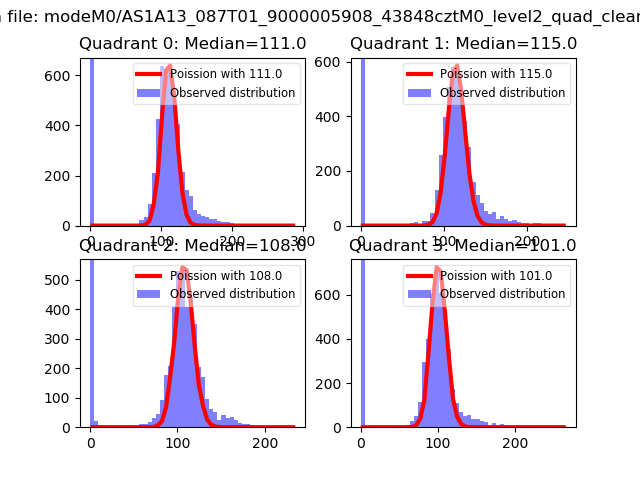 |
 |
| Quadrant-wise count rates Data is divided into 100 sec bins |
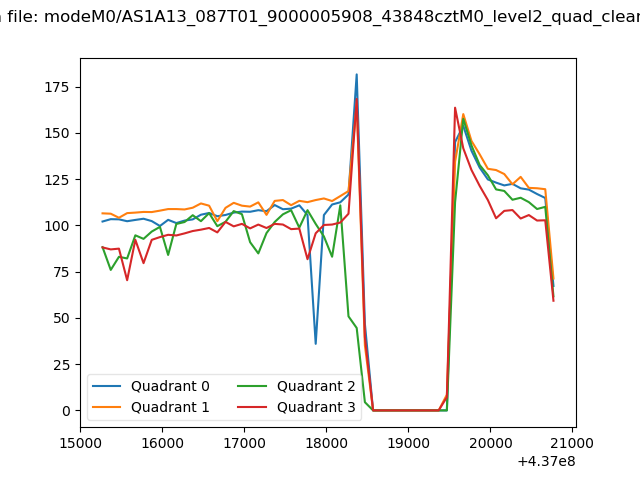 |
|
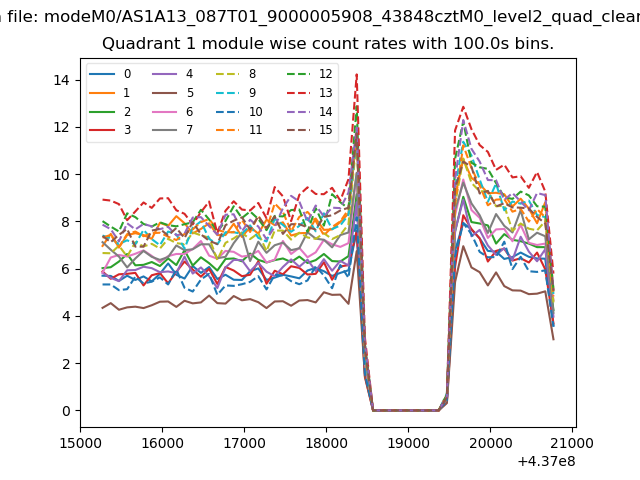
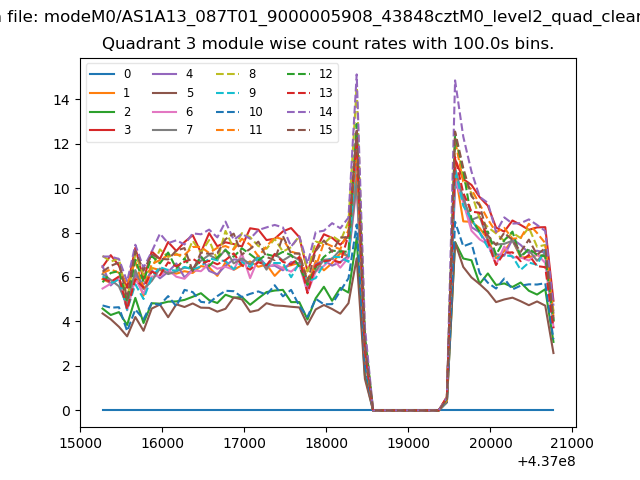
| Module-wise count rates for Quadrant A Data is divided into 100 sec bins |
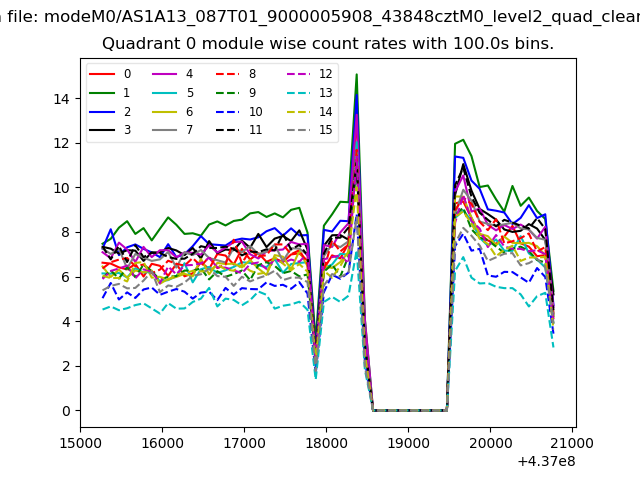 |
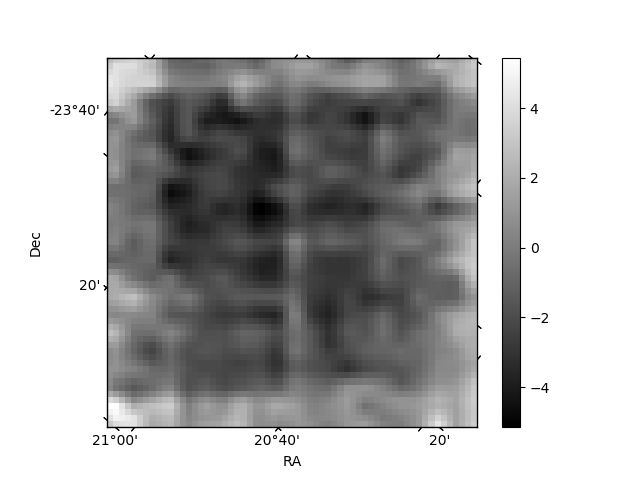 |
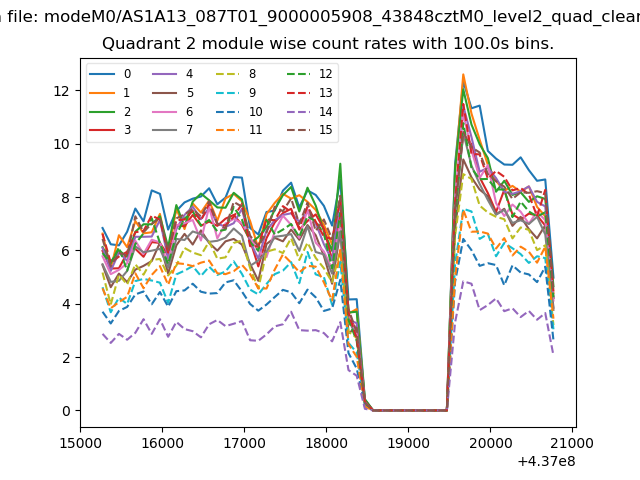
| Module-wise count rates for Quadrant B Data is divided into 100 sec bins |
 |
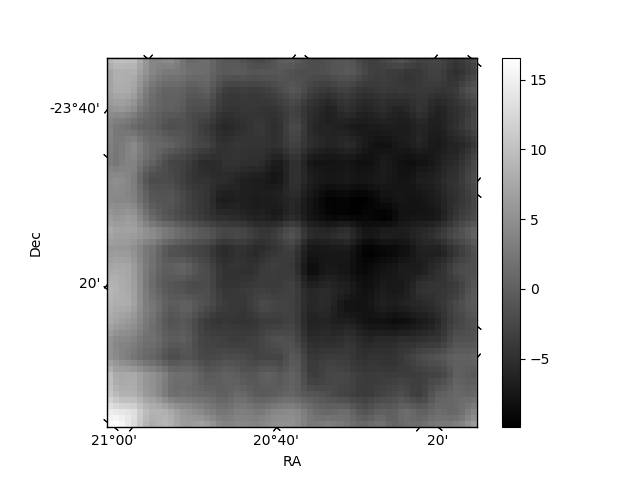 |
| Module-wise count rates for Quadrant C Data is divided into 100 sec bins |
 |
 |
| Module-wise count rates for Quadrant D Data is divided into 100 sec bins |
 |
 |
| Parameter | Plot |
|---|---|
| CZT HV Monitor | 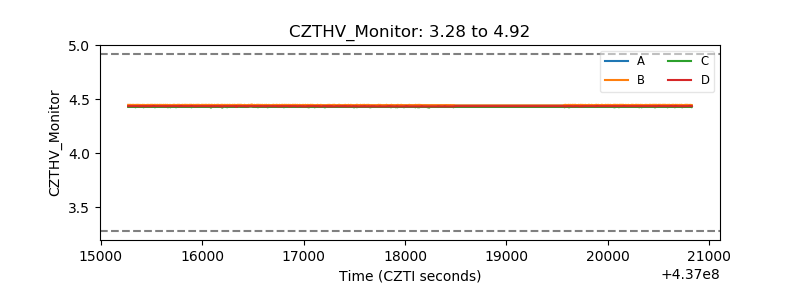 |
| D_VDD | 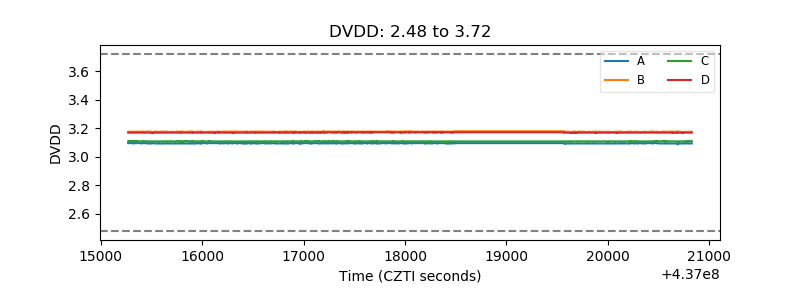 |
| Temperature 1 | 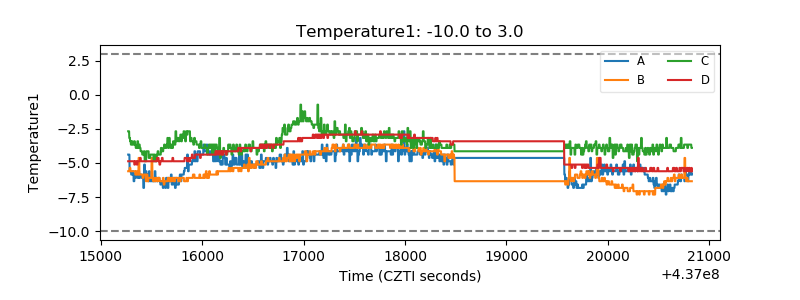 |
| Veto HV Monitor | 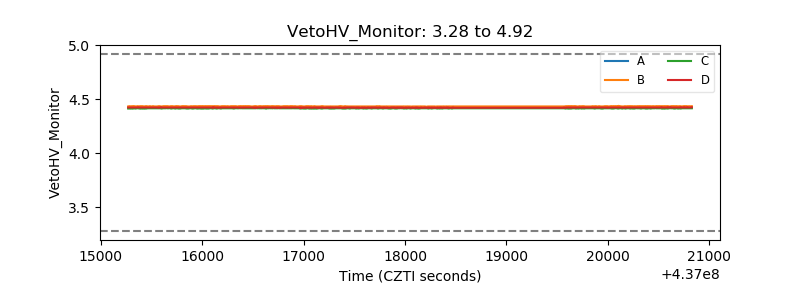 |
| Veto LLD | 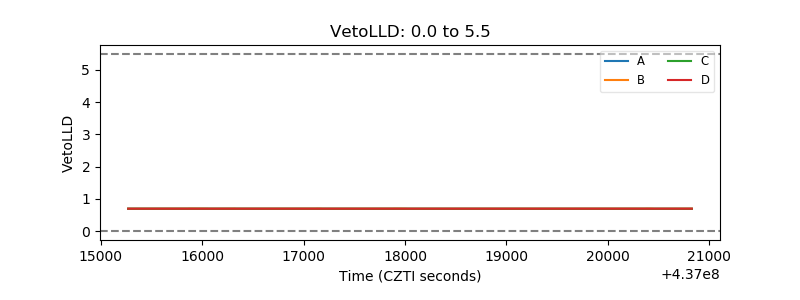 |
| Alpha Counter | 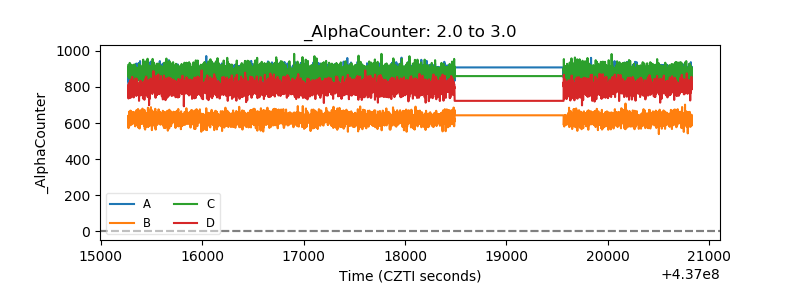 |
| _CPM_Rate | 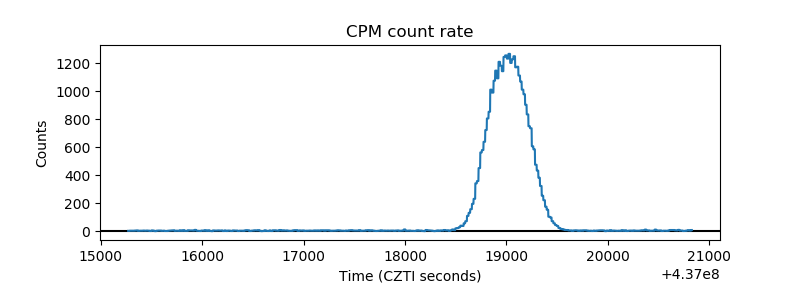 |
| CZT Counter | 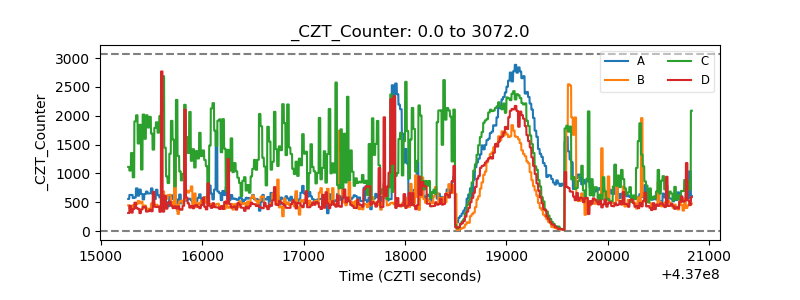 |
| +2.5 Volts monitor | 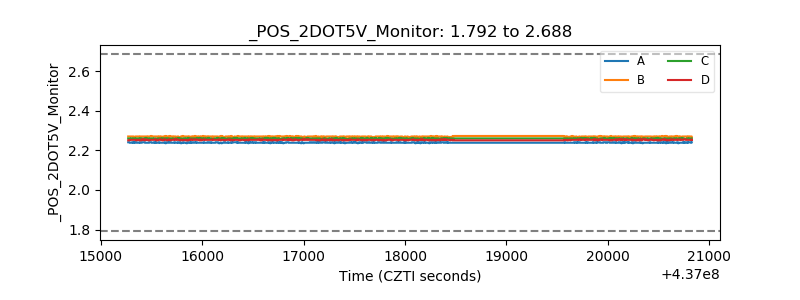 |
| +5 Volts monitor | 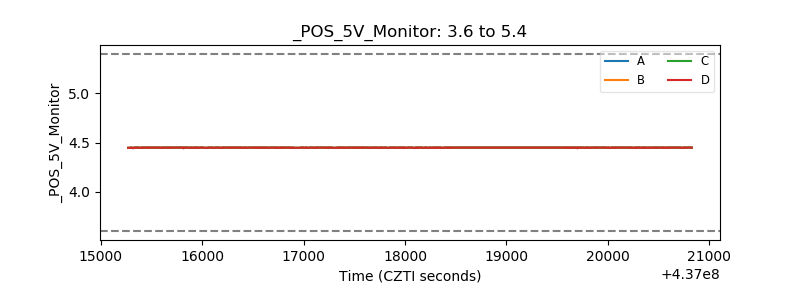 |
| _ROLL_ROT | 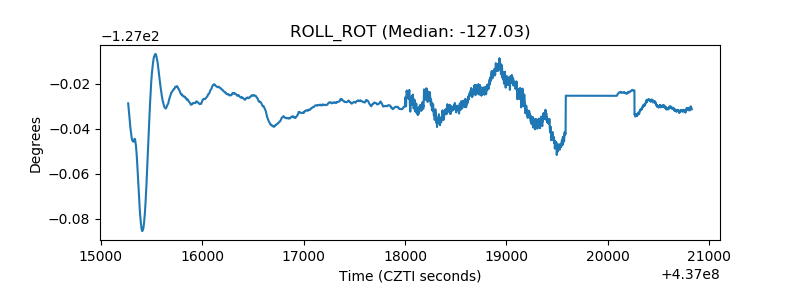 |
| _Roll_DEC | 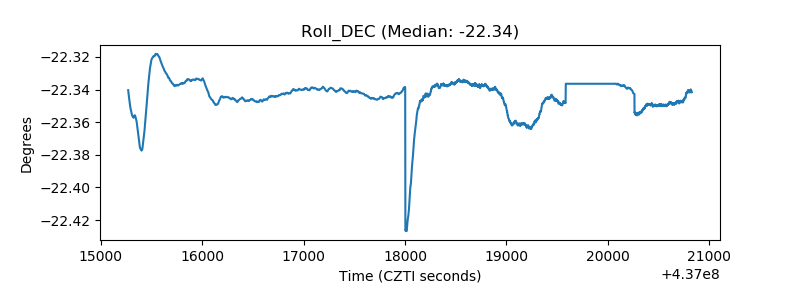 |
| _Roll_RA |  |
| Veto Counter | 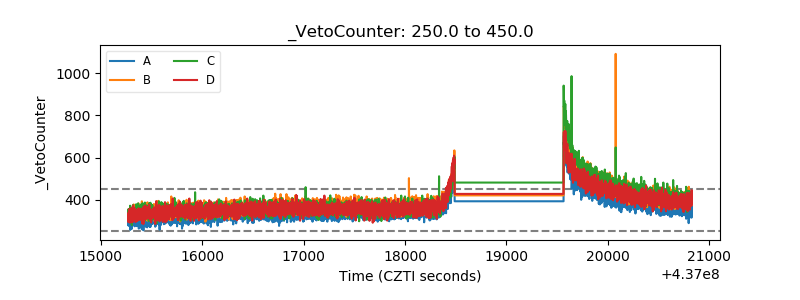 |