| Param | Original file | Final file |
|---|---|---|
| Filename | modeM0/AS1A13_087T01_9000005908_43849cztM0_level2.fits | modeM0/AS1A13_087T01_9000005908_43849cztM0_level2_quad_clean.evt |
| Size (bytes) | 592,724,160 | 113,313,600 |
| Size | 565.3 MB | 108.1 MB |
| Events in quadrant A | 5,845,320 | 745,839 |
| Events in quadrant B | 4,001,594 | 819,941 |
| Events in quadrant C | 6,468,031 | 736,344 |
| Events in quadrant D | 5,107,979 | 663,210 |
| Mode M9 | |||
|---|---|---|---|
| Quadrant | BADHDUFLAG | Total packets | Discarded packets |
| A | 0 | 23 | 0 |
| B | 0 | 23 | 0 |
| C | 0 | 23 | 0 |
| D | 0 | 23 | 0 |
| Mode M0 | |||
|---|---|---|---|
| Quadrant | BADHDUFLAG | Total packets | Discarded packets |
| A | 0 | 21911 | 2 |
| B | 0 | 16152 | 2 |
| C | 0 | 24077 | 2 |
| D | 0 | 19676 | 3 |
| Mode SS | |||
|---|---|---|---|
| Quadrant | BADHDUFLAG | Total packets | Discarded packets |
| A | 0 | 136 | 0 |
| B | 0 | 136 | 0 |
| C | 0 | 136 | 0 |
| D | 0 | 136 | 0 |
| Quadrant | Total seconds | Saturated seconds | Saturation percentage |
|---|---|---|---|
| A | 6686 | 604 | 9.033802% |
| B | 6687 | 144 | 2.153432% |
| C | 6687 | 465 | 6.953791% |
| D | 6686 | 636 | 9.512414% |
Noise dominated data is calculated using 1-second bins in cleaned event files. If a bin has >2000 counts, and if more than 50% of those come from <1% of pixels, then it is considered to be noise-dominated and hence unusable.
| Quadrant | # 1 sec bins | Bins with >0 counts | Bins with >2000 counts | High rate bins dominated by noise | Noise dominated (total time) | Noise dominated (detector-on time) | Marked lightcurve |
|---|---|---|---|---|---|---|---|
| A | 8921 | 6688 | 448 | 448 | 5.02% | 6.70% | 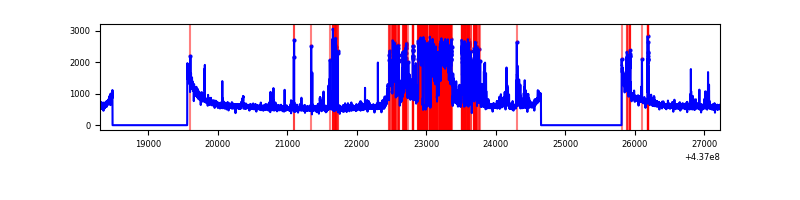 |
| B | 8922 | 6688 | 68 | 68 | 0.76% | 1.02% | 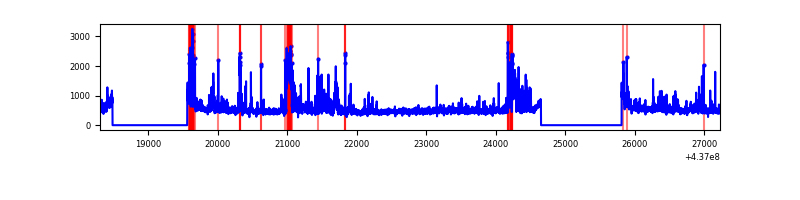 |
| C | 8922 | 6687 | 275 | 275 | 3.08% | 4.11% | 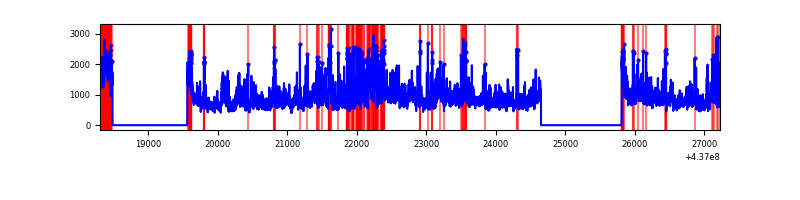 |
| D | 8921 | 6687 | 623 | 623 | 6.98% | 9.32% | 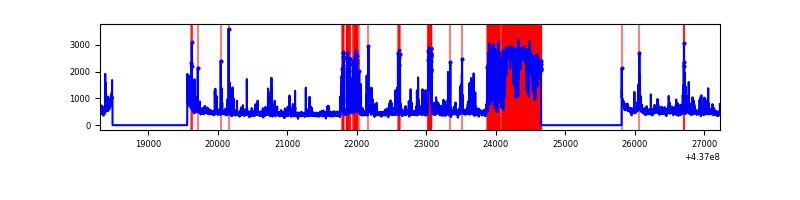 |
Top three noisy pixels from each quadrant. If the there are fewer than three noisy pixels in the level2.evt file, extra rows are filled as -1
| Pixel properties | Quadrant properties | ||||||
|---|---|---|---|---|---|---|---|
| Quadrant | DetID | PixID | Counts | Sigma | Mean | Median | Sigma |
| A | 15 | 223 | 1727780 | 10902.91 | 772 | 757 | 158.4 |
| A | 10 | 83 | 1002529 | 6324.31 | 772 | 757 | 158.4 |
| A | 13 | 210 | 66961 | 417.95 | 772 | 757 | 158.4 |
| B | 5 | 235 | 484002 | 3143.28 | 790 | 767 | 153.7 |
| B | 4 | 170 | 121327 | 784.2 | 790 | 767 | 153.7 |
| B | 0 | 199 | 104600 | 675.4 | 790 | 767 | 153.7 |
| C | 3 | 233 | 3191273 | 17467.63 | 769 | 774 | 182.7 |
| C | 15 | 158 | 69836 | 378.11 | 769 | 774 | 182.7 |
| C | 14 | 254 | 60129 | 324.96 | 769 | 774 | 182.7 |
| D | 5 | 235 | 1037111 | 5488.44 | 746 | 725 | 188.8 |
| D | 13 | 249 | 540226 | 2857.06 | 746 | 725 | 188.8 |
| D | 4 | 211 | 231400 | 1221.6 | 746 | 725 | 188.8 |
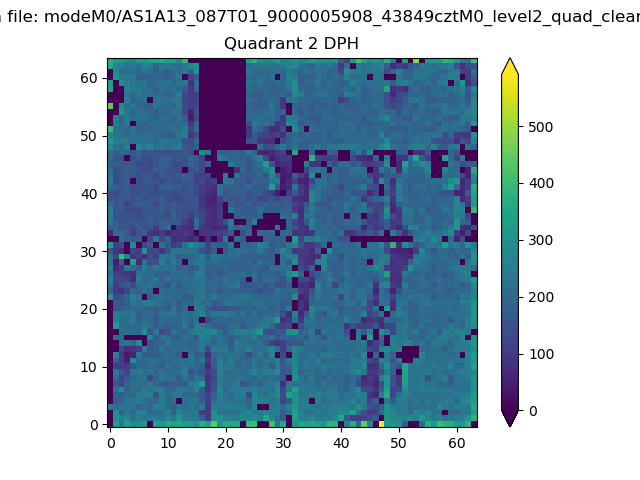
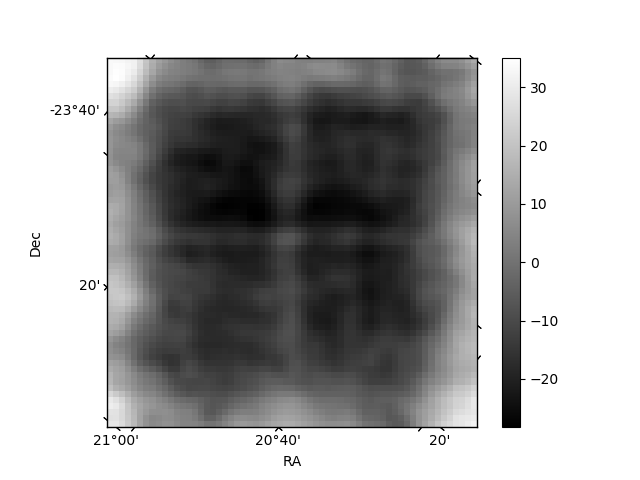
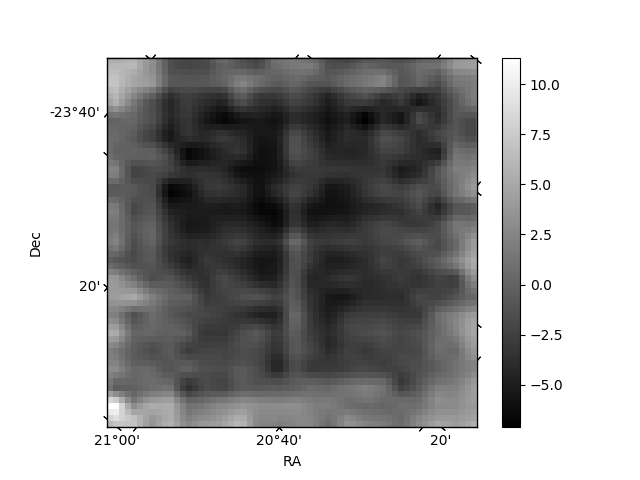
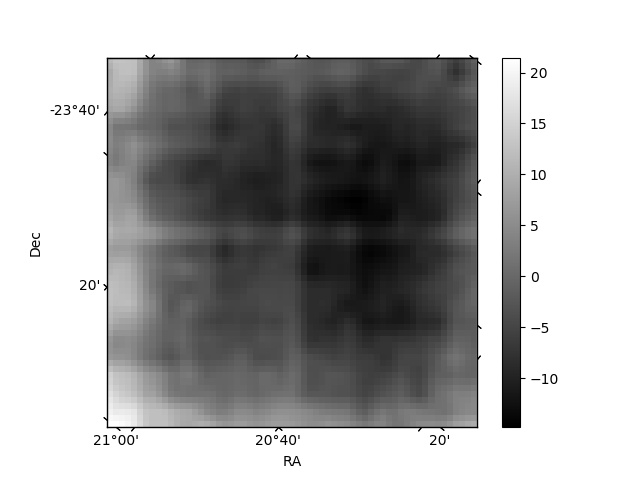
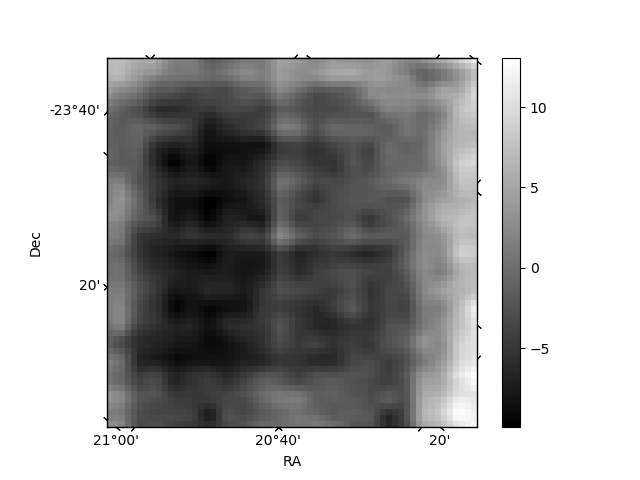
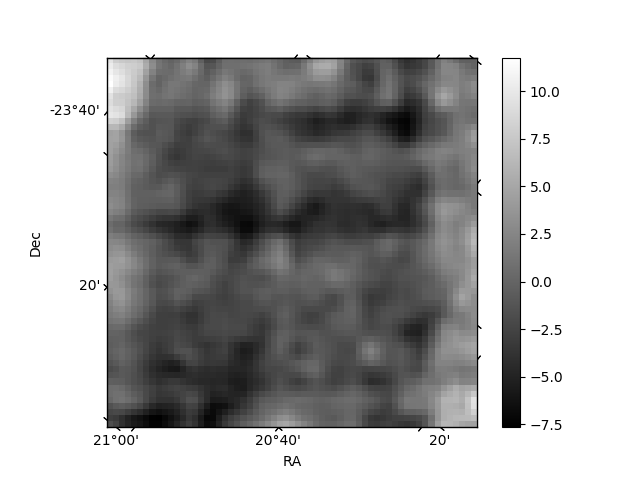
Histogram calculated using DETX and DETY for each event in the final _common_clean file
| Quadrant A | 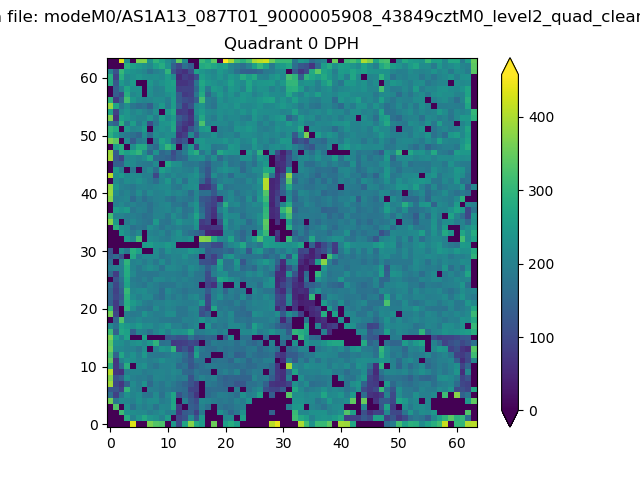 |
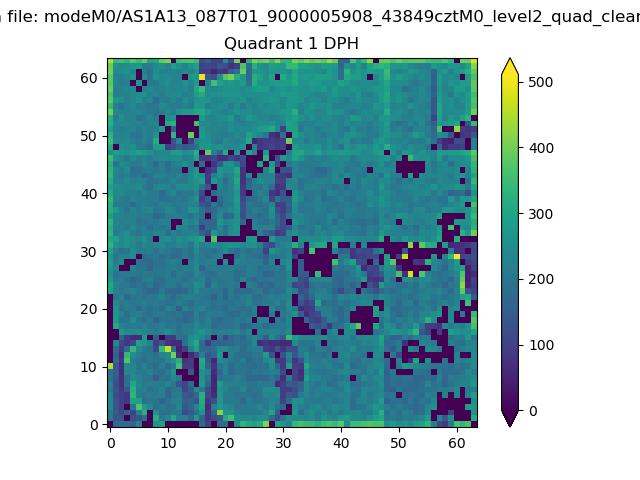 |
Quadrant B |
|---|---|---|---|
| Quadrant D | 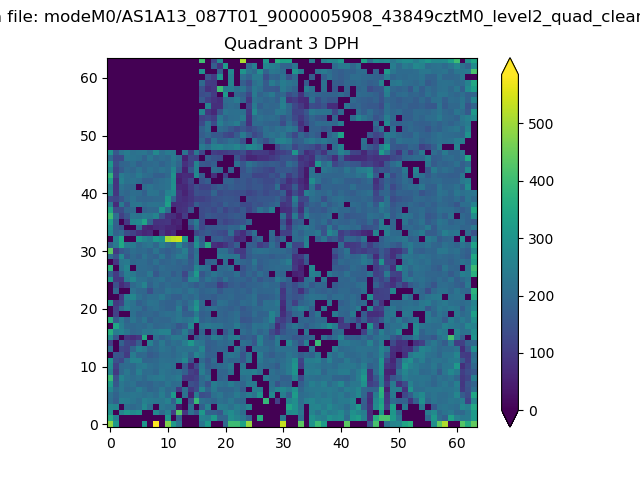 |
 |
Quadrant C |
| Plot type | Count rate plots | Images |
|---|---|---|
| Comparison with Poisson distribution Blue bars denote a histogram of data divided into 1 sec bins. Red curve is a Poisson curve with rate = median count rate of data. |
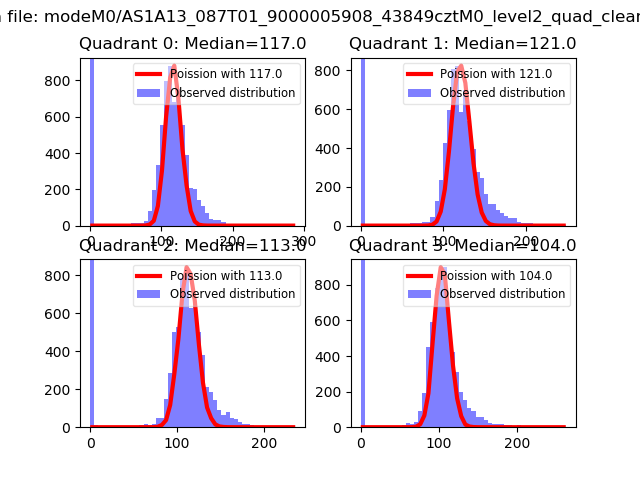 |
 |
| Quadrant-wise count rates Data is divided into 100 sec bins |
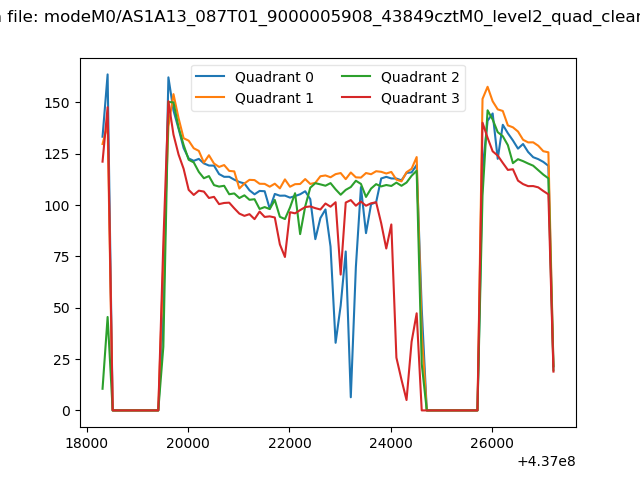 |
|
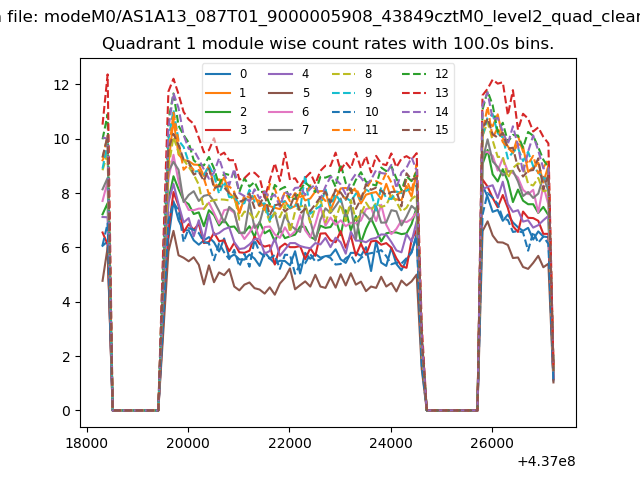
| Module-wise count rates for Quadrant A Data is divided into 100 sec bins |
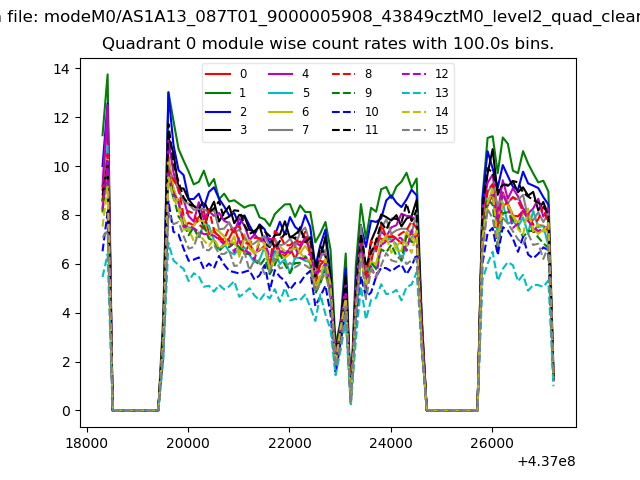 |
 |
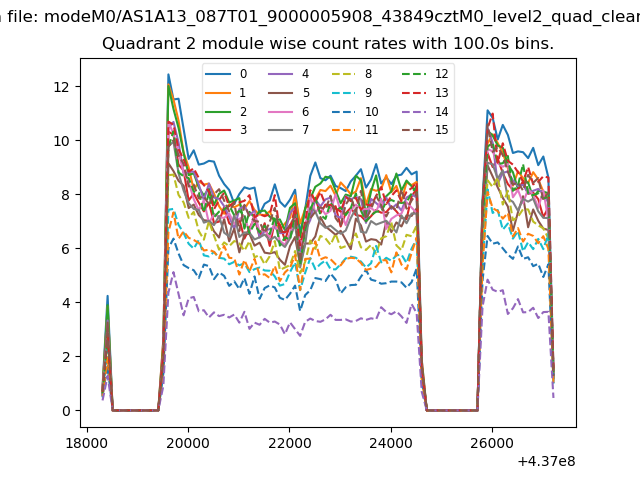
| Module-wise count rates for Quadrant B Data is divided into 100 sec bins |
 |
 |
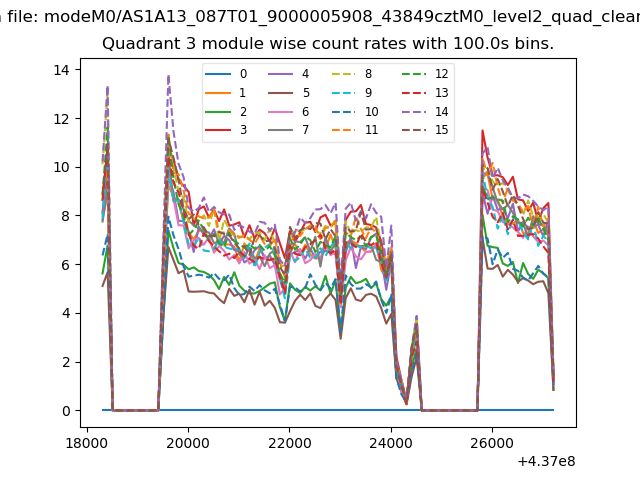
| Module-wise count rates for Quadrant C Data is divided into 100 sec bins |
 |
 |
| Module-wise count rates for Quadrant D Data is divided into 100 sec bins |
 |
 |
| Parameter | Plot |
|---|---|
| CZT HV Monitor | 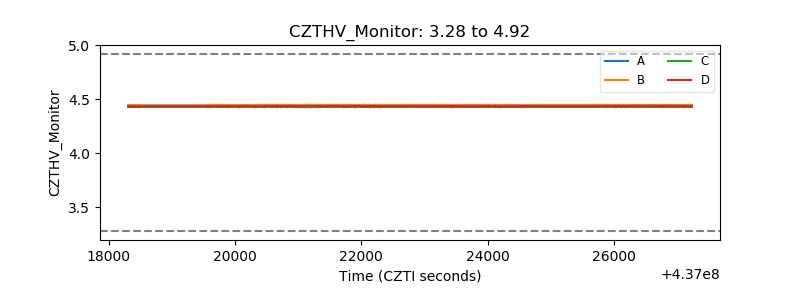 |
| D_VDD | 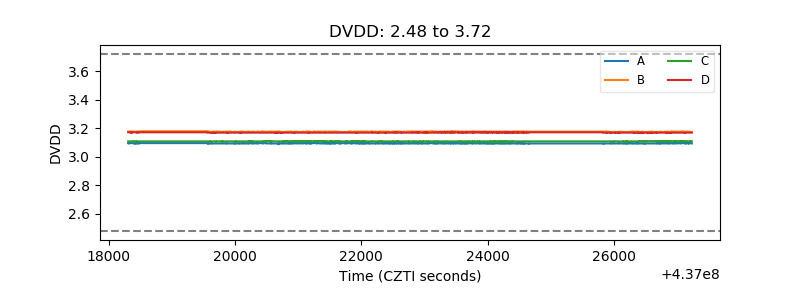 |
| Temperature 1 | 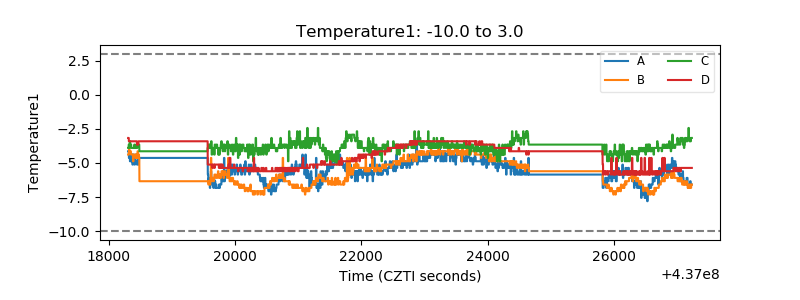 |
| Veto HV Monitor | 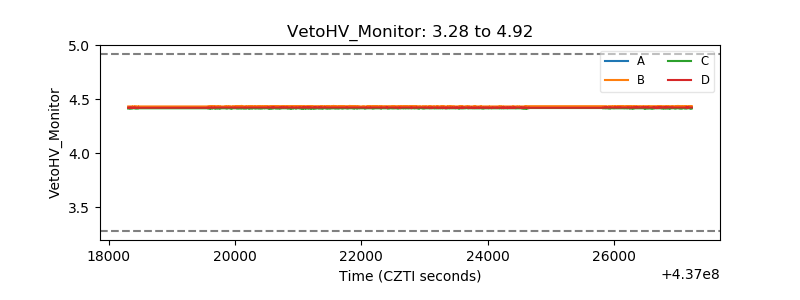 |
| Veto LLD | 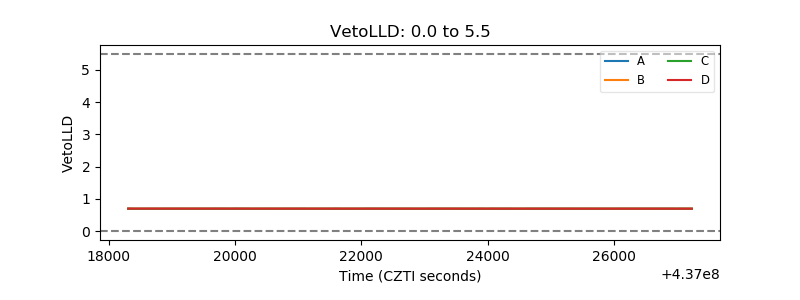 |
| Alpha Counter | 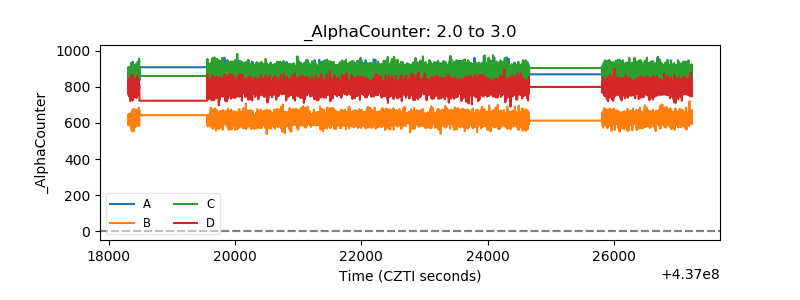 |
| _CPM_Rate | 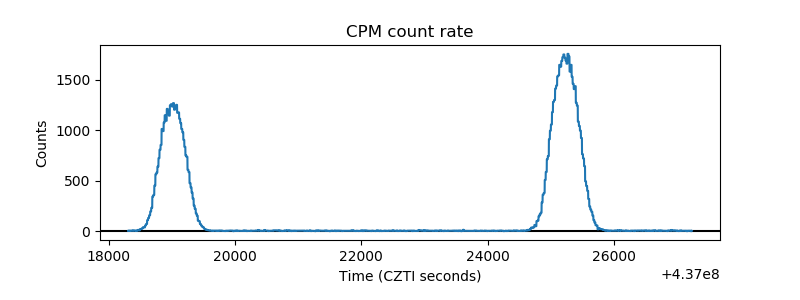 |
| CZT Counter | 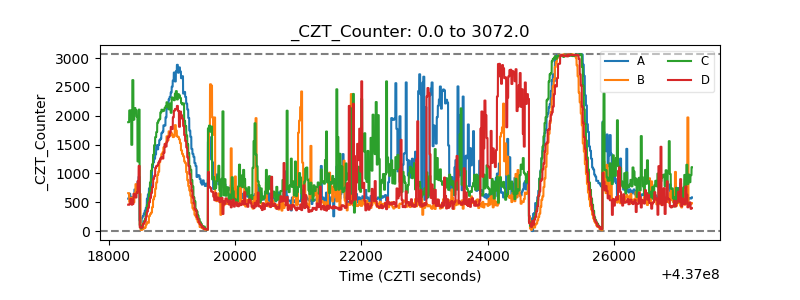 |
| +2.5 Volts monitor | 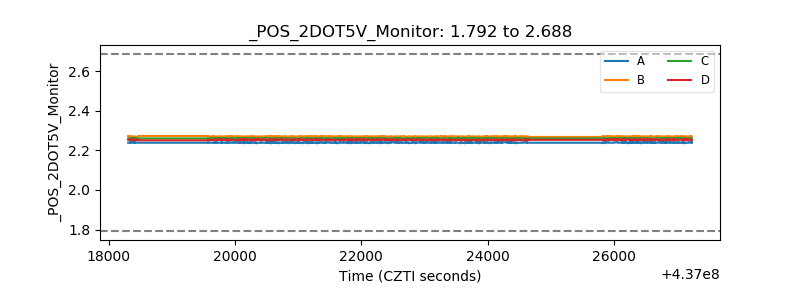 |
| +5 Volts monitor | 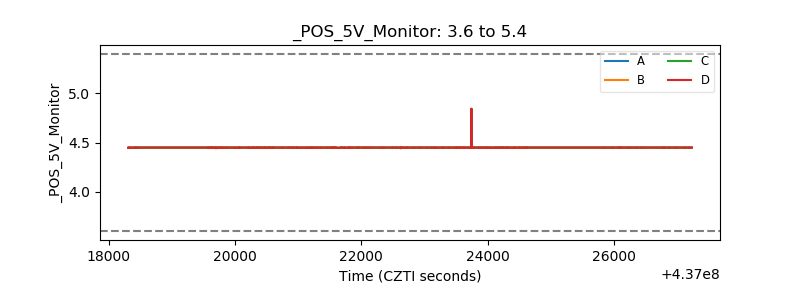 |
| _ROLL_ROT | 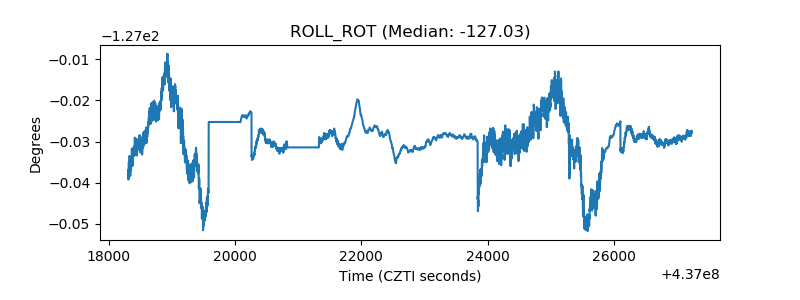 |
| _Roll_DEC | 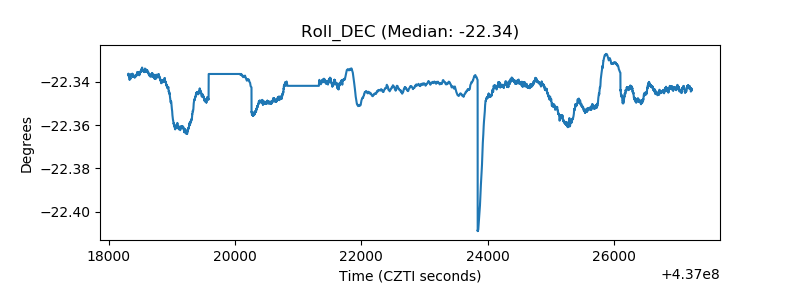 |
| _Roll_RA | 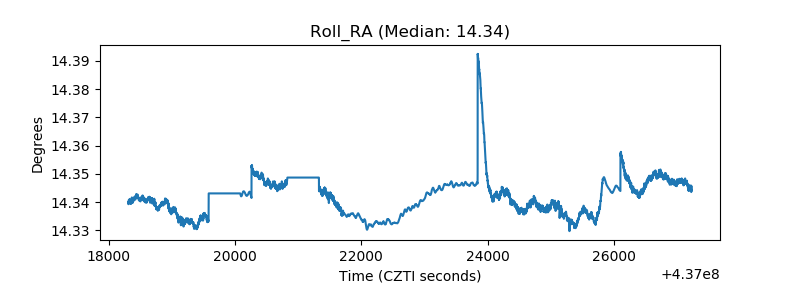 |
| Veto Counter | 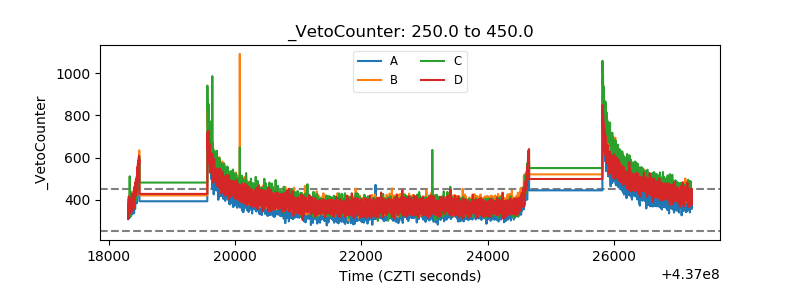 |