| Param | Original file | Final file |
|---|---|---|
| Filename | modeM0/AS1A13_087T01_9000005908_43851cztM0_level2.fits | modeM0/AS1A13_087T01_9000005908_43851cztM0_level2_quad_clean.evt |
| Size (bytes) | 1,733,160,960 | 325,100,160 |
| Size | 1.6 GB | 310.0 MB |
| Events in quadrant A | 14,929,555 | 2,161,945 |
| Events in quadrant B | 10,920,773 | 2,388,364 |
| Events in quadrant C | 22,804,762 | 1,992,618 |
| Events in quadrant D | 13,976,812 | 1,940,085 |
| Mode M9 | |||
|---|---|---|---|
| Quadrant | BADHDUFLAG | Total packets | Discarded packets |
| A | 0 | 47 | 0 |
| B | 0 | 47 | 0 |
| C | 0 | 47 | 0 |
| D | 0 | 47 | 0 |
| Mode M0 | |||
|---|---|---|---|
| Quadrant | BADHDUFLAG | Total packets | Discarded packets |
| A | 0 | 57637 | 4 |
| B | 0 | 44980 | 4 |
| C | 0 | 81856 | 4 |
| D | 0 | 54789 | 4 |
| Mode SS | |||
|---|---|---|---|
| Quadrant | BADHDUFLAG | Total packets | Discarded packets |
| A | 0 | 398 | 0 |
| B | 0 | 398 | 0 |
| C | 0 | 398 | 0 |
| D | 0 | 398 | 0 |
| Quadrant | Total seconds | Saturated seconds | Saturation percentage |
|---|---|---|---|
| A | 19765 | 1102 | 5.575512% |
| B | 19765 | 400 | 2.023779% |
| C | 19764 | 2556 | 12.932605% |
| D | 19765 | 1467 | 7.422211% |
Noise dominated data is calculated using 1-second bins in cleaned event files. If a bin has >2000 counts, and if more than 50% of those come from <1% of pixels, then it is considered to be noise-dominated and hence unusable.
| Quadrant | # 1 sec bins | Bins with >0 counts | Bins with >2000 counts | High rate bins dominated by noise | Noise dominated (total time) | Noise dominated (detector-on time) | Marked lightcurve |
|---|---|---|---|---|---|---|---|
| A | 24375 | 19767 | 669 | 669 | 2.74% | 3.38% | 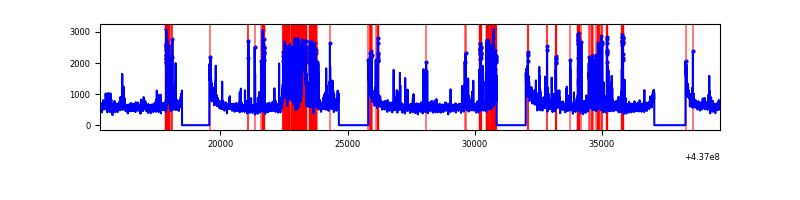 |
| B | 24375 | 19766 | 114 | 114 | 0.47% | 0.58% | 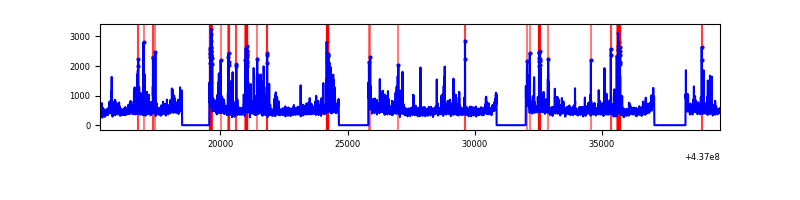 |
| C | 24375 | 19765 | 2008 | 2008 | 8.24% | 10.16% | 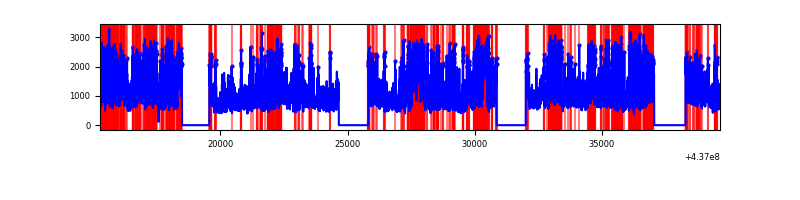 |
| D | 24375 | 19766 | 1316 | 1316 | 5.40% | 6.66% | 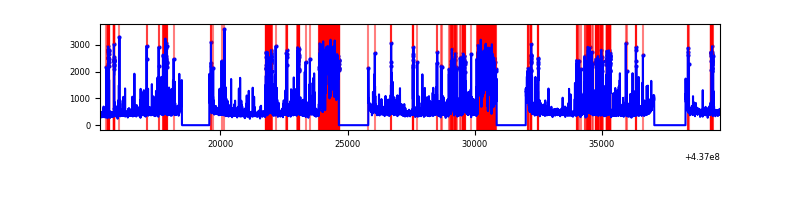 |
Top three noisy pixels from each quadrant. If the there are fewer than three noisy pixels in the level2.evt file, extra rows are filled as -1
| Pixel properties | Quadrant properties | ||||||
|---|---|---|---|---|---|---|---|
| Quadrant | DetID | PixID | Counts | Sigma | Mean | Median | Sigma |
| A | 10 | 83 | 2718927 | 5793.19 | 2310 | 2269 | 468.9 |
| A | 15 | 223 | 2576189 | 5488.81 | 2310 | 2269 | 468.9 |
| A | 10 | 248 | 375770 | 796.48 | 2310 | 2269 | 468.9 |
| B | 5 | 235 | 687223 | 1512.15 | 2341 | 2273 | 453.0 |
| B | 0 | 183 | 235753 | 515.45 | 2341 | 2273 | 453.0 |
| B | 0 | 200 | 227586 | 497.42 | 2341 | 2273 | 453.0 |
| C | 3 | 233 | 9656207 | 18706.79 | 2204 | 2220 | 516.1 |
| C | 0 | 239 | 1892272 | 3662.4 | 2204 | 2220 | 516.1 |
| C | 15 | 158 | 1476286 | 2856.34 | 2204 | 2220 | 516.1 |
| D | 5 | 235 | 1744392 | 3127.6 | 2248 | 2189 | 557.0 |
| D | 2 | 249 | 1291590 | 2314.73 | 2248 | 2189 | 557.0 |
| D | 13 | 249 | 657065 | 1175.63 | 2248 | 2189 | 557.0 |
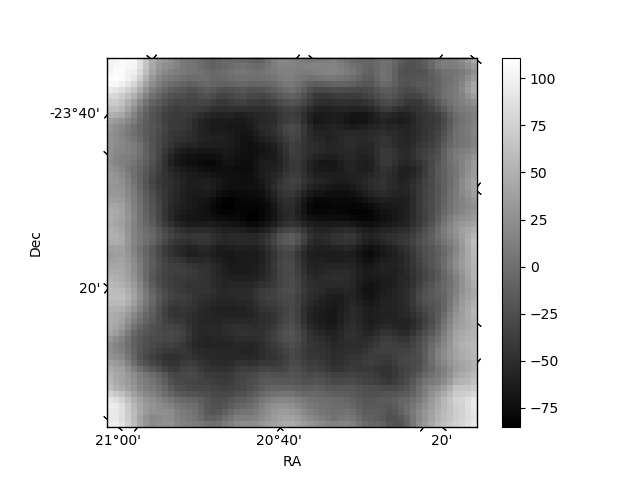
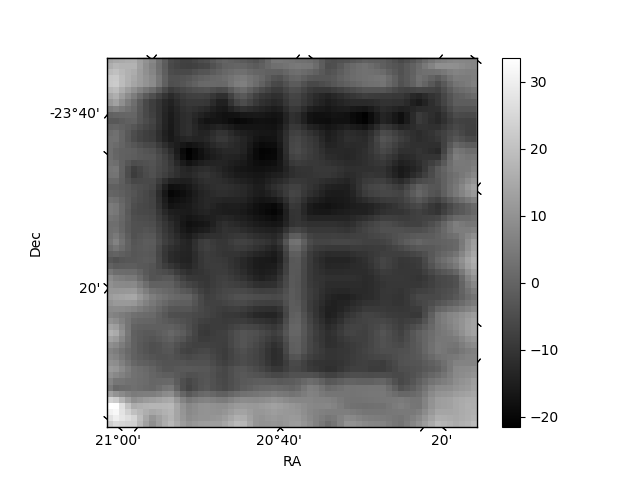
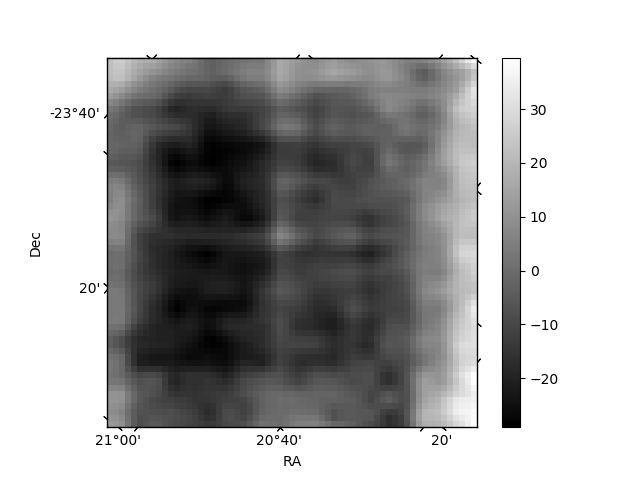
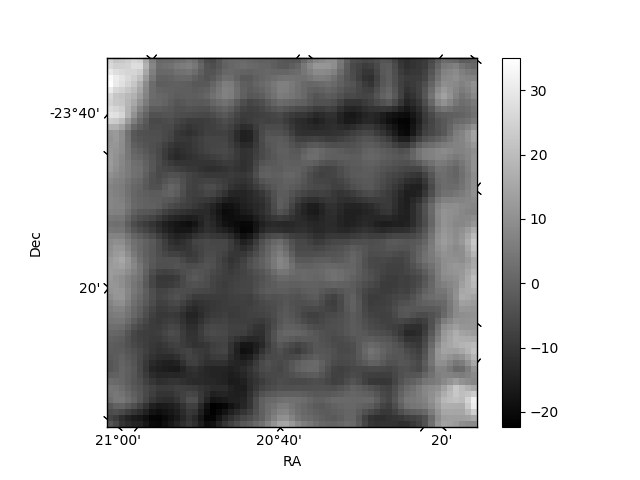
Histogram calculated using DETX and DETY for each event in the final _common_clean file
| Quadrant A | 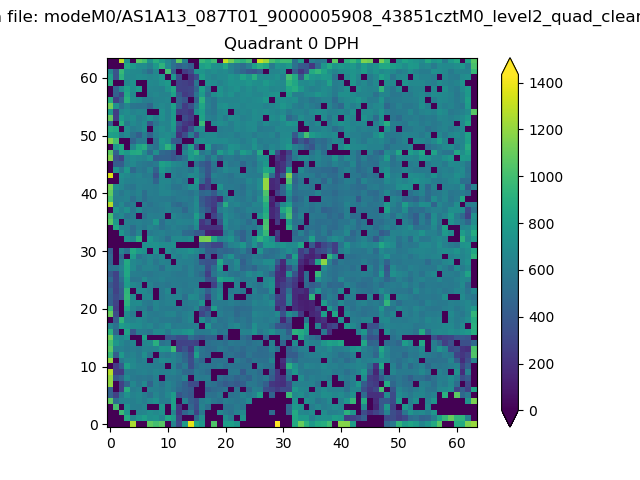 |
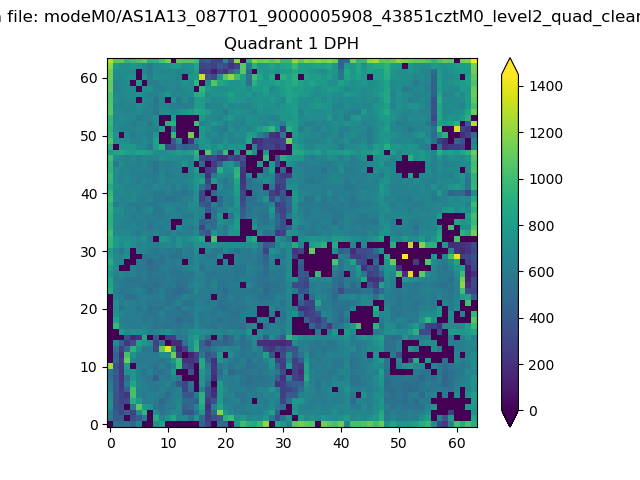 |
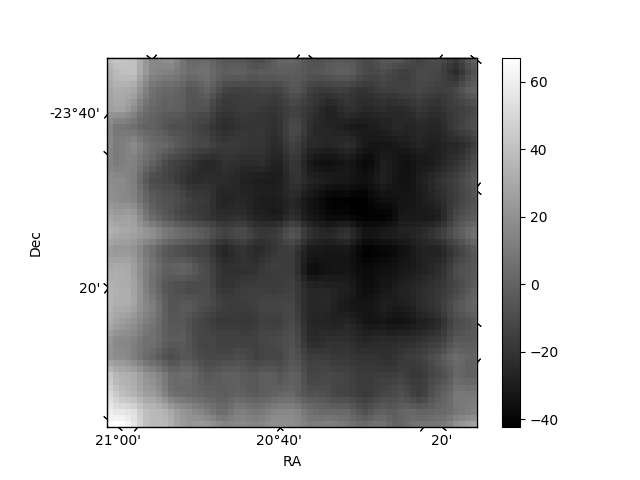
Quadrant B |
|---|---|---|---|
| Quadrant D | 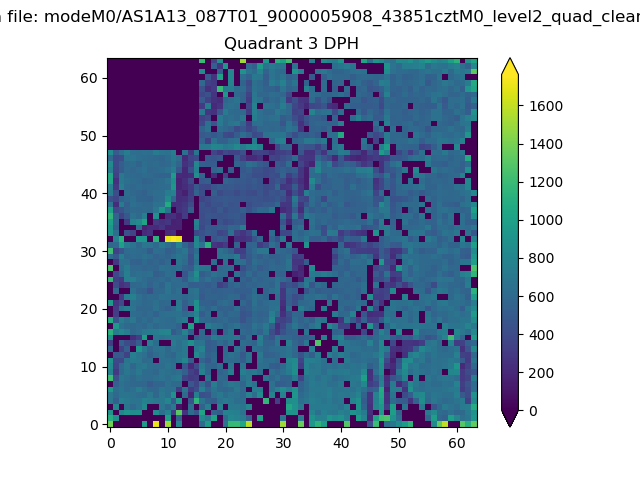 |
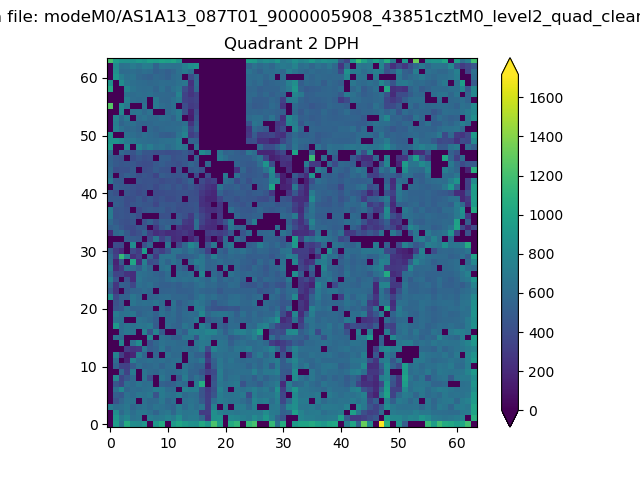 |
Quadrant C |
| Plot type | Count rate plots | Images |
|---|---|---|
| Comparison with Poisson distribution Blue bars denote a histogram of data divided into 1 sec bins. Red curve is a Poisson curve with rate = median count rate of data. |
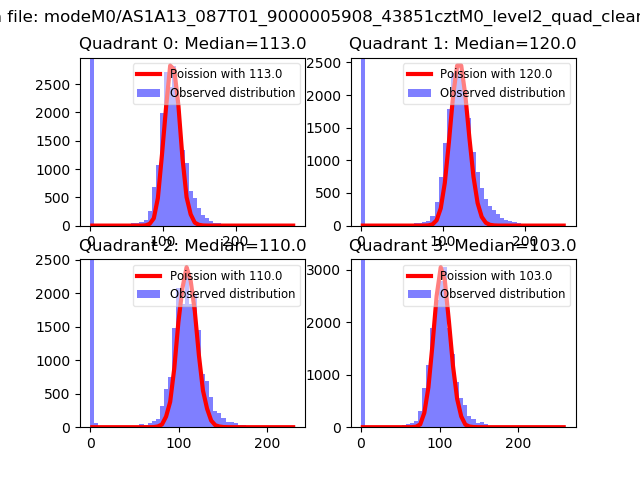 |
 |
| Quadrant-wise count rates Data is divided into 100 sec bins |
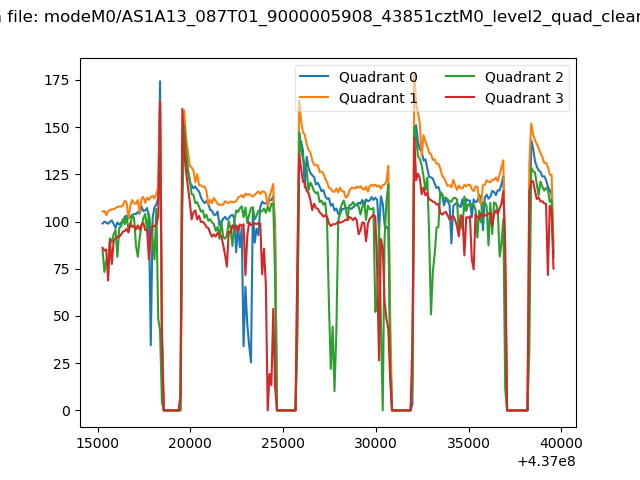 |
|
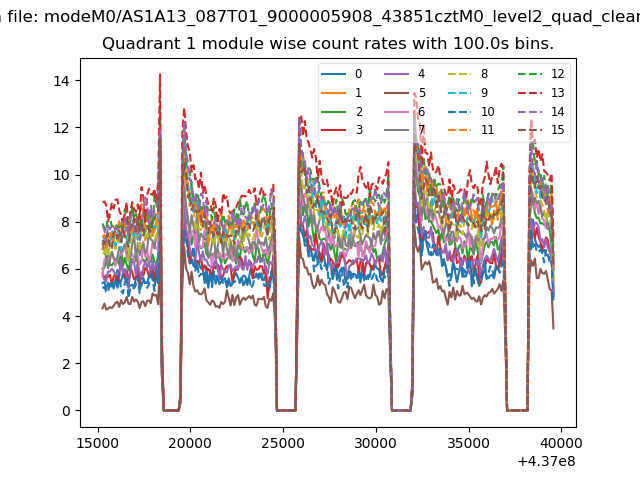
| Module-wise count rates for Quadrant A Data is divided into 100 sec bins |
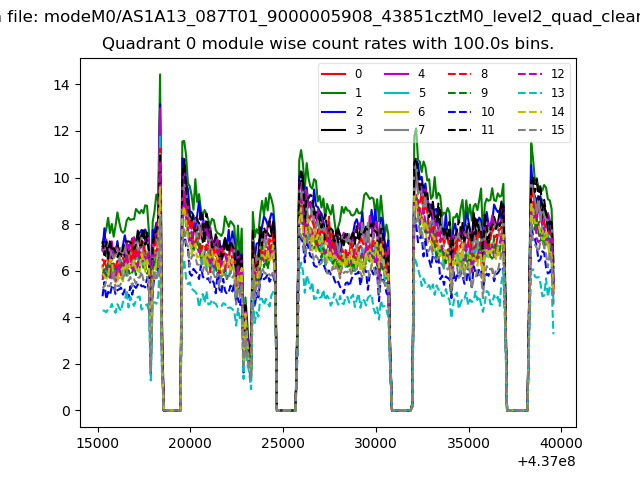 |
 |
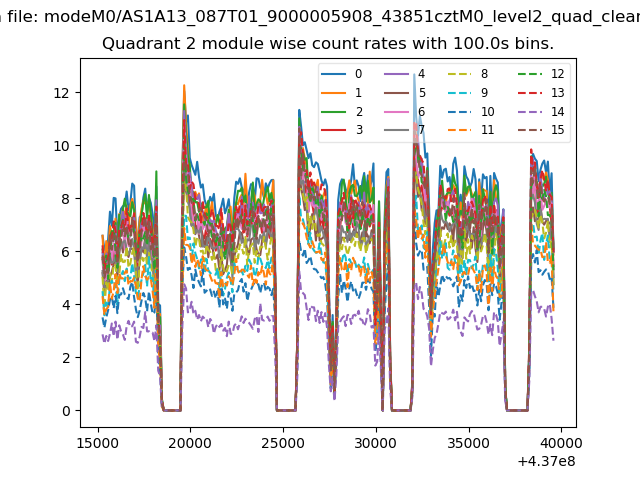
| Module-wise count rates for Quadrant B Data is divided into 100 sec bins |
 |
 |
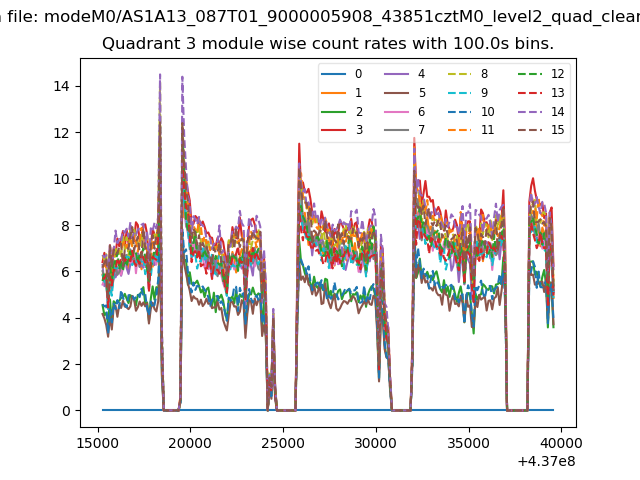
| Module-wise count rates for Quadrant C Data is divided into 100 sec bins |
 |
 |
| Module-wise count rates for Quadrant D Data is divided into 100 sec bins |
 |
 |
| Parameter | Plot |
|---|---|
| CZT HV Monitor | 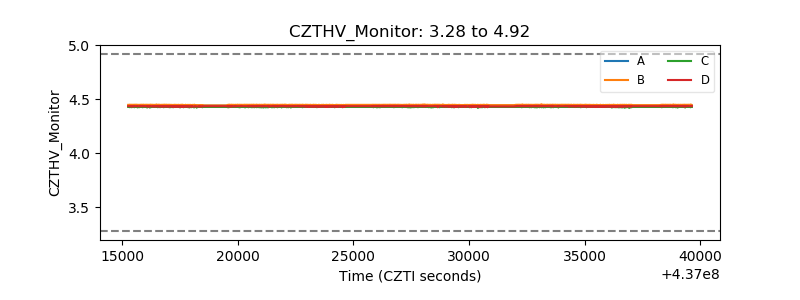 |
| D_VDD | 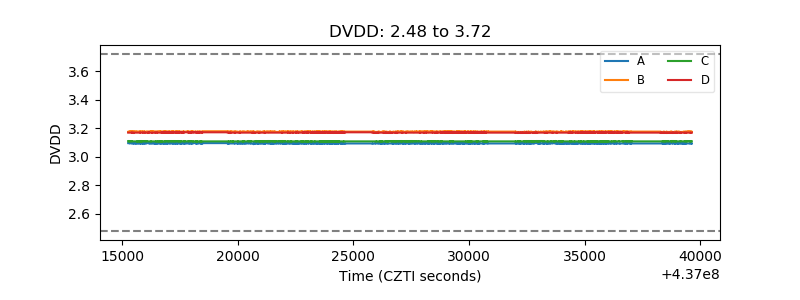 |
| Temperature 1 | 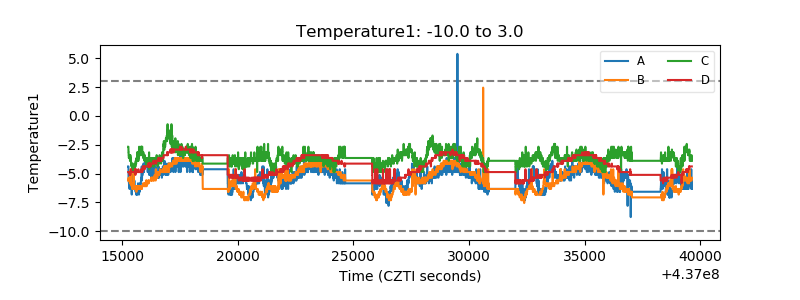 |
| Veto HV Monitor | 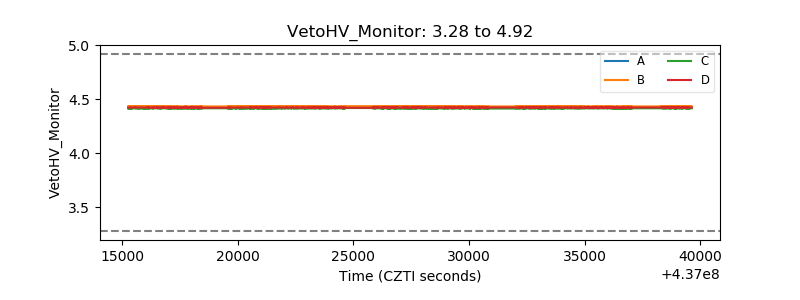 |
| Veto LLD | 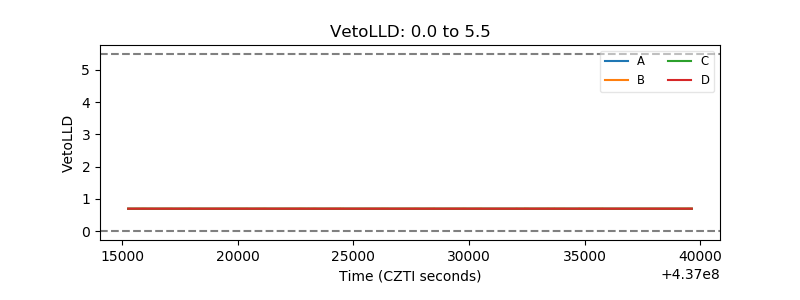 |
| Alpha Counter | 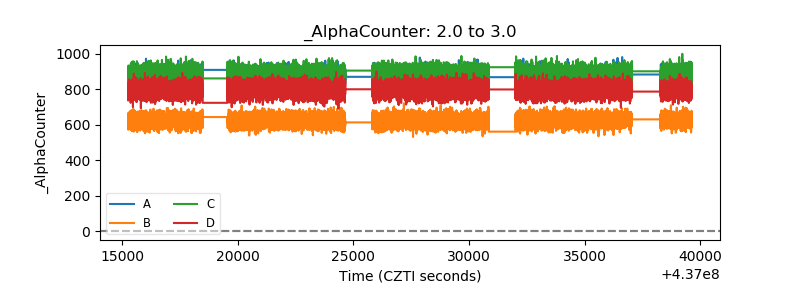 |
| _CPM_Rate | 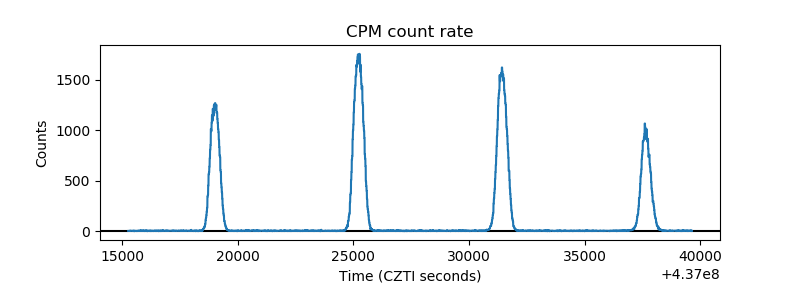 |
| CZT Counter | 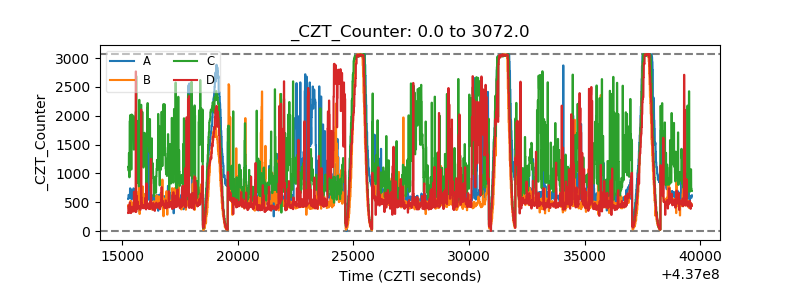 |
| +2.5 Volts monitor | 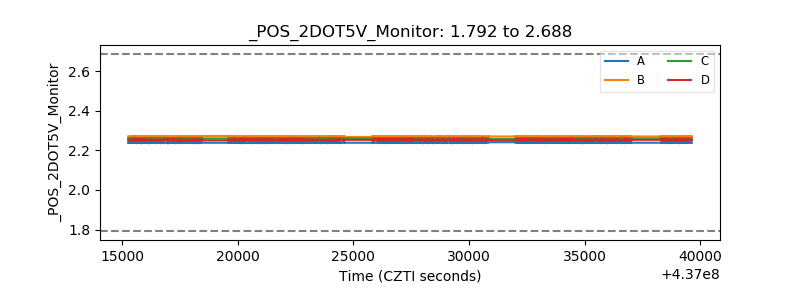 |
| +5 Volts monitor | 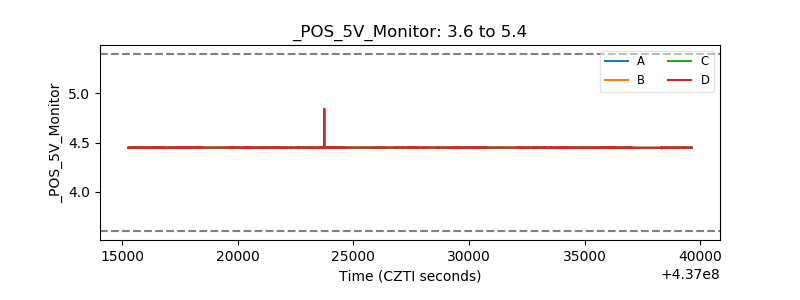 |
| _ROLL_ROT | 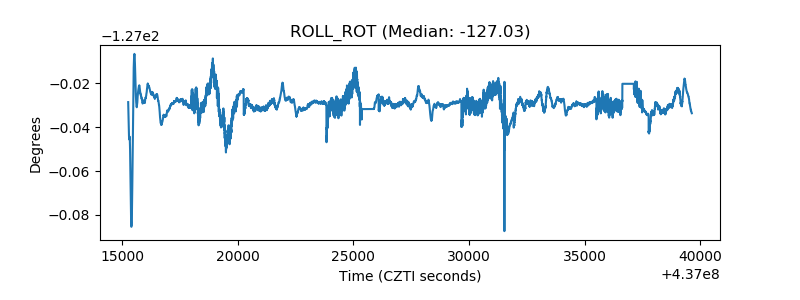 |
| _Roll_DEC | 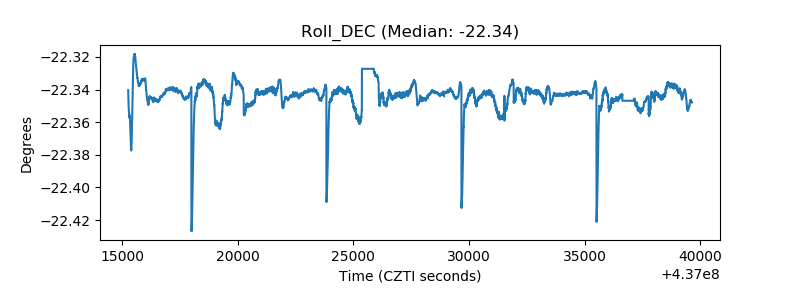 |
| _Roll_RA | 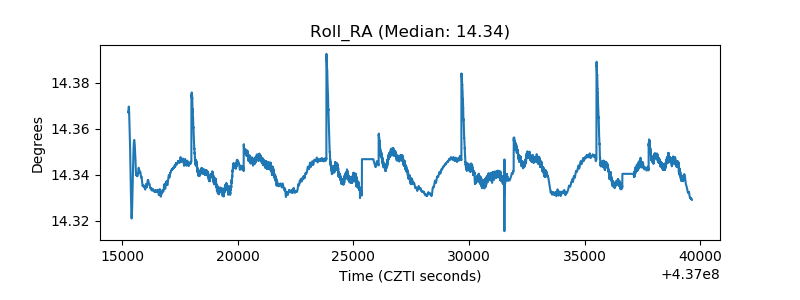 |
| Veto Counter | 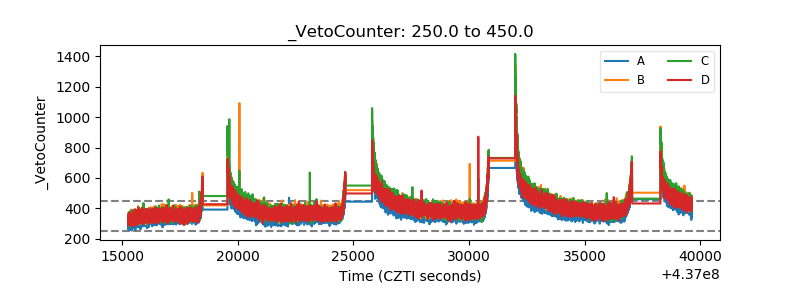 |