| Param | Original file | Final file |
|---|---|---|
| Filename | modeM0/AS1A13_087T01_9000005908_43852cztM0_level2.fits | modeM0/AS1A13_087T01_9000005908_43852cztM0_level2_quad_clean.evt |
| Size (bytes) | 538,153,920 | 112,728,960 |
| Size | 513.2 MB | 107.5 MB |
| Events in quadrant A | 4,294,790 | 766,301 |
| Events in quadrant B | 3,513,653 | 804,170 |
| Events in quadrant C | 7,852,661 | 694,991 |
| Events in quadrant D | 3,750,789 | 690,913 |
| Mode M9 | |||
|---|---|---|---|
| Quadrant | BADHDUFLAG | Total packets | Discarded packets |
| A | 0 | 22 | 0 |
| B | 0 | 23 | 0 |
| C | 0 | 23 | 0 |
| D | 0 | 23 | 0 |
| Mode M0 | |||
|---|---|---|---|
| Quadrant | BADHDUFLAG | Total packets | Discarded packets |
| A | 0 | 16998 | 3 |
| B | 0 | 14638 | 1 |
| C | 0 | 28015 | 1 |
| D | 0 | 15582 | 1 |
| Mode SS | |||
|---|---|---|---|
| Quadrant | BADHDUFLAG | Total packets | Discarded packets |
| A | 0 | 132 | 0 |
| B | 0 | 132 | 0 |
| C | 0 | 132 | 0 |
| D | 0 | 132 | 0 |
| Quadrant | Total seconds | Saturated seconds | Saturation percentage |
|---|---|---|---|
| A | 6563 | 225 | 3.428310% |
| B | 6563 | 201 | 3.062624% |
| C | 6563 | 932 | 14.200823% |
| D | 6563 | 247 | 3.763523% |
Noise dominated data is calculated using 1-second bins in cleaned event files. If a bin has >2000 counts, and if more than 50% of those come from <1% of pixels, then it is considered to be noise-dominated and hence unusable.
| Quadrant | # 1 sec bins | Bins with >0 counts | Bins with >2000 counts | High rate bins dominated by noise | Noise dominated (total time) | Noise dominated (detector-on time) | Marked lightcurve |
|---|---|---|---|---|---|---|---|
| A | 7643 | 6563 | 12 | 12 | 0.16% | 0.18% | 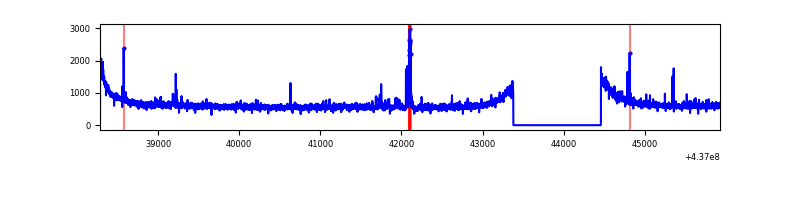 |
| B | 7643 | 6563 | 24 | 24 | 0.31% | 0.37% | 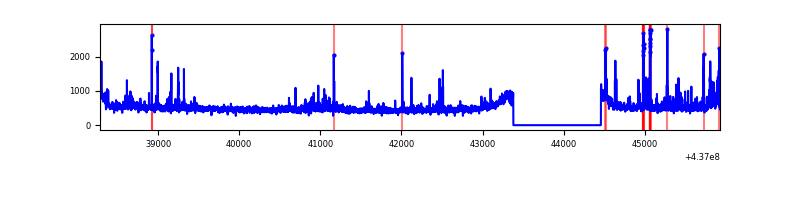 |
| C | 7643 | 6563 | 753 | 753 | 9.85% | 11.47% | 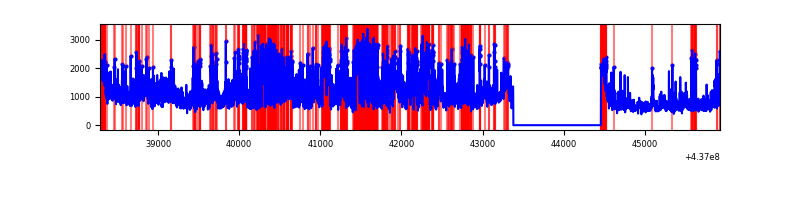 |
| D | 7643 | 6563 | 105 | 105 | 1.37% | 1.60% | 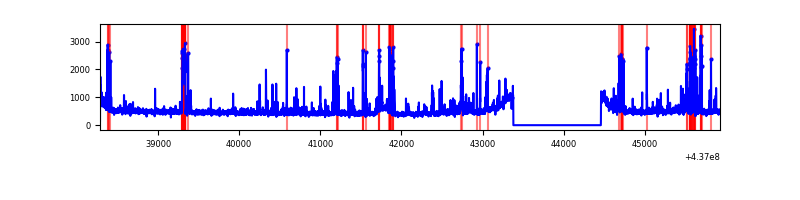 |
Top three noisy pixels from each quadrant. If the there are fewer than three noisy pixels in the level2.evt file, extra rows are filled as -1
| Pixel properties | Quadrant properties | ||||||
|---|---|---|---|---|---|---|---|
| Quadrant | DetID | PixID | Counts | Sigma | Mean | Median | Sigma |
| A | 10 | 83 | 981844 | 5963.4 | 801 | 784 | 164.5 |
| A | 15 | 223 | 96880 | 584.12 | 801 | 784 | 164.5 |
| A | 13 | 210 | 37651 | 224.1 | 801 | 784 | 164.5 |
| B | 5 | 172 | 86582 | 544.47 | 801 | 777 | 157.6 |
| B | 10 | 128 | 86199 | 542.04 | 801 | 777 | 157.6 |
| B | 0 | 200 | 67288 | 422.04 | 801 | 777 | 157.6 |
| C | 3 | 233 | 3452875 | 19464.39 | 755 | 761 | 177.4 |
| C | 0 | 239 | 1216174 | 6852.98 | 755 | 761 | 177.4 |
| C | 14 | 254 | 76241 | 425.59 | 755 | 761 | 177.4 |
| D | 7 | 80 | 164855 | 823.47 | 791 | 766 | 199.3 |
| D | 13 | 249 | 128766 | 642.36 | 791 | 766 | 199.3 |
| D | 10 | 102 | 99553 | 495.76 | 791 | 766 | 199.3 |
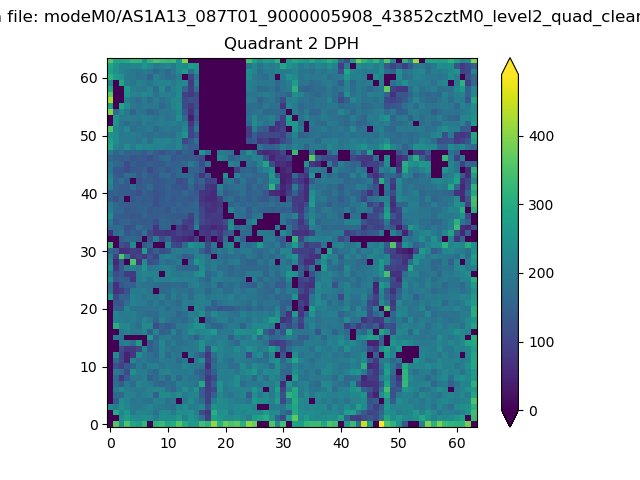
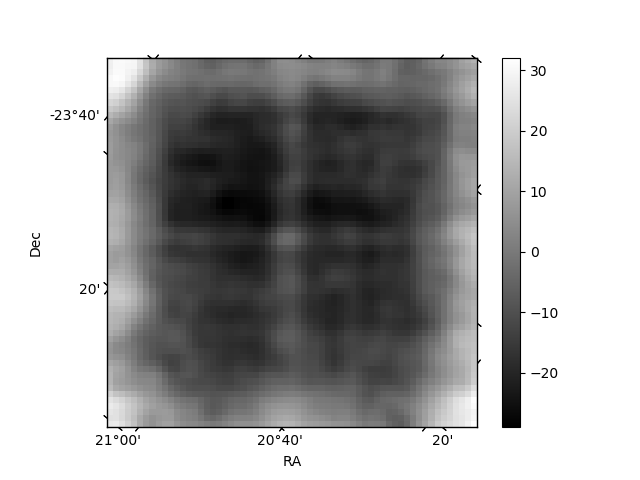
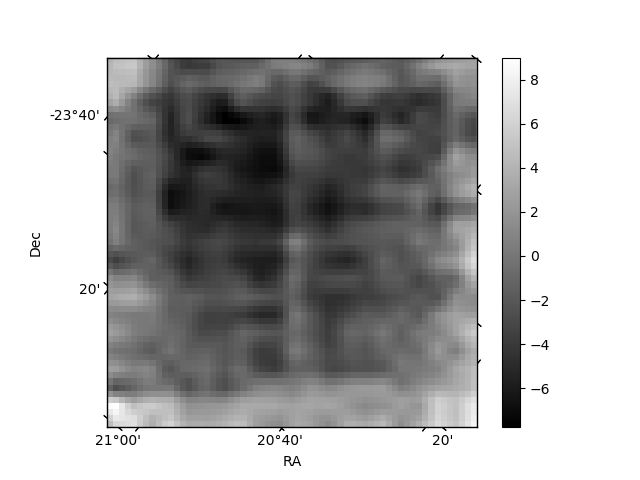
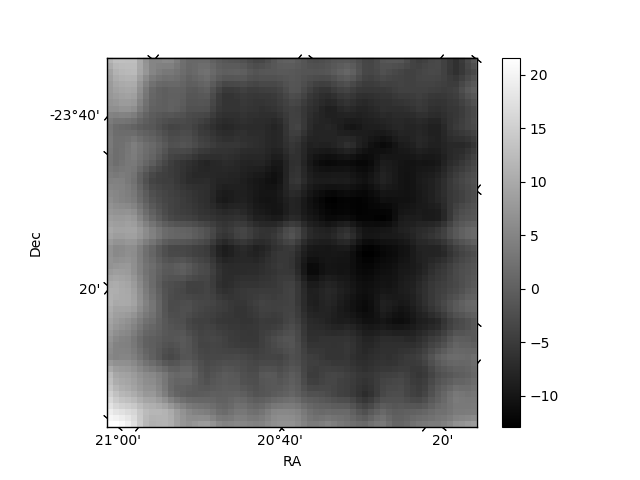
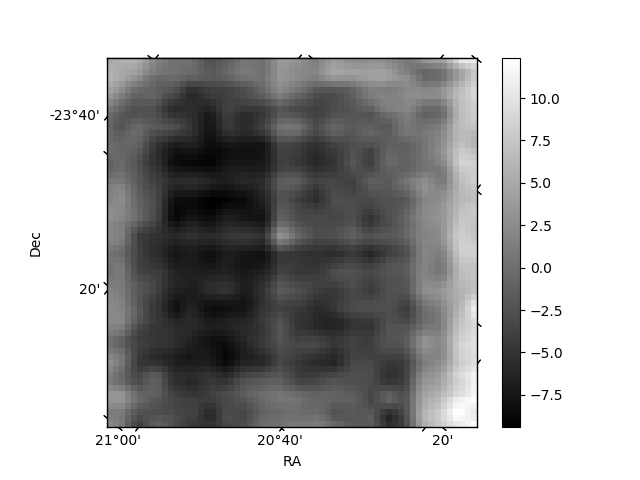
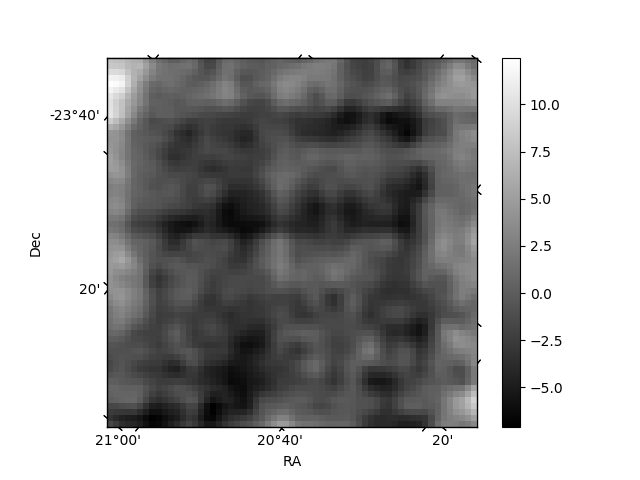
Histogram calculated using DETX and DETY for each event in the final _common_clean file
| Quadrant A | 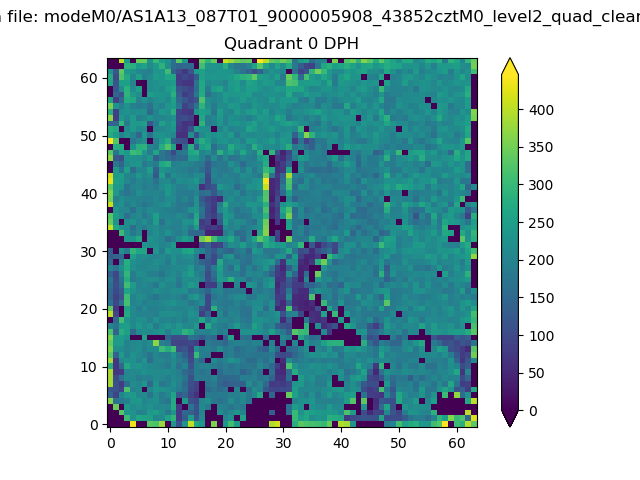 |
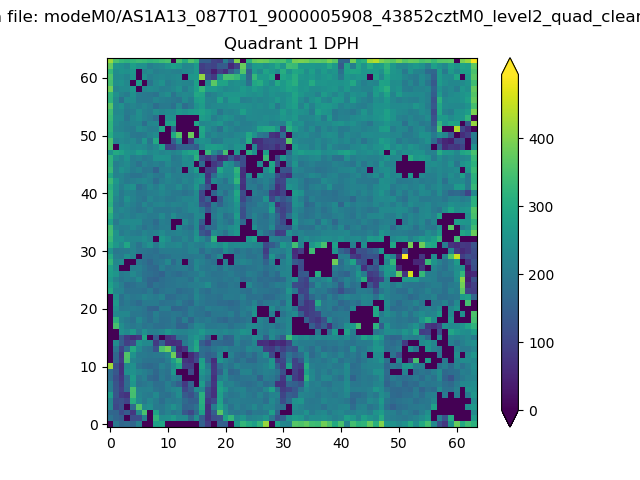 |
Quadrant B |
|---|---|---|---|
| Quadrant D | 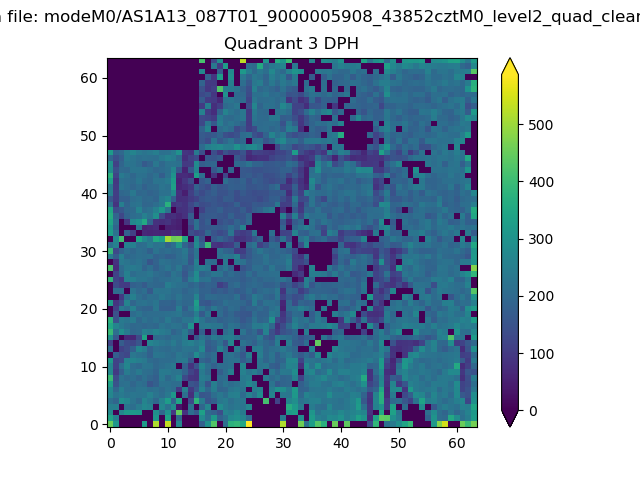 |
 |
Quadrant C |
| Plot type | Count rate plots | Images |
|---|---|---|
| Comparison with Poisson distribution Blue bars denote a histogram of data divided into 1 sec bins. Red curve is a Poisson curve with rate = median count rate of data. |
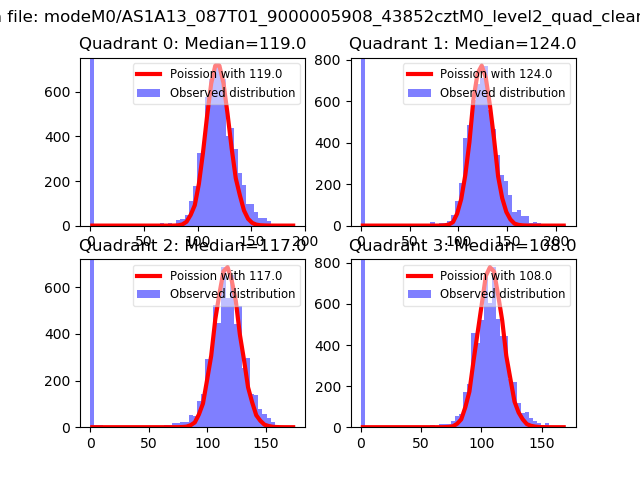 |
 |
| Quadrant-wise count rates Data is divided into 100 sec bins |
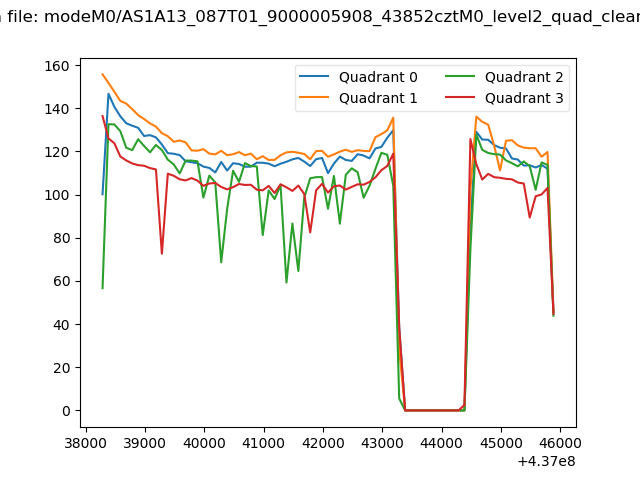 |
|
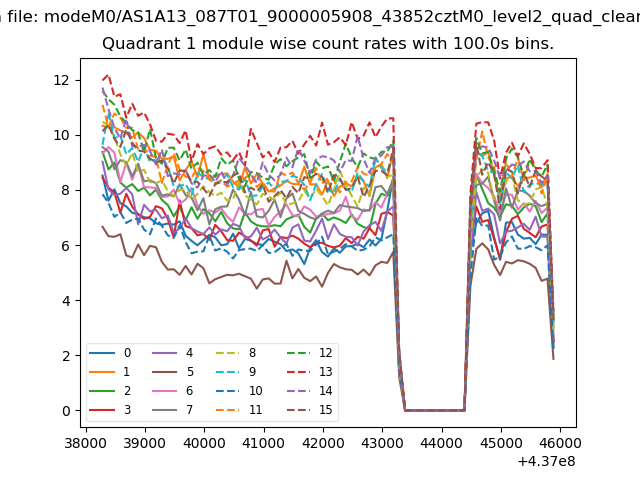
| Module-wise count rates for Quadrant A Data is divided into 100 sec bins |
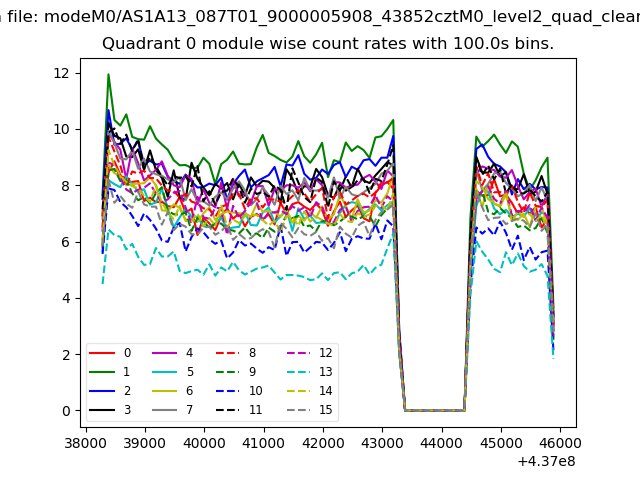 |
 |
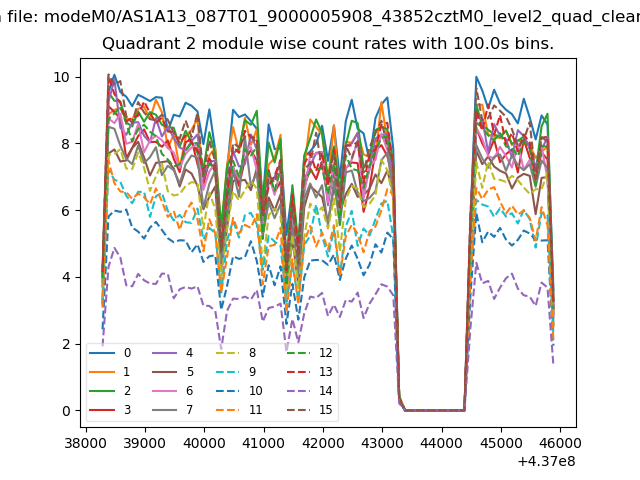
| Module-wise count rates for Quadrant B Data is divided into 100 sec bins |
 |
 |
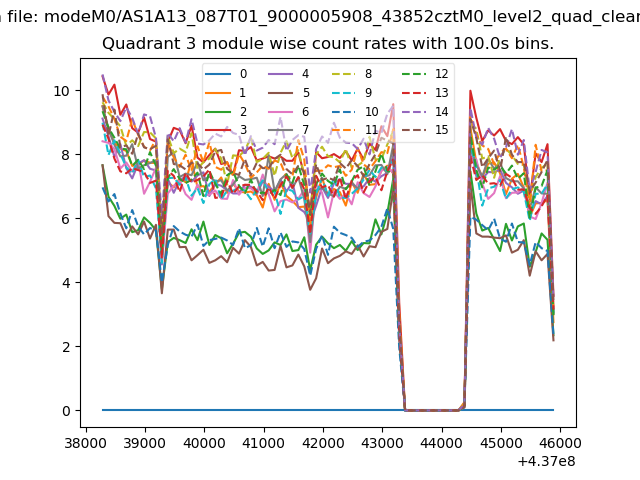
| Module-wise count rates for Quadrant C Data is divided into 100 sec bins |
 |
 |
| Module-wise count rates for Quadrant D Data is divided into 100 sec bins |
 |
 |
| Parameter | Plot |
|---|---|
| CZT HV Monitor | 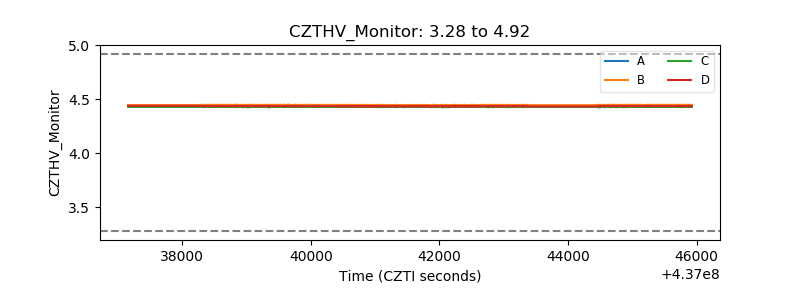 |
| D_VDD | 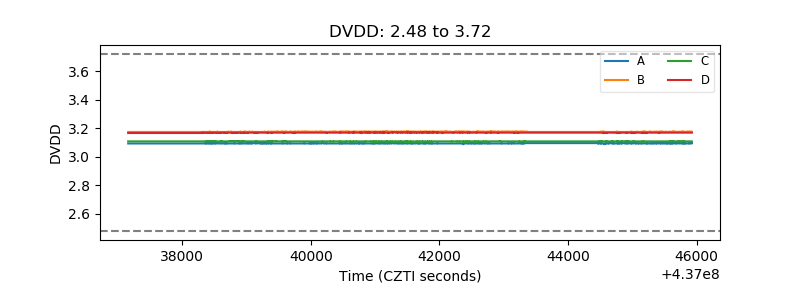 |
| Temperature 1 | 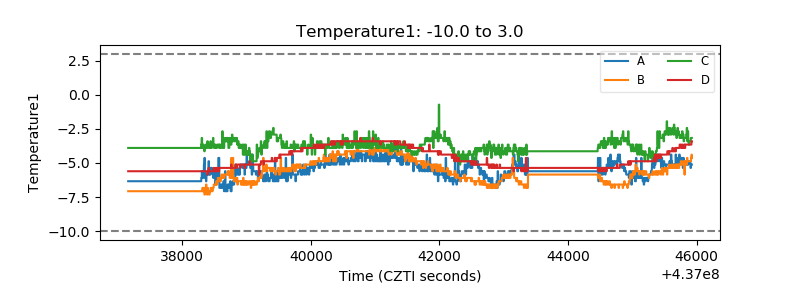 |
| Veto HV Monitor |  |
| Veto LLD | 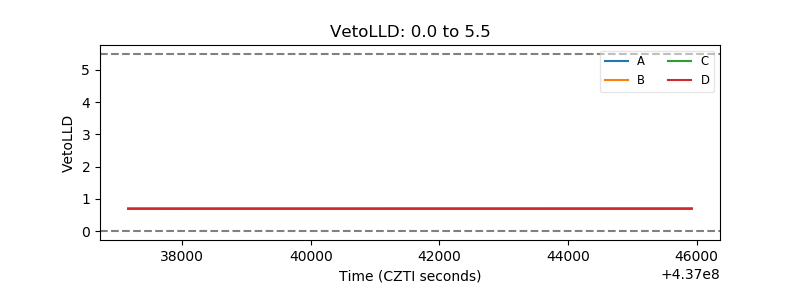 |
| Alpha Counter | 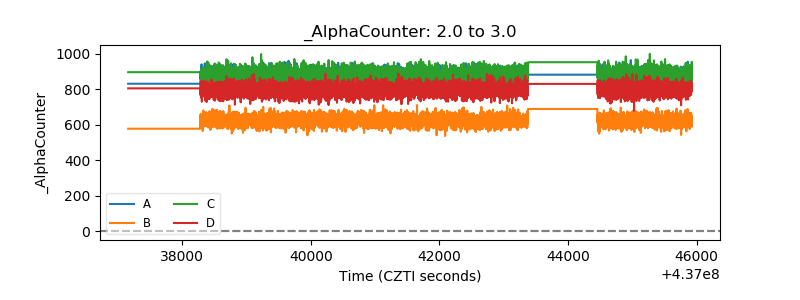 |
| _CPM_Rate | 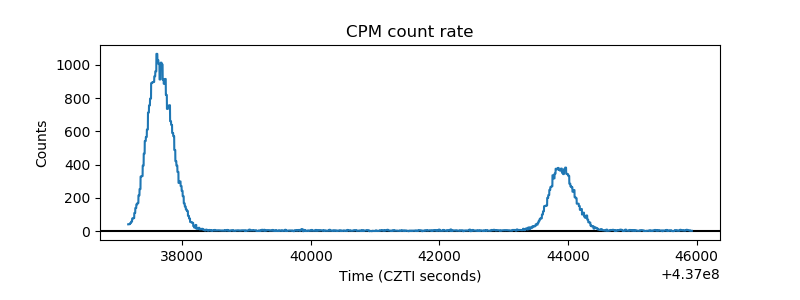 |
| CZT Counter | 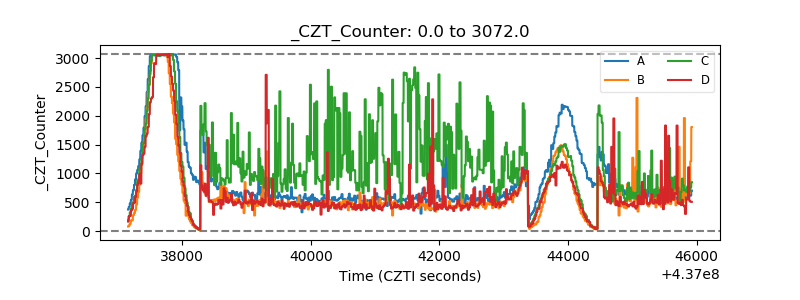 |
| +2.5 Volts monitor | 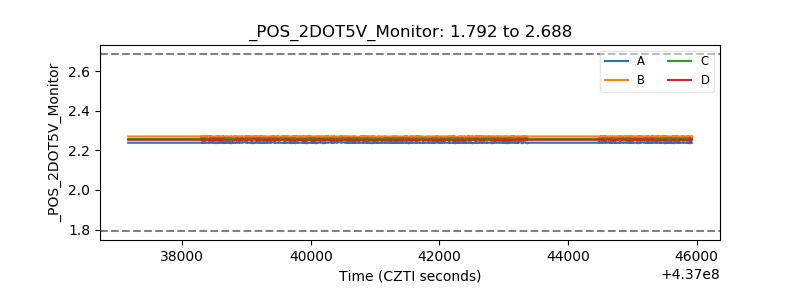 |
| +5 Volts monitor | 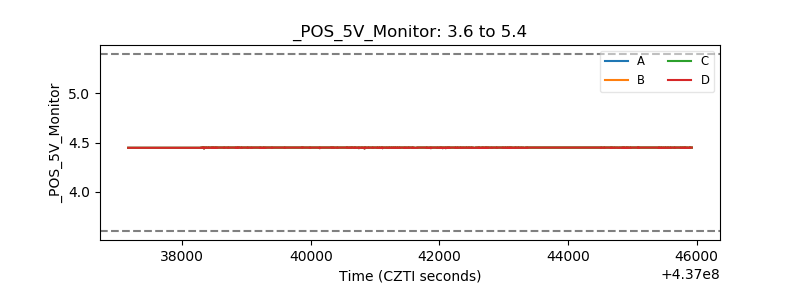 |
| _ROLL_ROT | 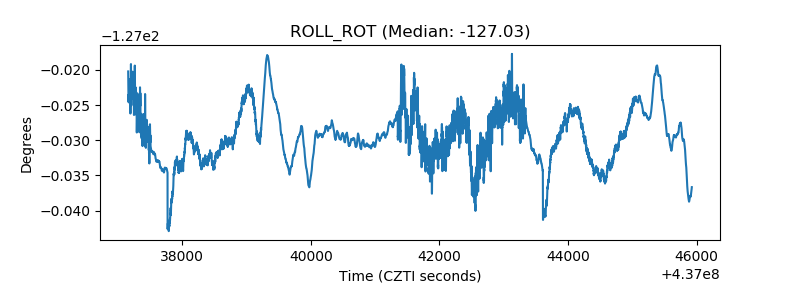 |
| _Roll_DEC | 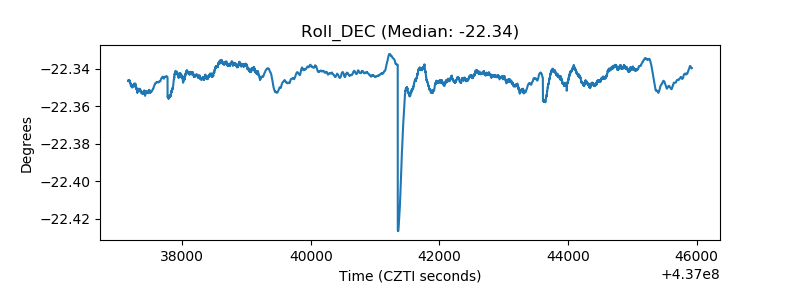 |
| _Roll_RA | 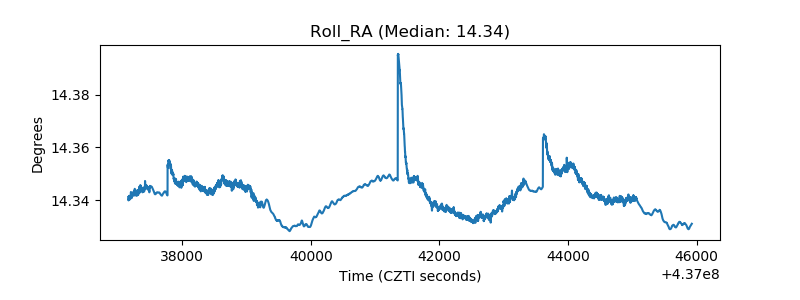 |
| Veto Counter | 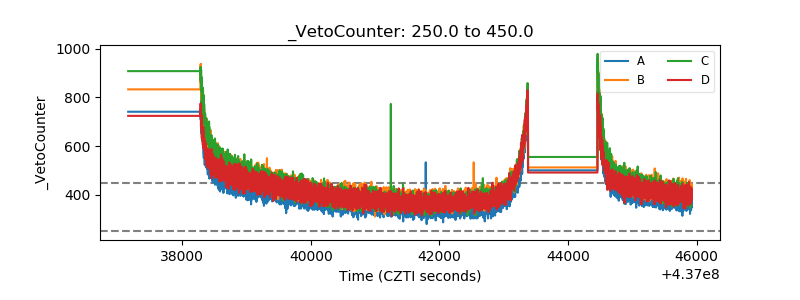 |