| Param | Original file | Final file |
|---|---|---|
| Filename | modeM0/AS1A13_087T01_9000005908_43853cztM0_level2.fits | modeM0/AS1A13_087T01_9000005908_43853cztM0_level2_quad_clean.evt |
| Size (bytes) | 593,314,560 | 110,661,120 |
| Size | 565.8 MB | 105.5 MB |
| Events in quadrant A | 6,108,895 | 721,792 |
| Events in quadrant B | 3,778,539 | 782,270 |
| Events in quadrant C | 6,644,376 | 719,121 |
| Events in quadrant D | 4,900,417 | 650,788 |
| Mode M9 | |||
|---|---|---|---|
| Quadrant | BADHDUFLAG | Total packets | Discarded packets |
| A | 0 | 17 | 0 |
| B | 0 | 18 | 0 |
| C | 0 | 18 | 0 |
| D | 0 | 18 | 0 |
| Mode M0 | |||
|---|---|---|---|
| Quadrant | BADHDUFLAG | Total packets | Discarded packets |
| A | 0 | 22938 | 1 |
| B | 0 | 15767 | 1 |
| C | 0 | 24594 | 1 |
| D | 0 | 19191 | 1 |
| Mode SS | |||
|---|---|---|---|
| Quadrant | BADHDUFLAG | Total packets | Discarded packets |
| A | 0 | 138 | 0 |
| B | 0 | 138 | 0 |
| C | 0 | 138 | 0 |
| D | 0 | 138 | 0 |
| Quadrant | Total seconds | Saturated seconds | Saturation percentage |
|---|---|---|---|
| A | 6845 | 654 | 9.554419% |
| B | 6845 | 284 | 4.149014% |
| C | 6845 | 645 | 9.422936% |
| D | 6845 | 611 | 8.926224% |
Noise dominated data is calculated using 1-second bins in cleaned event files. If a bin has >2000 counts, and if more than 50% of those come from <1% of pixels, then it is considered to be noise-dominated and hence unusable.
| Quadrant | # 1 sec bins | Bins with >0 counts | Bins with >2000 counts | High rate bins dominated by noise | Noise dominated (total time) | Noise dominated (detector-on time) | Marked lightcurve |
|---|---|---|---|---|---|---|---|
| A | 7705 | 6845 | 328 | 328 | 4.26% | 4.79% | 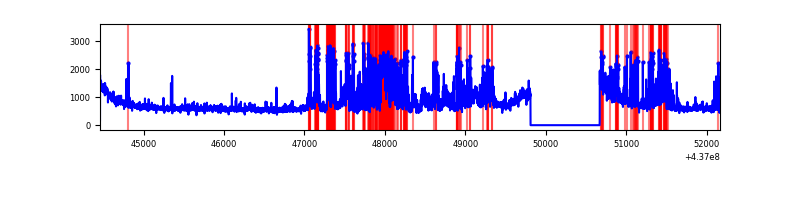 |
| B | 7705 | 6845 | 27 | 27 | 0.35% | 0.39% | 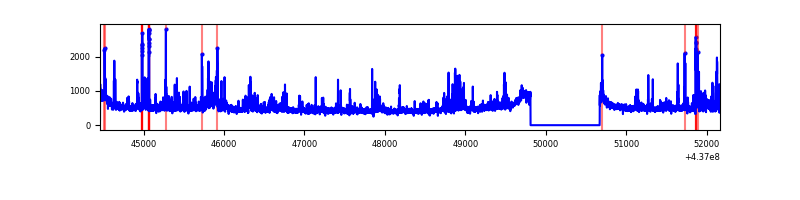 |
| C | 7705 | 6845 | 388 | 388 | 5.04% | 5.67% | 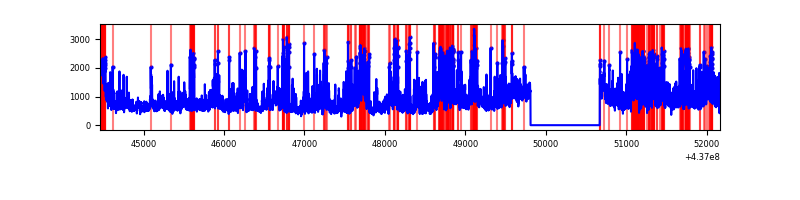 |
| D | 7705 | 6845 | 487 | 487 | 6.32% | 7.11% | 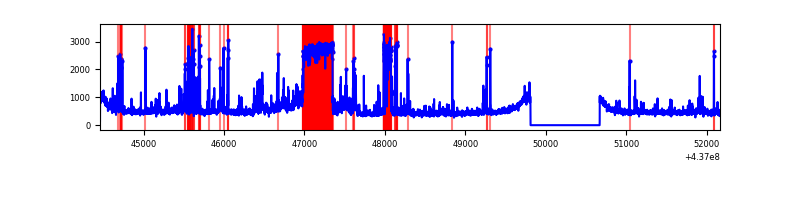 |
Top three noisy pixels from each quadrant. If the there are fewer than three noisy pixels in the level2.evt file, extra rows are filled as -1
| Pixel properties | Quadrant properties | ||||||
|---|---|---|---|---|---|---|---|
| Quadrant | DetID | PixID | Counts | Sigma | Mean | Median | Sigma |
| A | 15 | 223 | 1731307 | 10393.42 | 800 | 783 | 166.5 |
| A | 10 | 83 | 990743 | 5945.64 | 800 | 783 | 166.5 |
| A | 10 | 248 | 226175 | 1353.69 | 800 | 783 | 166.5 |
| B | 0 | 200 | 160772 | 993.85 | 811 | 786 | 161.0 |
| B | 0 | 183 | 123613 | 763.02 | 811 | 786 | 161.0 |
| B | 5 | 172 | 85548 | 526.55 | 811 | 786 | 161.0 |
| C | 3 | 233 | 2283892 | 12388.74 | 778 | 785 | 184.3 |
| C | 0 | 239 | 948448 | 5142.27 | 778 | 785 | 184.3 |
| C | 14 | 254 | 175856 | 949.98 | 778 | 785 | 184.3 |
| D | 12 | 17 | 1114316 | 5605.28 | 784 | 759 | 198.7 |
| D | 7 | 80 | 215533 | 1081.1 | 784 | 759 | 198.7 |
| D | 5 | 235 | 199866 | 1002.24 | 784 | 759 | 198.7 |
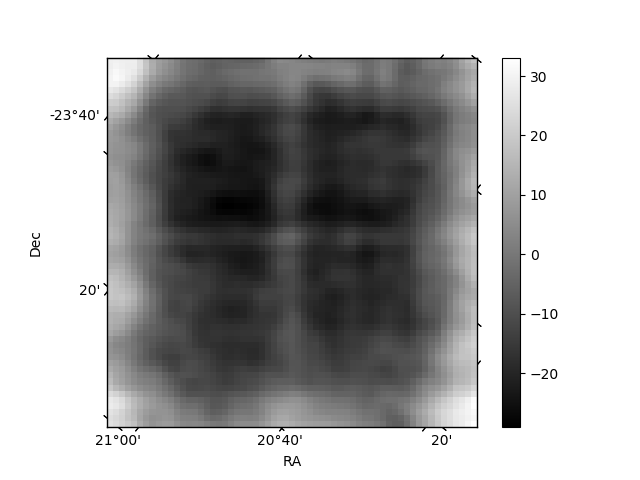
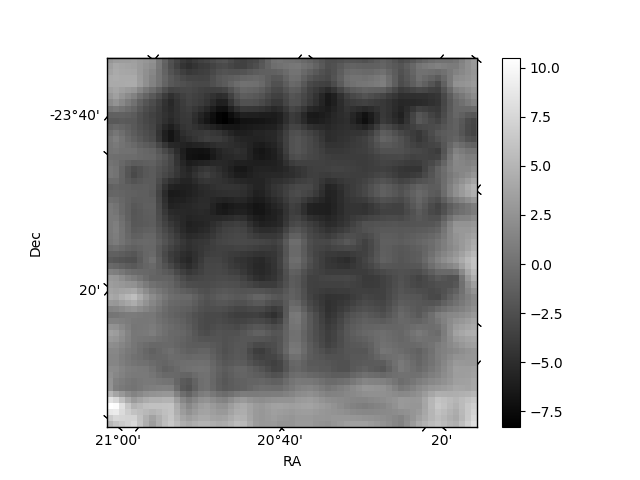
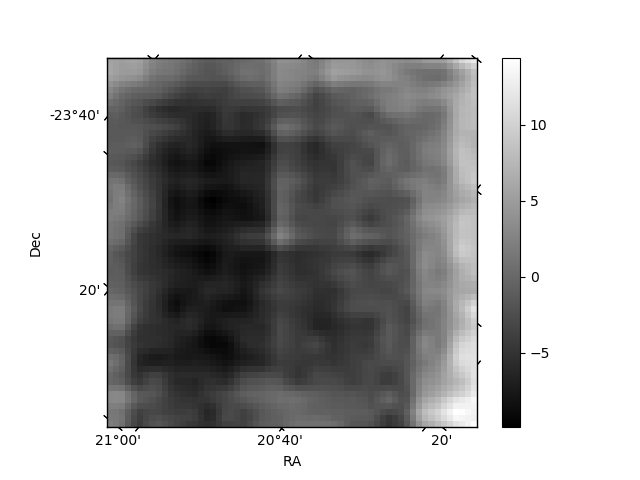
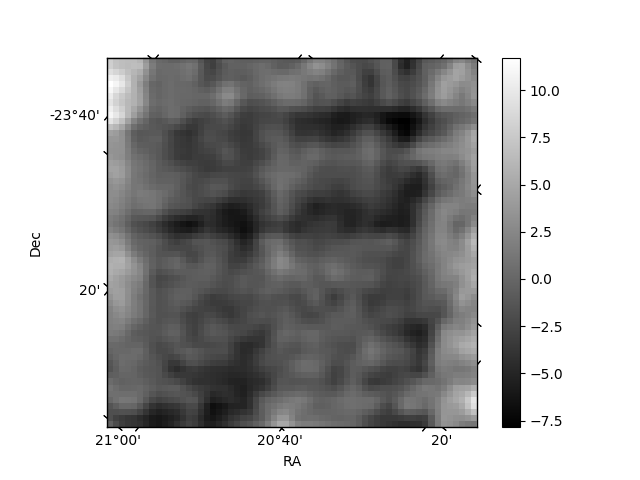
Histogram calculated using DETX and DETY for each event in the final _common_clean file
| Quadrant A | 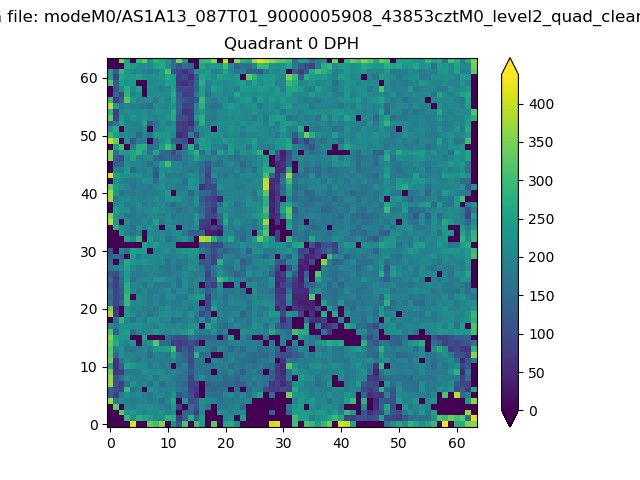 |
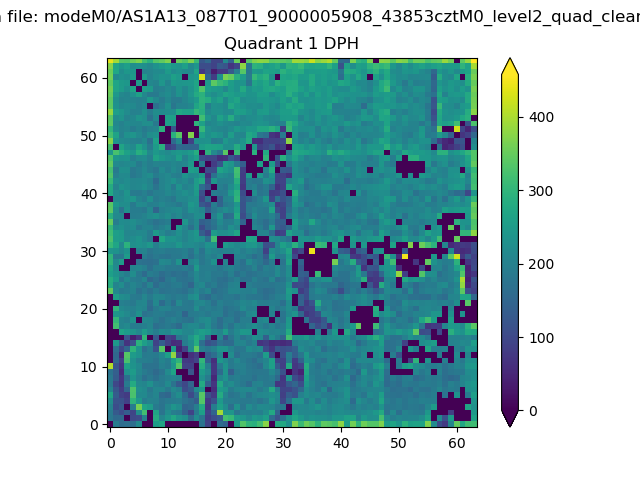 |
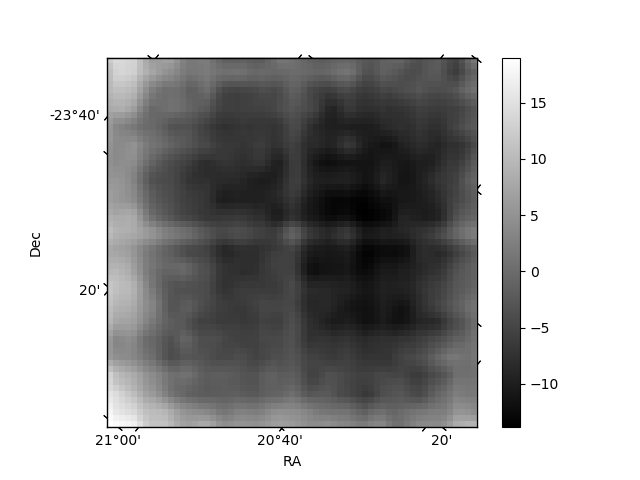
Quadrant B |
|---|---|---|---|
| Quadrant D | 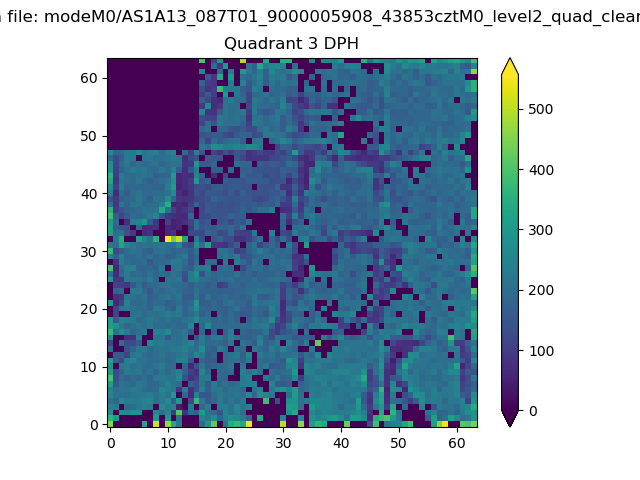 |
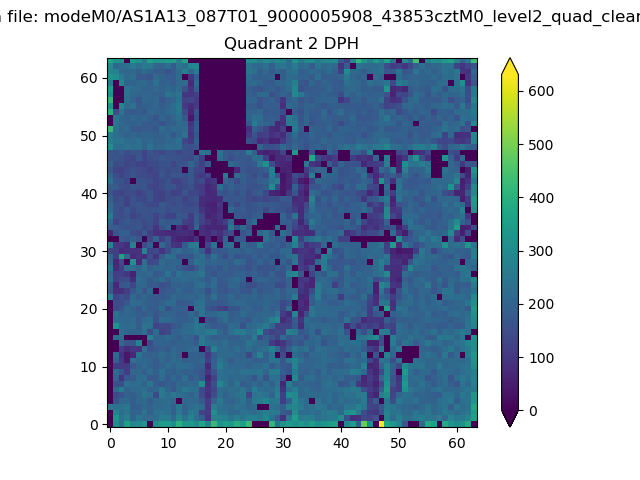 |
Quadrant C |
| Plot type | Count rate plots | Images |
|---|---|---|
| Comparison with Poisson distribution Blue bars denote a histogram of data divided into 1 sec bins. Red curve is a Poisson curve with rate = median count rate of data. |
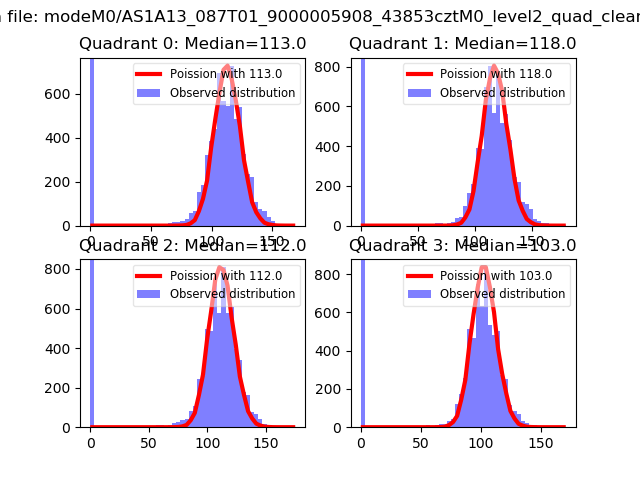 |
 |
| Quadrant-wise count rates Data is divided into 100 sec bins |
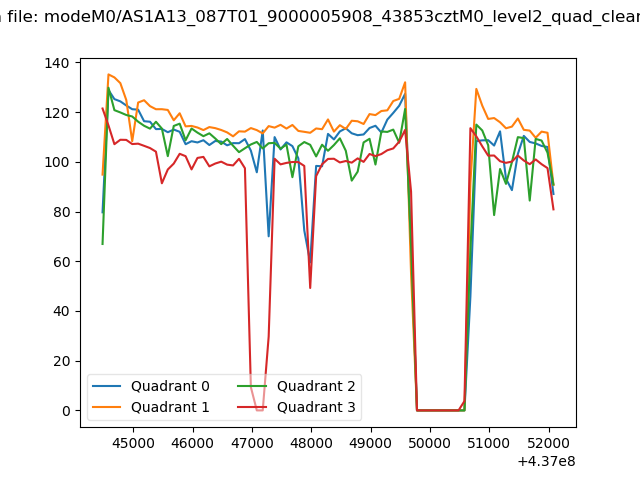 |
|
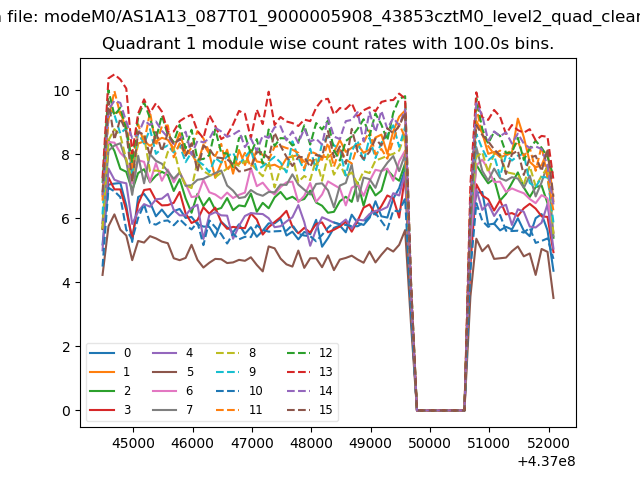
| Module-wise count rates for Quadrant A Data is divided into 100 sec bins |
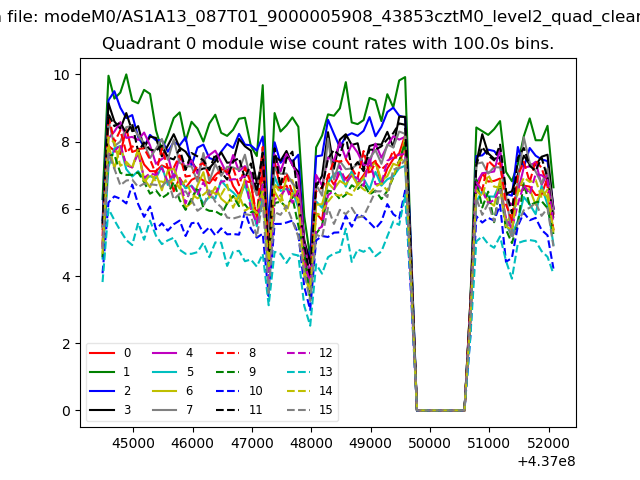 |
 |
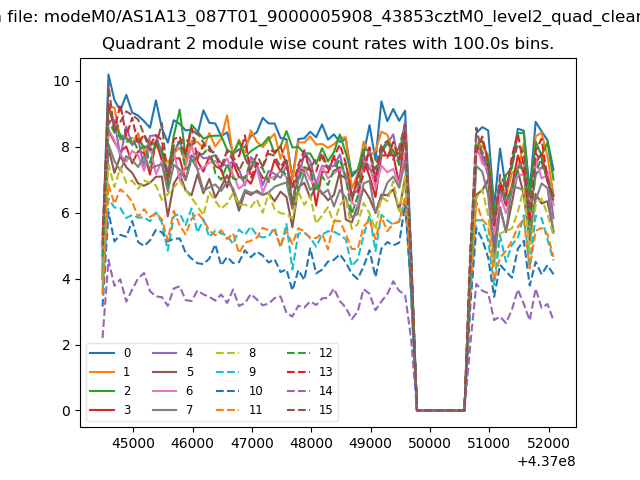
| Module-wise count rates for Quadrant B Data is divided into 100 sec bins |
 |
 |
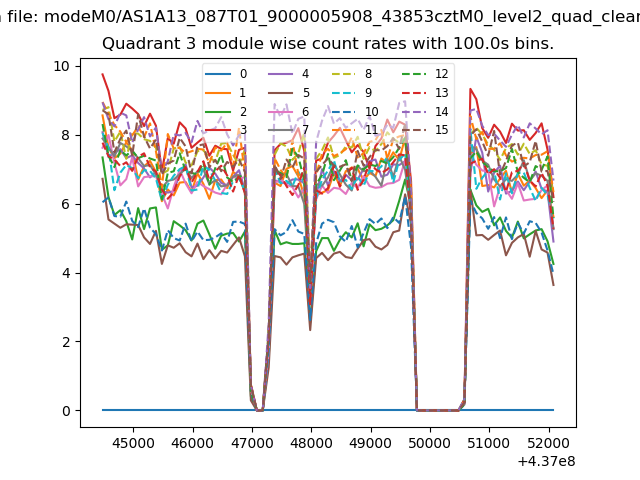
| Module-wise count rates for Quadrant C Data is divided into 100 sec bins |
 |
 |
| Module-wise count rates for Quadrant D Data is divided into 100 sec bins |
 |
 |
| Parameter | Plot |
|---|---|
| CZT HV Monitor | 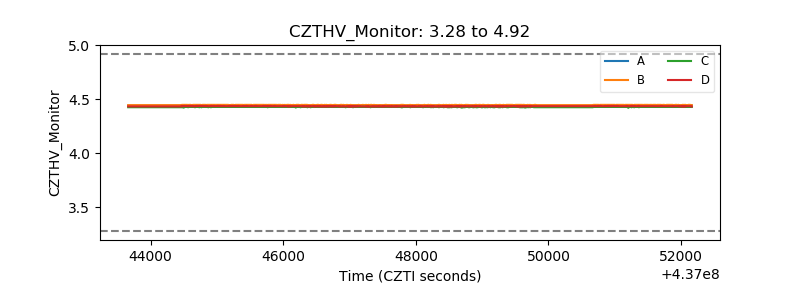 |
| D_VDD | 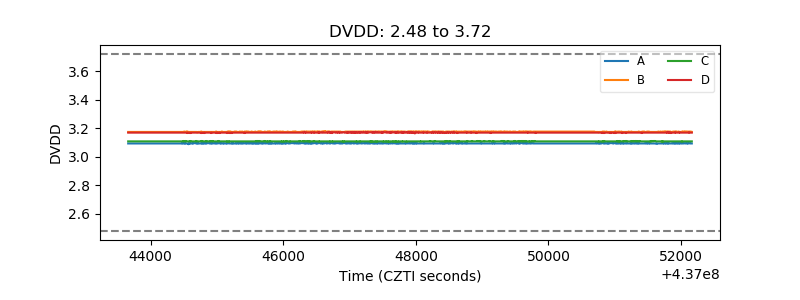 |
| Temperature 1 | 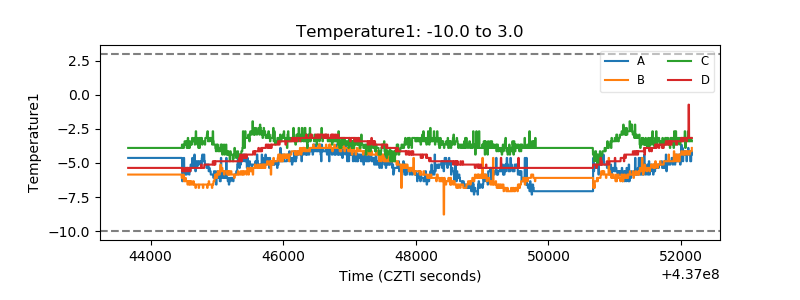 |
| Veto HV Monitor | 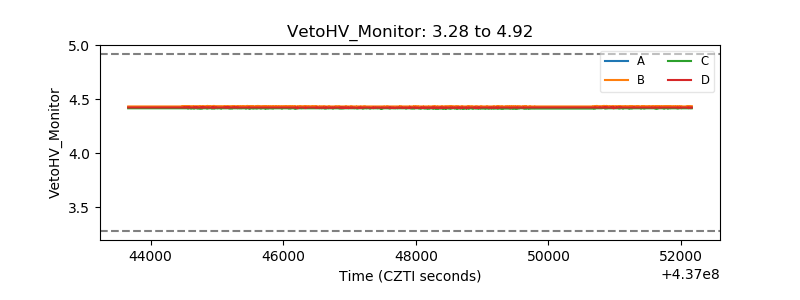 |
| Veto LLD | 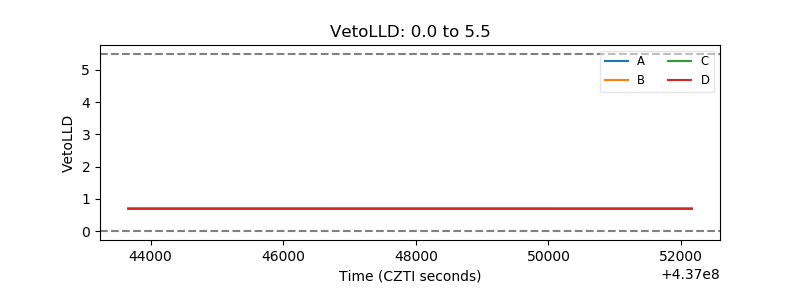 |
| Alpha Counter | 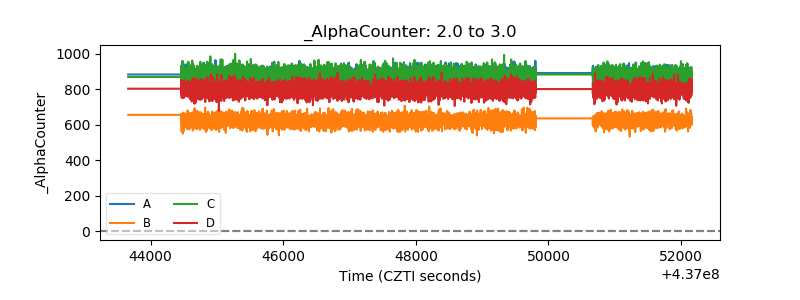 |
| _CPM_Rate | 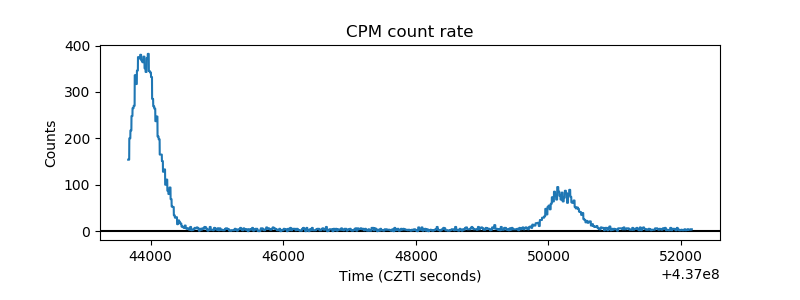 |
| CZT Counter | 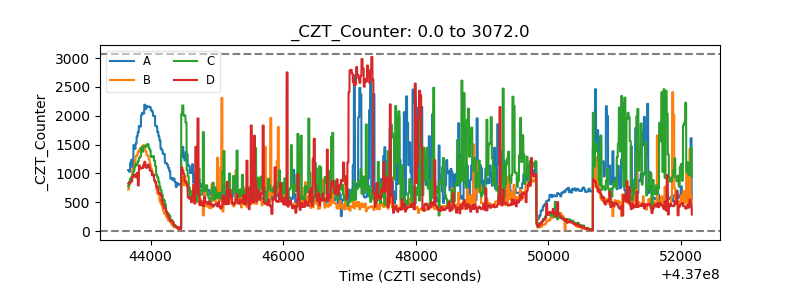 |
| +2.5 Volts monitor | 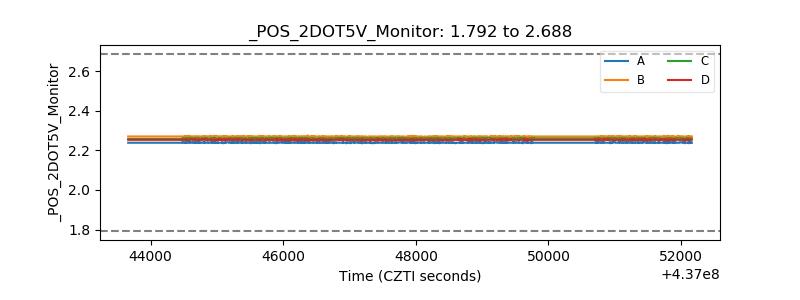 |
| +5 Volts monitor | 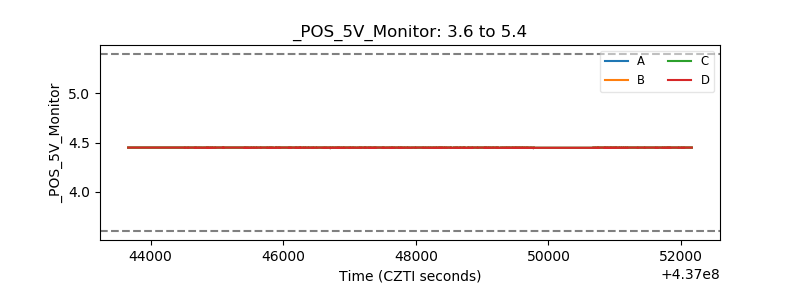 |
| _ROLL_ROT | 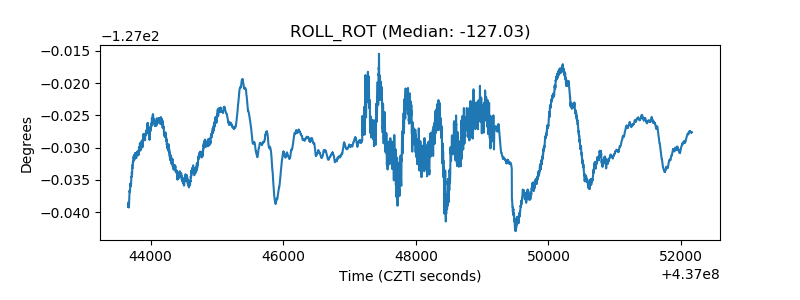 |
| _Roll_DEC | 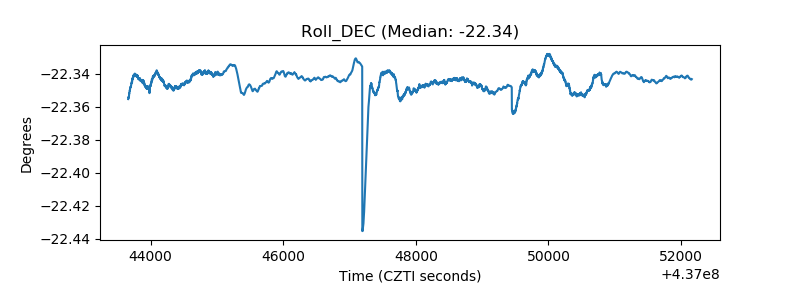 |
| _Roll_RA | 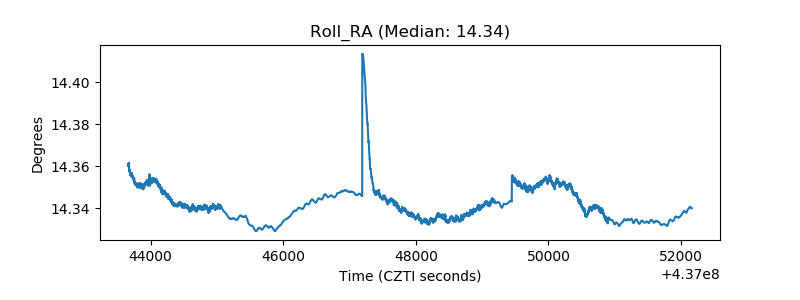 |
| Veto Counter | 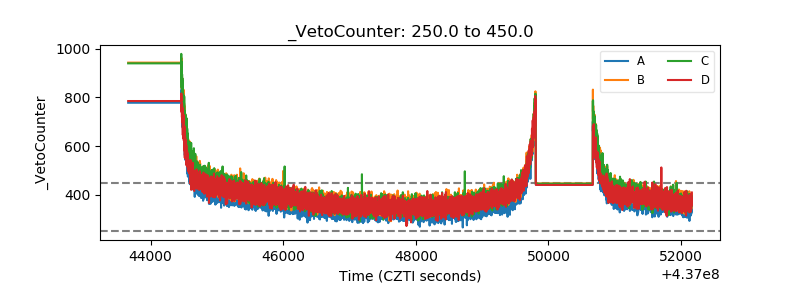 |