| Param | Original file | Final file |
|---|---|---|
| Filename | modeM0/AS1A13_087T01_9000005908_43854cztM0_level2.fits | modeM0/AS1A13_087T01_9000005908_43854cztM0_level2_quad_clean.evt |
| Size (bytes) | 708,586,560 | 114,145,920 |
| Size | 675.8 MB | 108.9 MB |
| Events in quadrant A | 7,613,376 | 708,260 |
| Events in quadrant B | 3,980,088 | 825,348 |
| Events in quadrant C | 10,006,653 | 653,068 |
| Events in quadrant D | 4,040,667 | 741,500 |
| Mode M9 | |||
|---|---|---|---|
| Quadrant | BADHDUFLAG | Total packets | Discarded packets |
| A | 0 | 8 | 0 |
| B | 0 | 9 | 0 |
| C | 0 | 9 | 0 |
| D | 0 | 9 | 0 |
| Mode M0 | |||
|---|---|---|---|
| Quadrant | BADHDUFLAG | Total packets | Discarded packets |
| A | 0 | 27815 | 2 |
| B | 0 | 17050 | 2 |
| C | 0 | 35132 | 4 |
| D | 0 | 17319 | 2 |
| Mode SS | |||
|---|---|---|---|
| Quadrant | BADHDUFLAG | Total packets | Discarded packets |
| A | 0 | 156 | 0 |
| B | 0 | 156 | 0 |
| C | 0 | 156 | 0 |
| D | 0 | 156 | 0 |
| Quadrant | Total seconds | Saturated seconds | Saturation percentage |
|---|---|---|---|
| A | 7594 | 1386 | 18.251251% |
| B | 7594 | 479 | 6.307611% |
| C | 7593 | 1881 | 24.772817% |
| D | 7593 | 303 | 3.990518% |
Noise dominated data is calculated using 1-second bins in cleaned event files. If a bin has >2000 counts, and if more than 50% of those come from <1% of pixels, then it is considered to be noise-dominated and hence unusable.
| Quadrant | # 1 sec bins | Bins with >0 counts | Bins with >2000 counts | High rate bins dominated by noise | Noise dominated (total time) | Noise dominated (detector-on time) | Marked lightcurve |
|---|---|---|---|---|---|---|---|
| A | 7804 | 7594 | 630 | 630 | 8.07% | 8.30% | 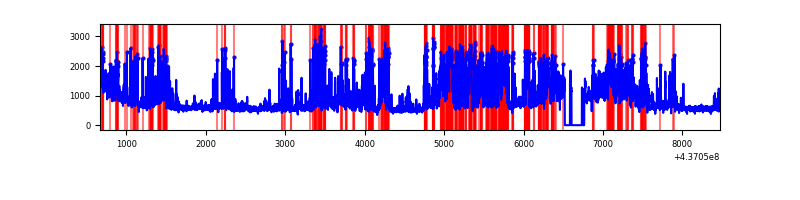 |
| B | 7804 | 7594 | 28 | 28 | 0.36% | 0.37% | 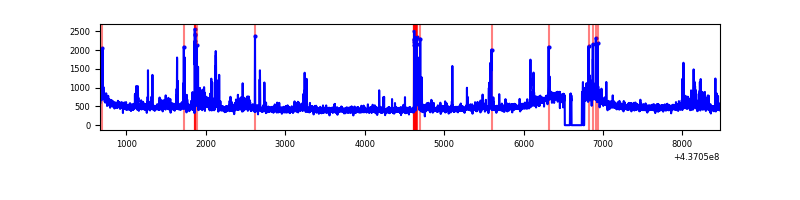 |
| C | 7803 | 7593 | 1156 | 1156 | 14.81% | 15.22% | 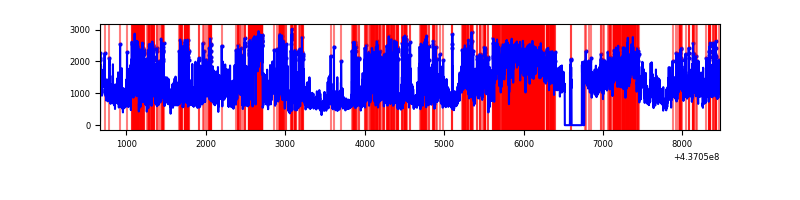 |
| D | 7803 | 7593 | 53 | 53 | 0.68% | 0.70% | 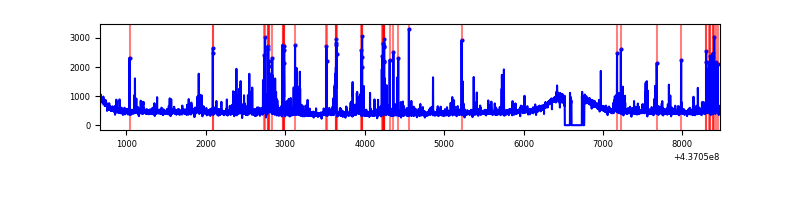 |
Top three noisy pixels from each quadrant. If the there are fewer than three noisy pixels in the level2.evt file, extra rows are filled as -1
| Pixel properties | Quadrant properties | ||||||
|---|---|---|---|---|---|---|---|
| Quadrant | DetID | PixID | Counts | Sigma | Mean | Median | Sigma |
| A | 15 | 223 | 3288169 | 18744.67 | 844 | 825 | 175.4 |
| A | 10 | 83 | 931403 | 5306.22 | 844 | 825 | 175.4 |
| A | 2 | 79 | 46252 | 259.03 | 844 | 825 | 175.4 |
| B | 0 | 200 | 119493 | 660.59 | 895 | 866 | 179.6 |
| B | 4 | 170 | 105206 | 581.03 | 895 | 866 | 179.6 |
| B | 0 | 183 | 96666 | 533.47 | 895 | 866 | 179.6 |
| C | 3 | 233 | 5044728 | 26253.79 | 810 | 814 | 192.1 |
| C | 0 | 239 | 1312859 | 6829.25 | 810 | 814 | 192.1 |
| C | 15 | 174 | 266604 | 1383.45 | 810 | 814 | 192.1 |
| D | 2 | 249 | 140584 | 622.65 | 894 | 864 | 224.4 |
| D | 5 | 235 | 115291 | 509.93 | 894 | 864 | 224.4 |
| D | 1 | 52 | 89462 | 394.83 | 894 | 864 | 224.4 |
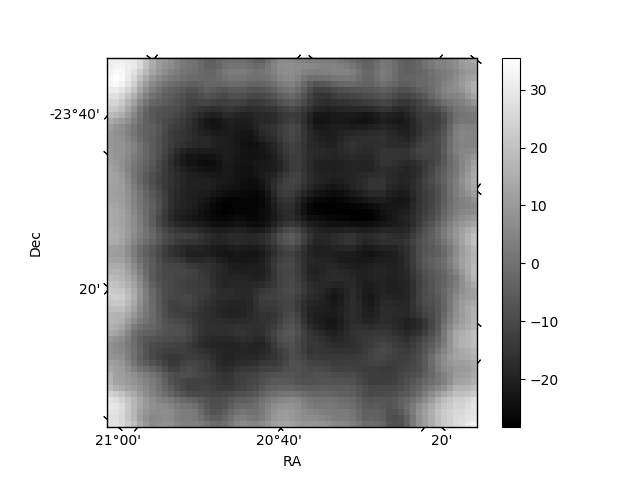
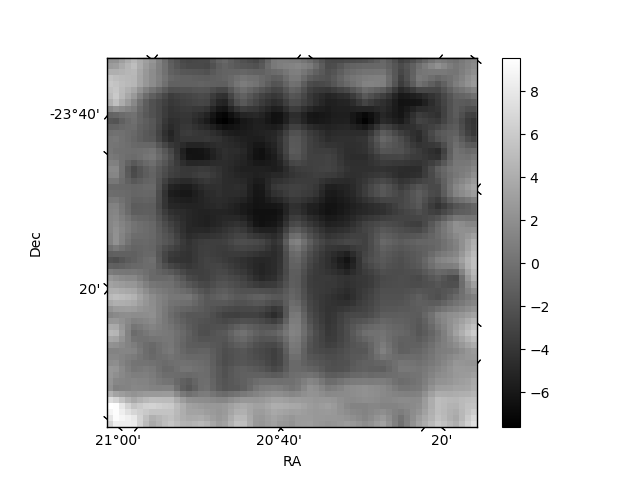
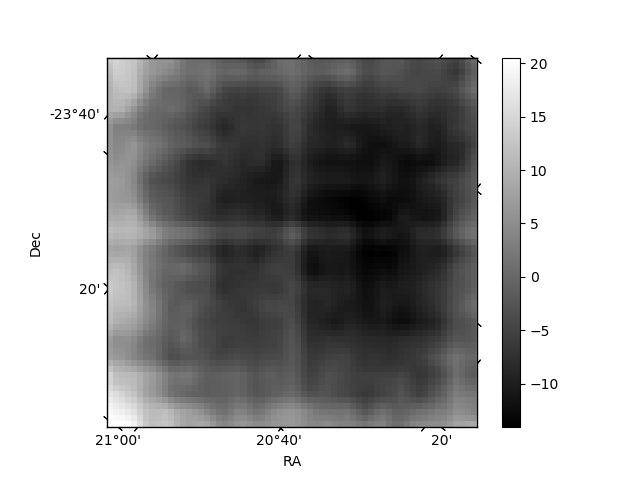
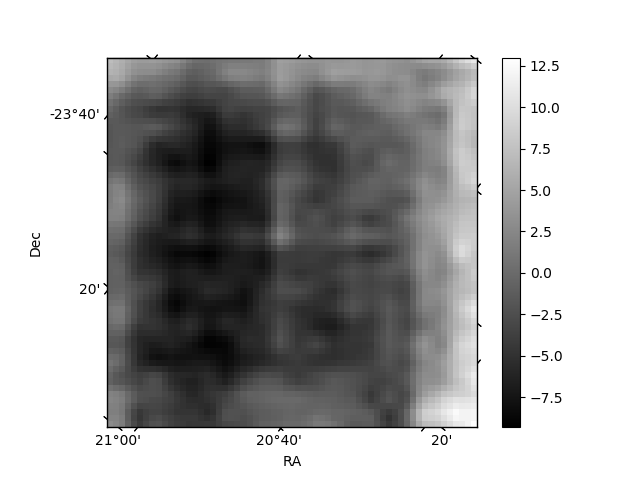
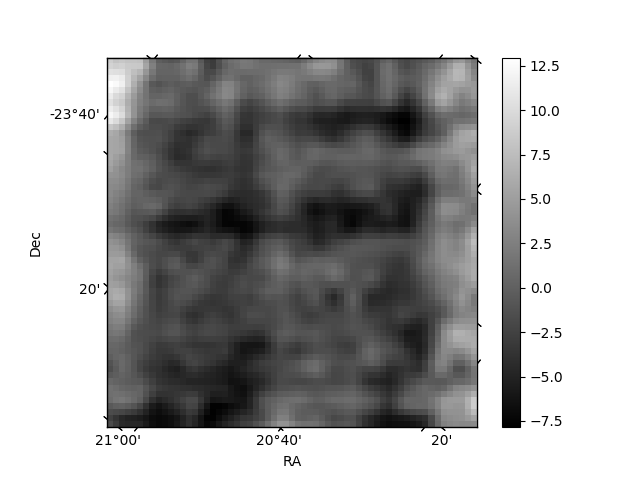
Histogram calculated using DETX and DETY for each event in the final _common_clean file
| Quadrant A | 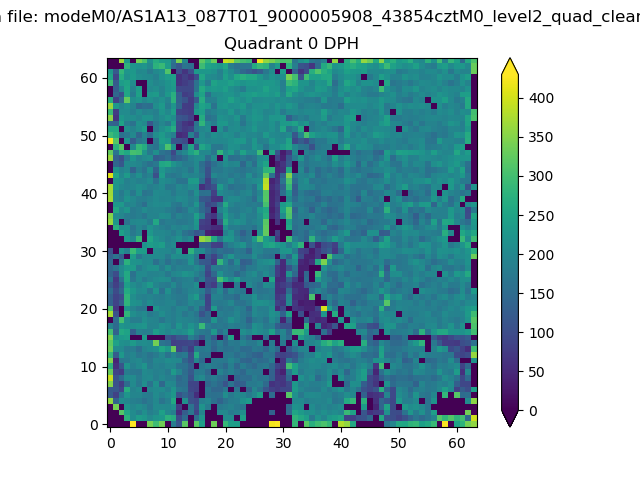 |
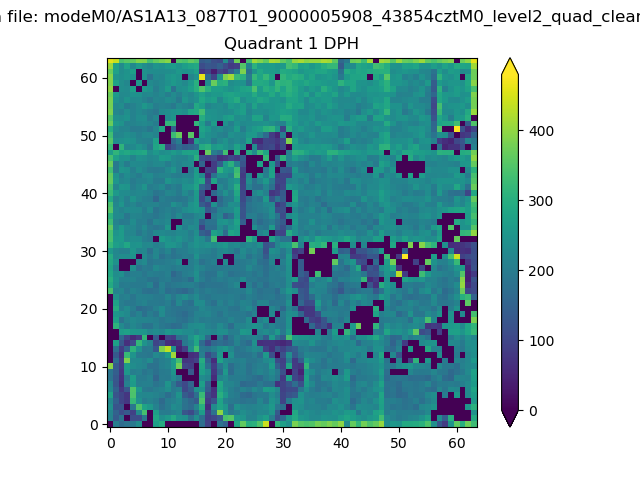 |
Quadrant B |
|---|---|---|---|
| Quadrant D | 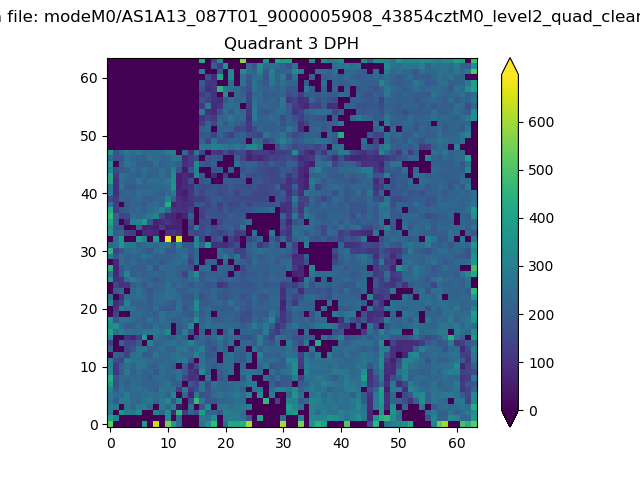 |
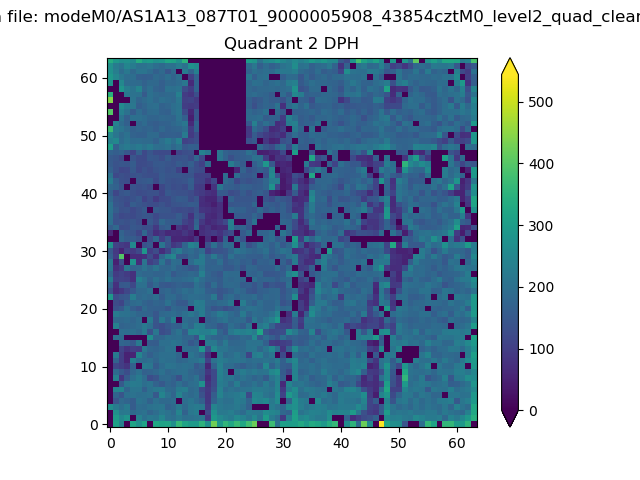 |
Quadrant C |
| Plot type | Count rate plots | Images |
|---|---|---|
| Comparison with Poisson distribution Blue bars denote a histogram of data divided into 1 sec bins. Red curve is a Poisson curve with rate = median count rate of data. |
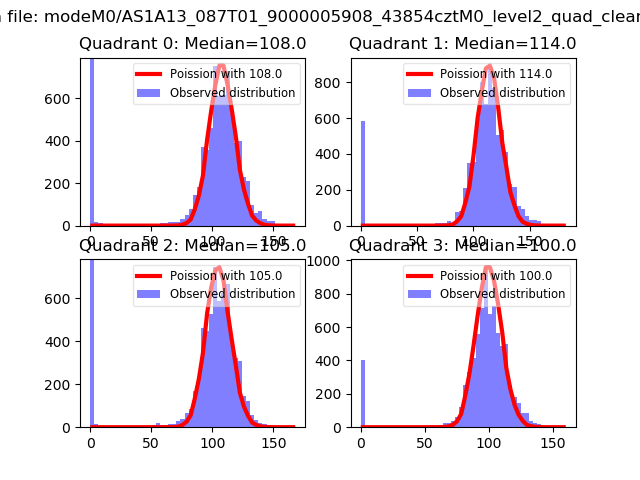 |
 |
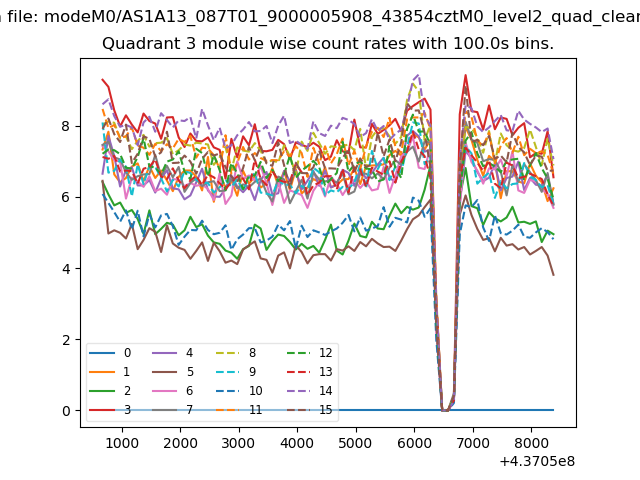
| Quadrant-wise count rates Data is divided into 100 sec bins |
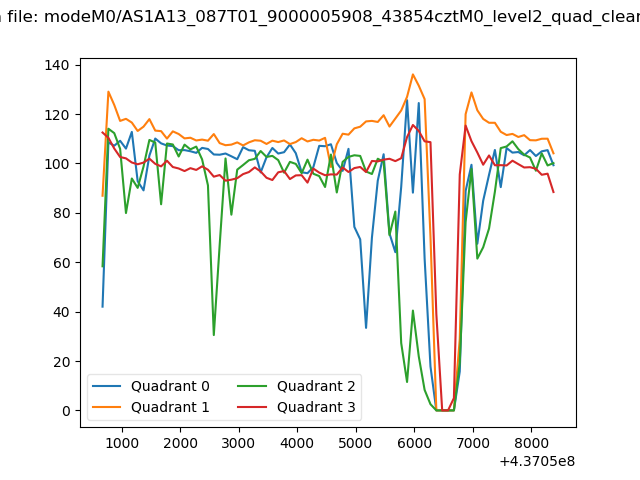 |
|
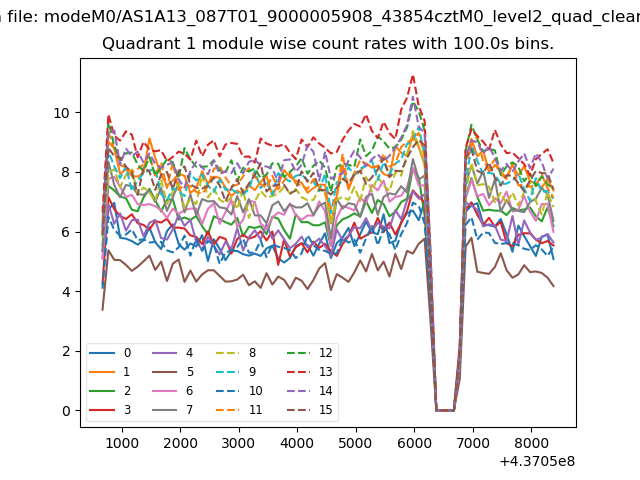
| Module-wise count rates for Quadrant A Data is divided into 100 sec bins |
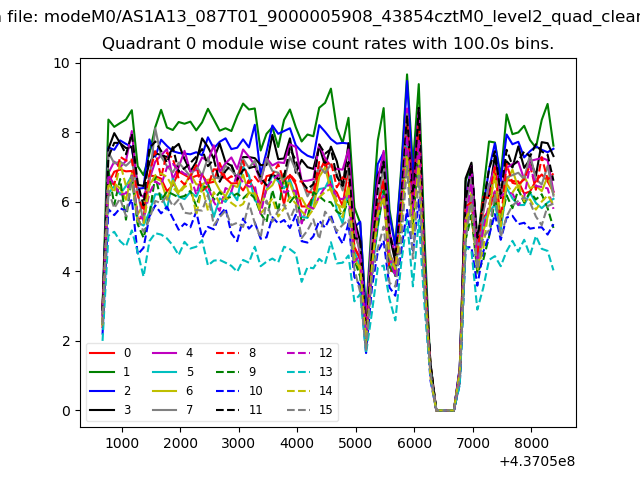 |
 |
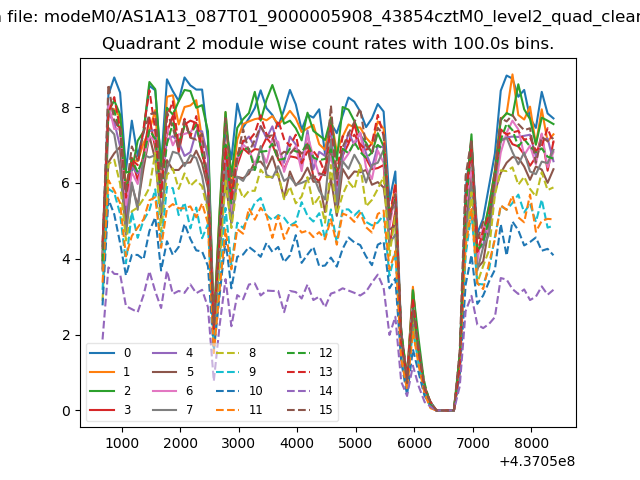
| Module-wise count rates for Quadrant B Data is divided into 100 sec bins |
 |
 |
| Module-wise count rates for Quadrant C Data is divided into 100 sec bins |
 |
 |
| Module-wise count rates for Quadrant D Data is divided into 100 sec bins |
 |
 |
| Parameter | Plot |
|---|---|
| CZT HV Monitor | 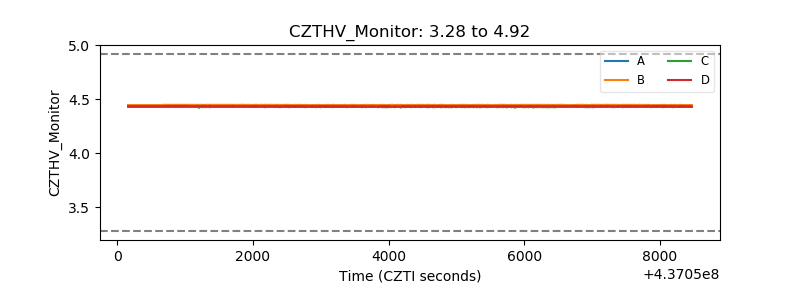 |
| D_VDD | 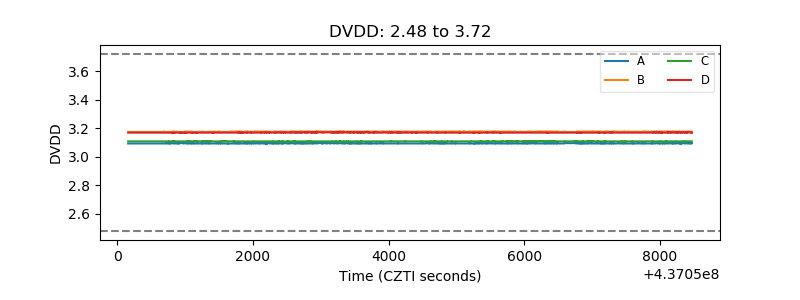 |
| Temperature 1 |  |
| Veto HV Monitor | 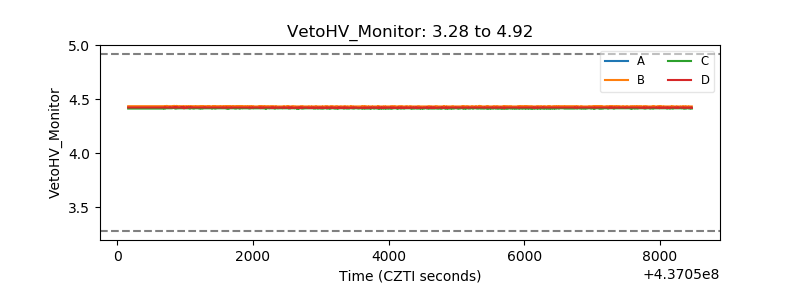 |
| Veto LLD | 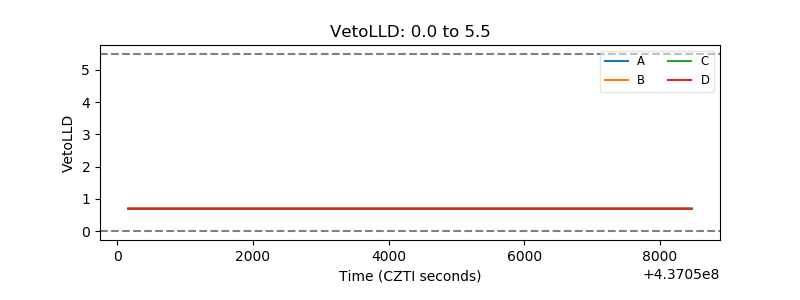 |
| Alpha Counter | 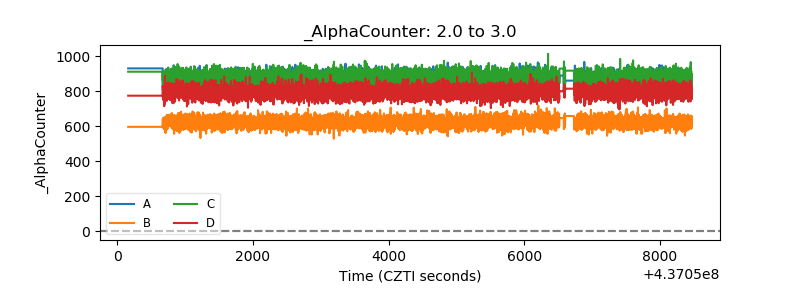 |
| _CPM_Rate | 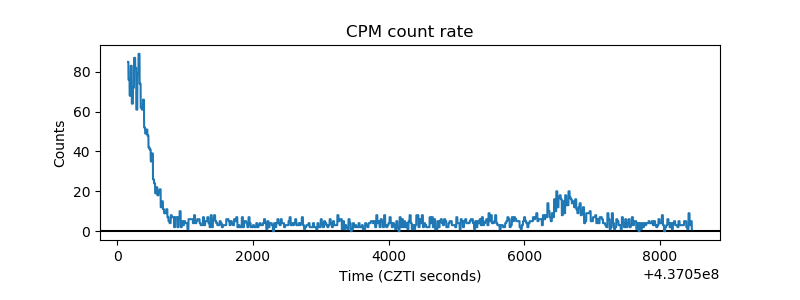 |
| CZT Counter | 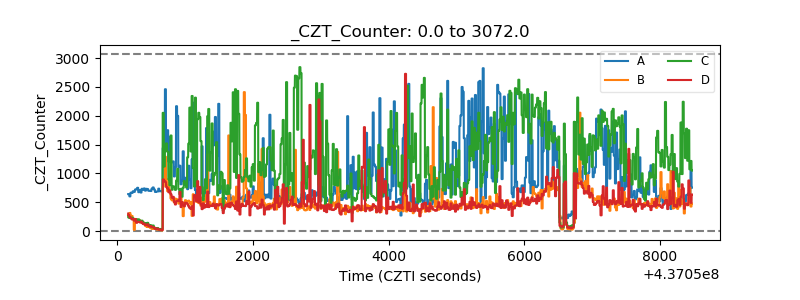 |
| +2.5 Volts monitor | 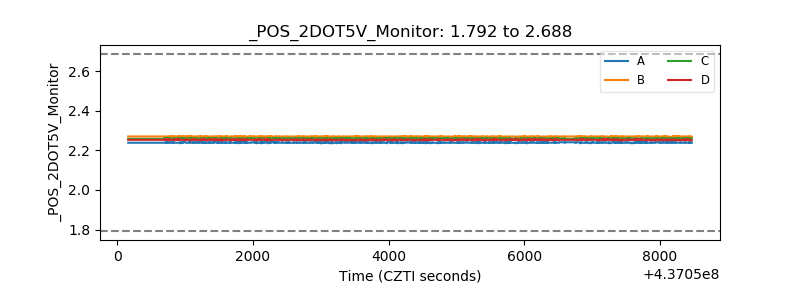 |
| +5 Volts monitor | 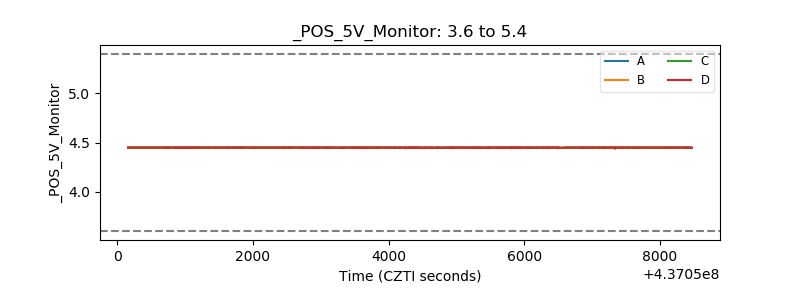 |
| _ROLL_ROT | 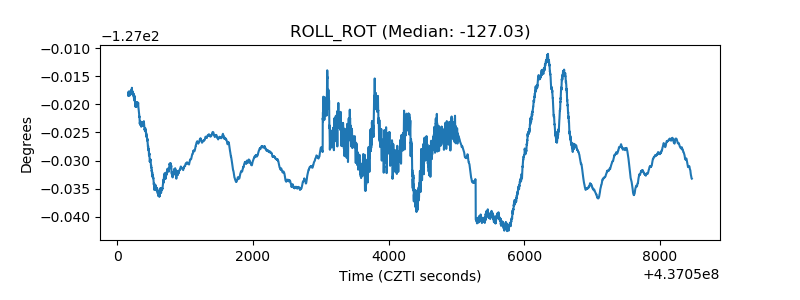 |
| _Roll_DEC | 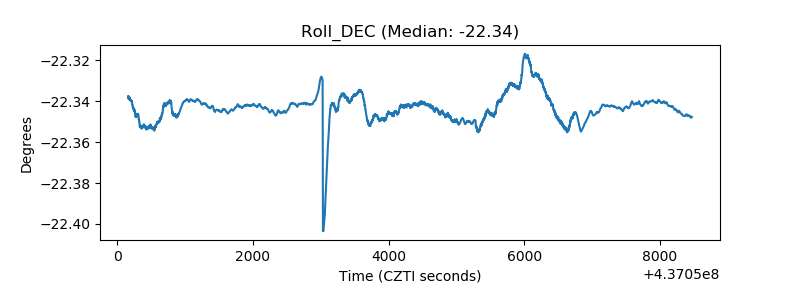 |
| _Roll_RA | 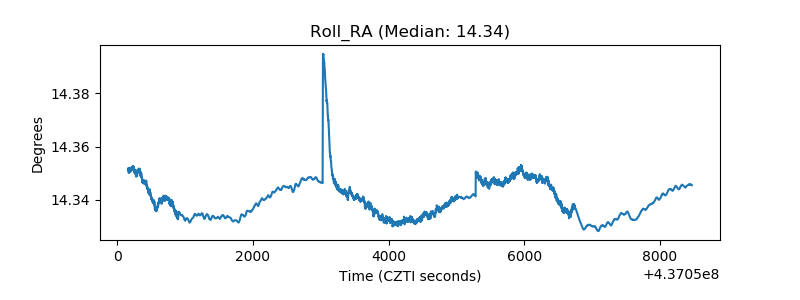 |
| Veto Counter | 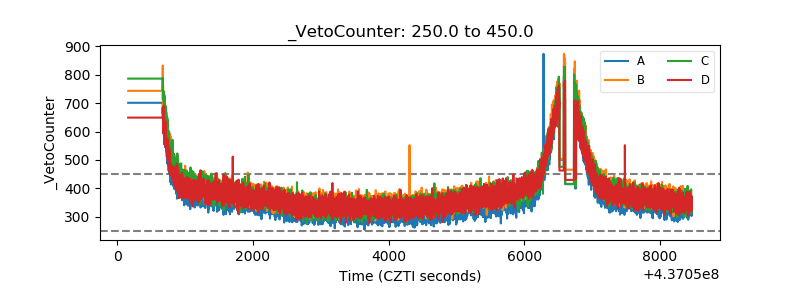 |