| Param | Original file | Final file |
|---|---|---|
| Filename | modeM0/AS1A13_087T01_9000005908_43855cztM0_level2.fits | modeM0/AS1A13_087T01_9000005908_43855cztM0_level2_quad_clean.evt |
| Size (bytes) | 823,962,240 | 120,784,320 |
| Size | 785.8 MB | 115.2 MB |
| Events in quadrant A | 9,313,799 | 689,816 |
| Events in quadrant B | 4,276,046 | 898,866 |
| Events in quadrant C | 9,978,545 | 768,212 |
| Events in quadrant D | 6,299,451 | 732,223 |
| Mode M9 | |||
|---|---|---|---|
| Quadrant | BADHDUFLAG | Total packets | Discarded packets |
| A | 0 | 3 | 0 |
| B | 0 | 3 | 0 |
| C | 0 | 3 | 0 |
| D | 0 | 3 | 0 |
| Mode M0 | |||
|---|---|---|---|
| Quadrant | BADHDUFLAG | Total packets | Discarded packets |
| A | 0 | 33288 | 1 |
| B | 0 | 18274 | 1 |
| C | 0 | 35455 | 1 |
| D | 0 | 24456 | 5 |
| Mode SS | |||
|---|---|---|---|
| Quadrant | BADHDUFLAG | Total packets | Discarded packets |
| A | 0 | 168 | 0 |
| B | 0 | 168 | 0 |
| C | 0 | 168 | 0 |
| D | 0 | 168 | 0 |
| Quadrant | Total seconds | Saturated seconds | Saturation percentage |
|---|---|---|---|
| A | 8175 | 2102 | 25.712538% |
| B | 8175 | 312 | 3.816514% |
| C | 8176 | 1373 | 16.793053% |
| D | 8175 | 899 | 10.996942% |
Noise dominated data is calculated using 1-second bins in cleaned event files. If a bin has >2000 counts, and if more than 50% of those come from <1% of pixels, then it is considered to be noise-dominated and hence unusable.
| Quadrant | # 1 sec bins | Bins with >0 counts | Bins with >2000 counts | High rate bins dominated by noise | Noise dominated (total time) | Noise dominated (detector-on time) | Marked lightcurve |
|---|---|---|---|---|---|---|---|
| A | 8385 | 8175 | 1244 | 1244 | 14.84% | 15.22% | 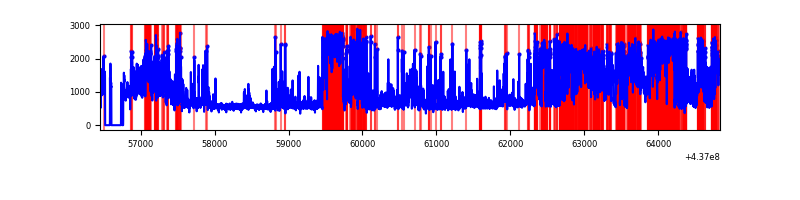 |
| B | 8385 | 8175 | 36 | 36 | 0.43% | 0.44% | 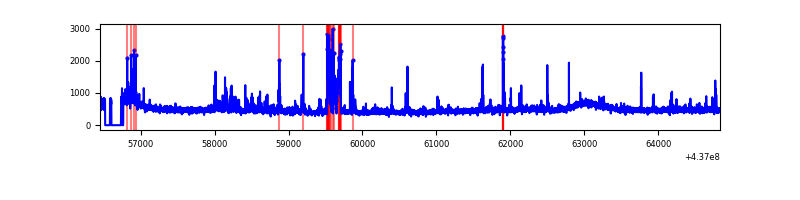 |
| C | 8385 | 8175 | 870 | 870 | 10.38% | 10.64% | 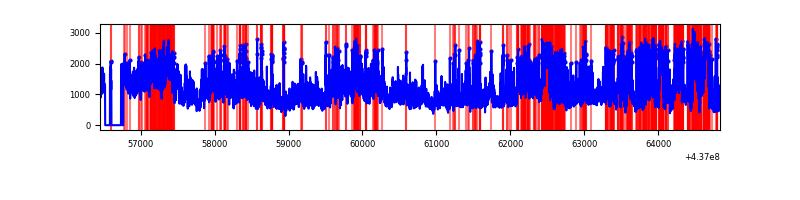 |
| D | 8384 | 8174 | 764 | 764 | 9.11% | 9.35% | 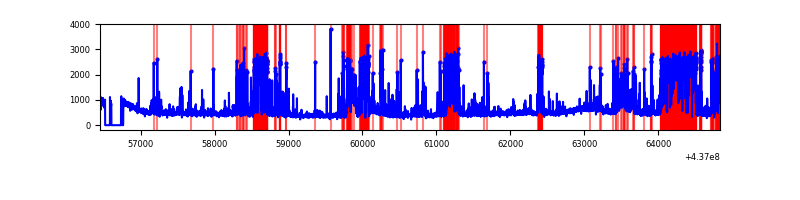 |
Top three noisy pixels from each quadrant. If the there are fewer than three noisy pixels in the level2.evt file, extra rows are filled as -1
| Pixel properties | Quadrant properties | ||||||
|---|---|---|---|---|---|---|---|
| Quadrant | DetID | PixID | Counts | Sigma | Mean | Median | Sigma |
| A | 15 | 223 | 5087875 | 28975.98 | 855 | 836 | 175.6 |
| A | 10 | 83 | 863087 | 4911.42 | 855 | 836 | 175.6 |
| A | 2 | 79 | 20751 | 113.44 | 855 | 836 | 175.6 |
| B | 5 | 235 | 245375 | 1298.8 | 949 | 918 | 188.2 |
| B | 0 | 183 | 63656 | 333.33 | 949 | 918 | 188.2 |
| B | 4 | 170 | 55987 | 292.58 | 949 | 918 | 188.2 |
| C | 3 | 233 | 5534822 | 26398.0 | 885 | 888 | 209.6 |
| C | 15 | 158 | 357881 | 1702.93 | 885 | 888 | 209.6 |
| C | 0 | 239 | 248581 | 1181.55 | 885 | 888 | 209.6 |
| D | 2 | 249 | 1556502 | 6811.89 | 907 | 877 | 228.4 |
| D | 1 | 52 | 433133 | 1892.8 | 907 | 877 | 228.4 |
| D | 5 | 235 | 325441 | 1421.23 | 907 | 877 | 228.4 |
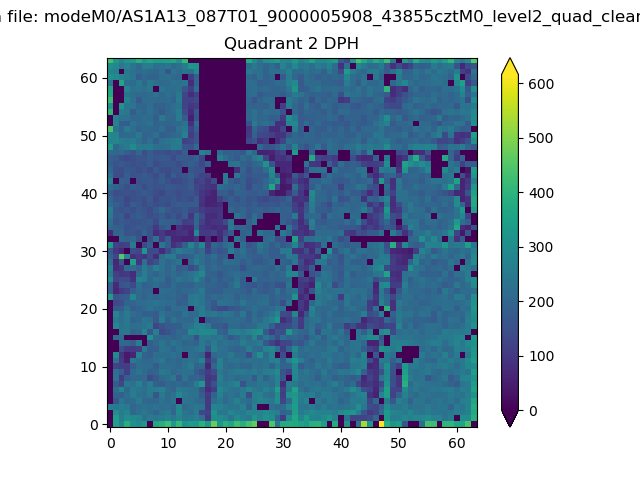
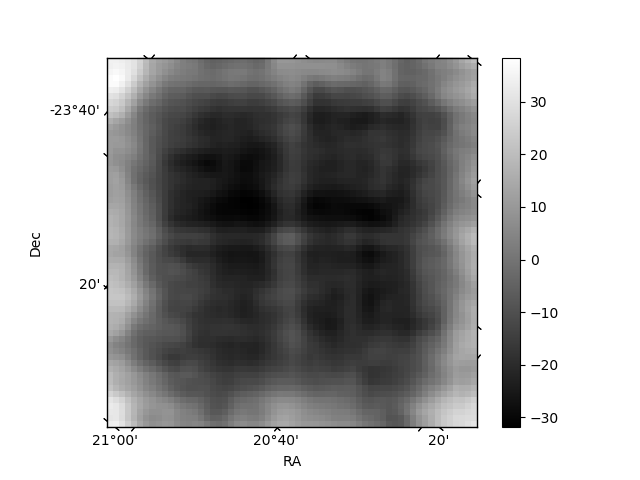
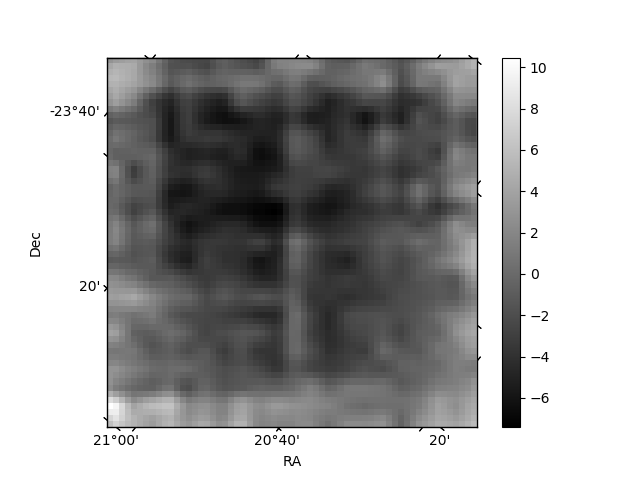
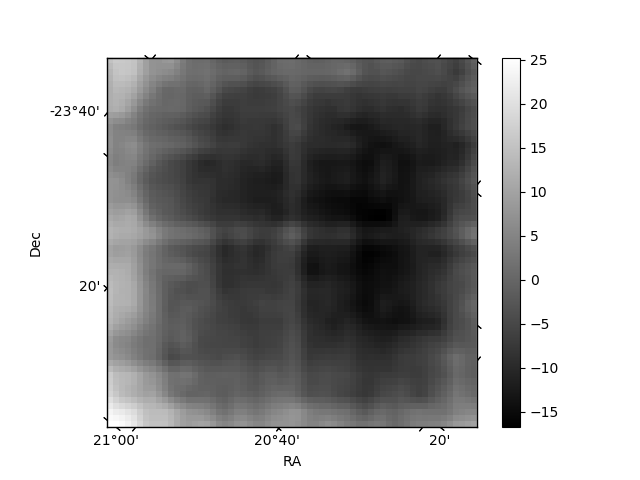
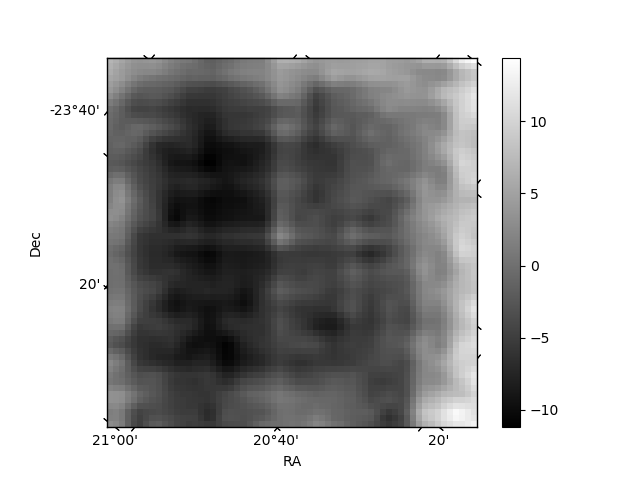
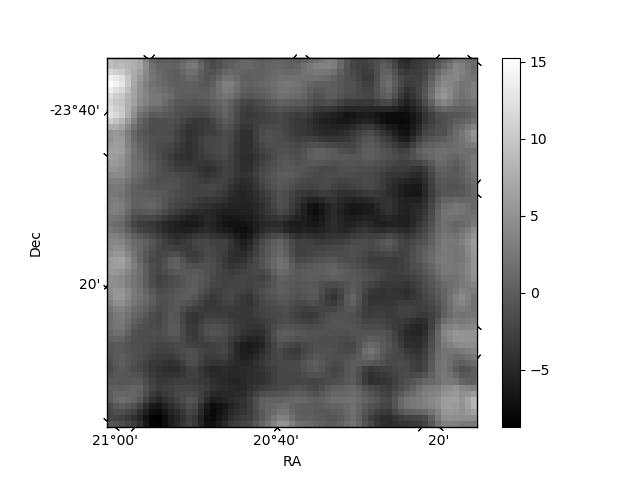
Histogram calculated using DETX and DETY for each event in the final _common_clean file
| Quadrant A | 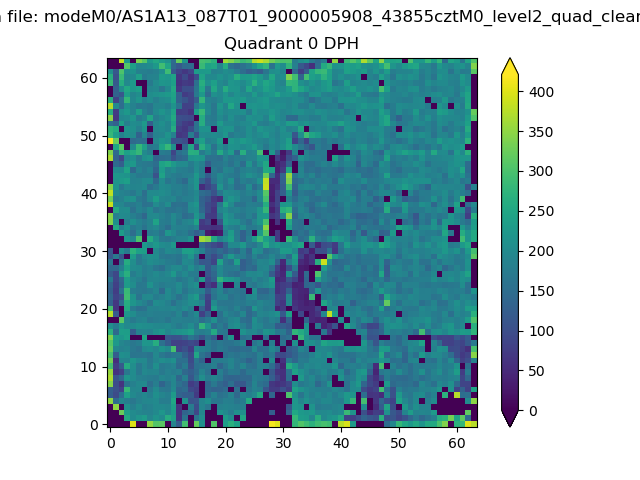 |
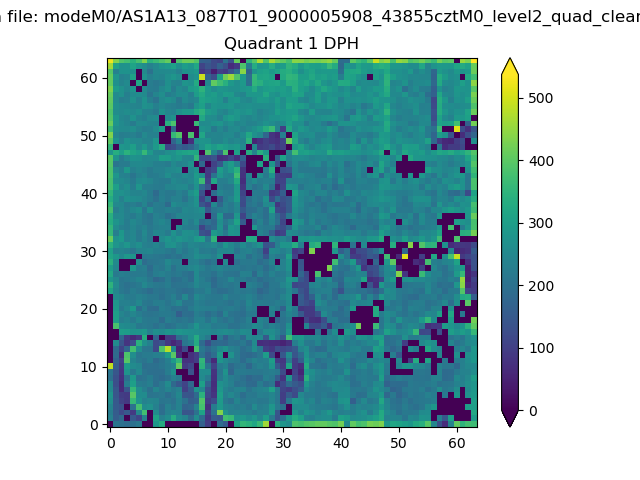 |
Quadrant B |
|---|---|---|---|
| Quadrant D | 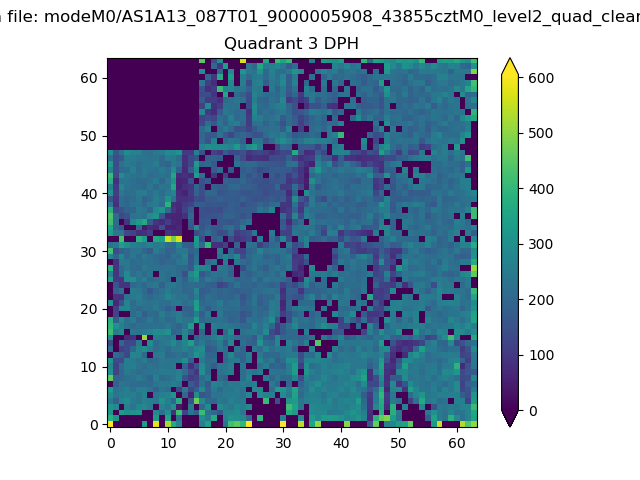 |
 |
Quadrant C |
| Plot type | Count rate plots | Images |
|---|---|---|
| Comparison with Poisson distribution Blue bars denote a histogram of data divided into 1 sec bins. Red curve is a Poisson curve with rate = median count rate of data. |
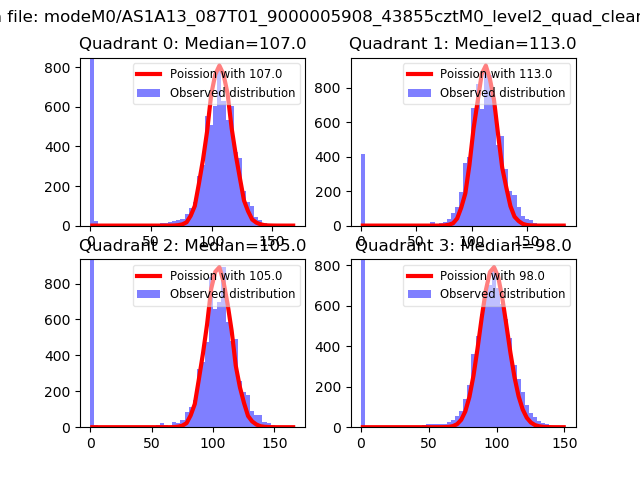 |
 |
| Quadrant-wise count rates Data is divided into 100 sec bins |
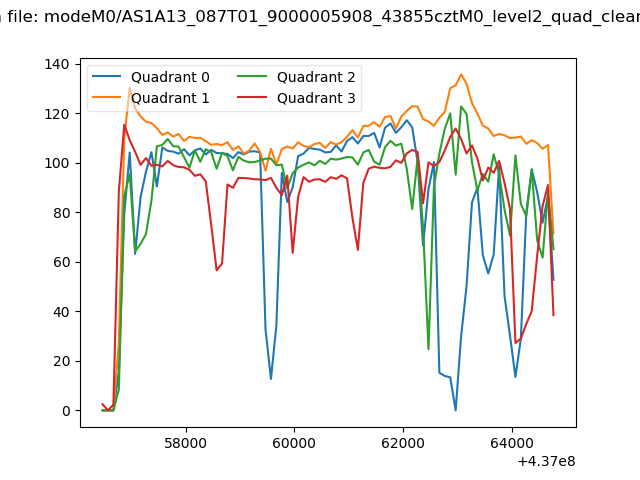 |
|
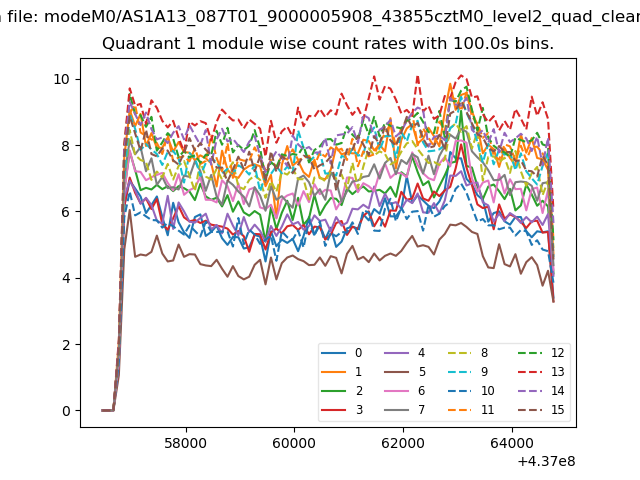
| Module-wise count rates for Quadrant A Data is divided into 100 sec bins |
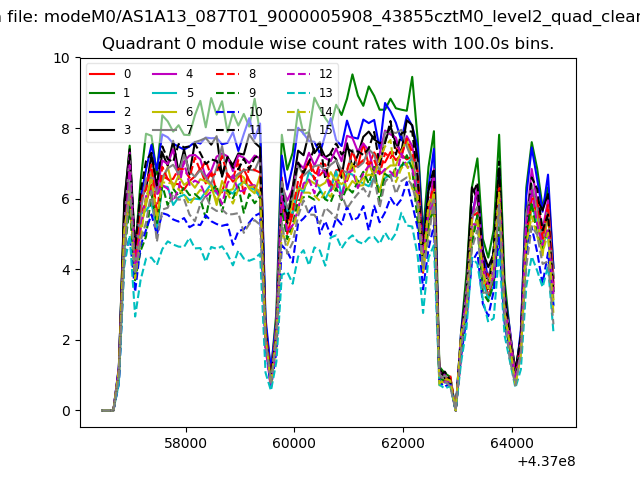 |
 |
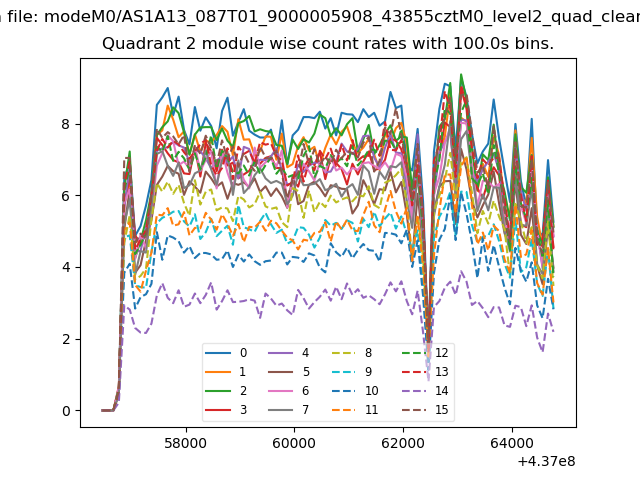
| Module-wise count rates for Quadrant B Data is divided into 100 sec bins |
 |
 |
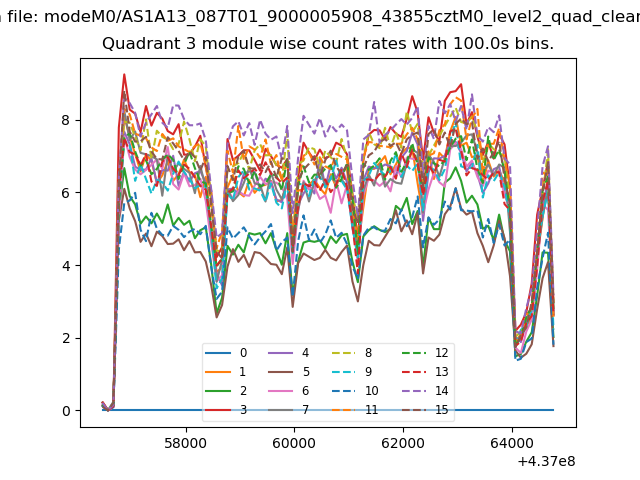
| Module-wise count rates for Quadrant C Data is divided into 100 sec bins |
 |
 |
| Module-wise count rates for Quadrant D Data is divided into 100 sec bins |
 |
 |
| Parameter | Plot |
|---|---|
| CZT HV Monitor | 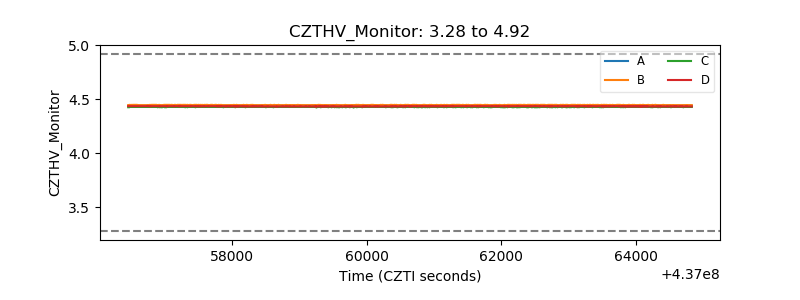 |
| D_VDD | 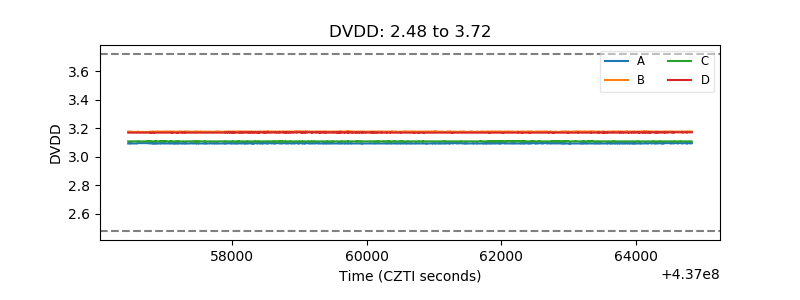 |
| Temperature 1 | 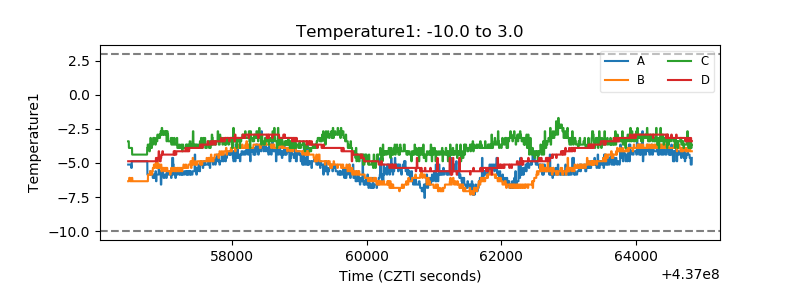 |
| Veto HV Monitor | 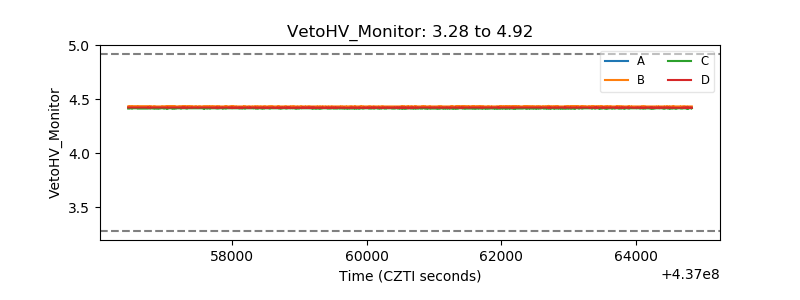 |
| Veto LLD | 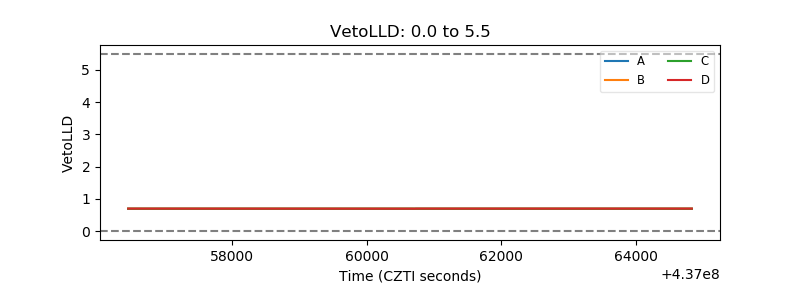 |
| Alpha Counter | 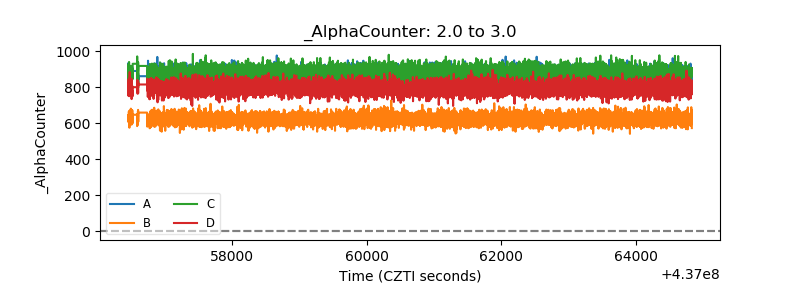 |
| _CPM_Rate | 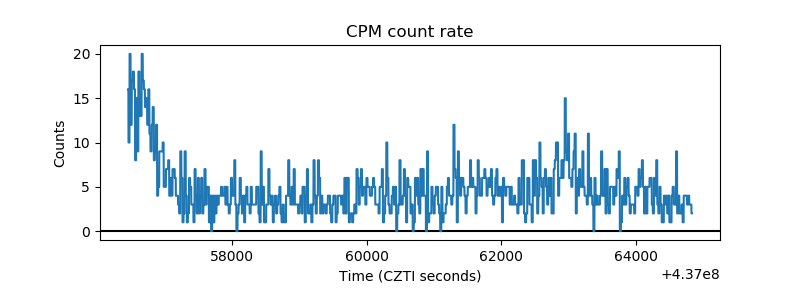 |
| CZT Counter | 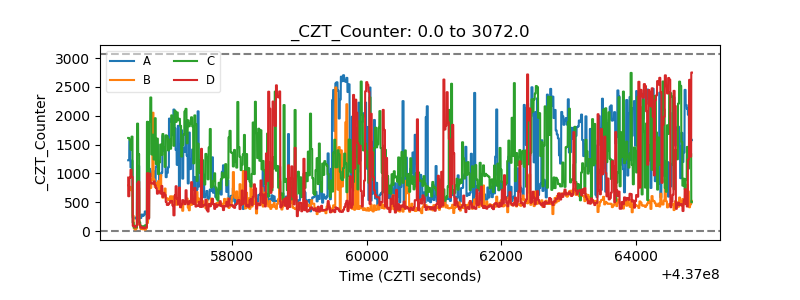 |
| +2.5 Volts monitor | 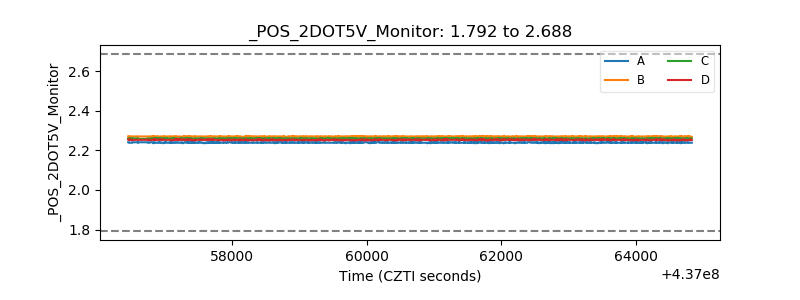 |
| +5 Volts monitor | 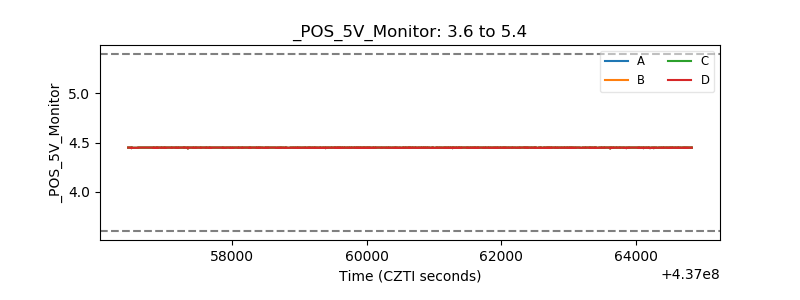 |
| _ROLL_ROT | 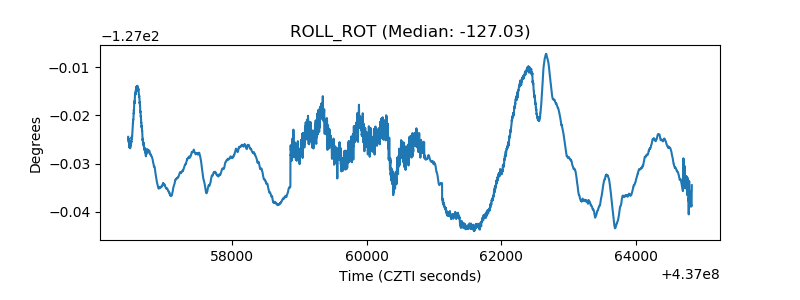 |
| _Roll_DEC | 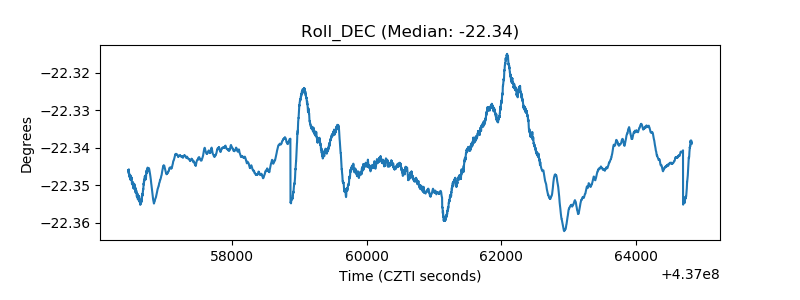 |
| _Roll_RA | 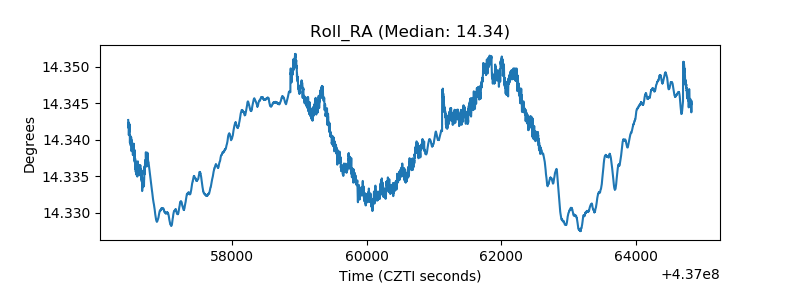 |
| Veto Counter | 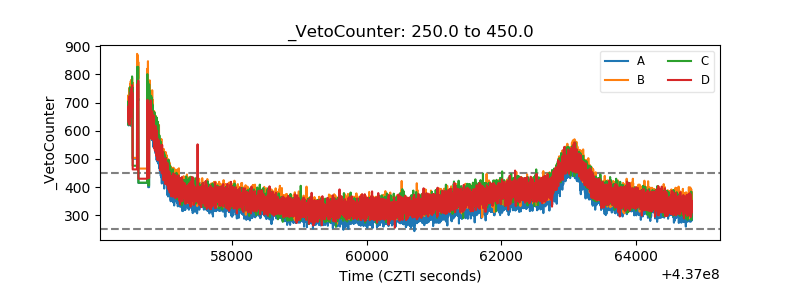 |