| Param | Original file | Final file |
|---|---|---|
| Filename | modeM0/AS1A13_087T01_9000005908_43859cztM0_level2.fits | modeM0/AS1A13_087T01_9000005908_43859cztM0_level2_quad_clean.evt |
| Size (bytes) | 1,603,419,840 | 295,876,800 |
| Size | 1.5 GB | 282.2 MB |
| Events in quadrant A | 11,264,631 | 2,044,792 |
| Events in quadrant B | 11,751,708 | 2,034,130 |
| Events in quadrant C | 21,054,104 | 1,841,332 |
| Events in quadrant D | 13,791,432 | 1,705,821 |
| Mode M9 | |||
|---|---|---|---|
| Quadrant | BADHDUFLAG | Total packets | Discarded packets |
| A | 0 | 11 | 0 |
| B | 0 | 11 | 0 |
| C | 0 | 11 | 0 |
| D | 0 | 11 | 0 |
| Mode M0 | |||
|---|---|---|---|
| Quadrant | BADHDUFLAG | Total packets | Discarded packets |
| A | 0 | 45485 | 6 |
| B | 0 | 48259 | 4 |
| C | 0 | 76251 | 30 |
| D | 0 | 54654 | 4 |
| Mode SS | |||
|---|---|---|---|
| Quadrant | BADHDUFLAG | Total packets | Discarded packets |
| A | 0 | 392 | 0 |
| B | 0 | 392 | 0 |
| C | 0 | 392 | 0 |
| D | 0 | 392 | 0 |
| Quadrant | Total seconds | Saturated seconds | Saturation percentage |
|---|---|---|---|
| A | 19326 | 176 | 0.910690% |
| B | 19328 | 951 | 4.920323% |
| C | 19323 | 2156 | 11.157688% |
| D | 19328 | 1298 | 6.715646% |
Noise dominated data is calculated using 1-second bins in cleaned event files. If a bin has >2000 counts, and if more than 50% of those come from <1% of pixels, then it is considered to be noise-dominated and hence unusable.
| Quadrant | # 1 sec bins | Bins with >0 counts | Bins with >2000 counts | High rate bins dominated by noise | Noise dominated (total time) | Noise dominated (detector-on time) | Marked lightcurve |
|---|---|---|---|---|---|---|---|
| A | 20482 | 19331 | 21 | 21 | 0.10% | 0.11% | 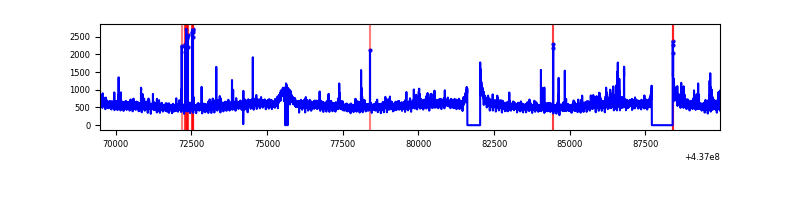 |
| B | 20483 | 19329 | 466 | 466 | 2.28% | 2.41% | 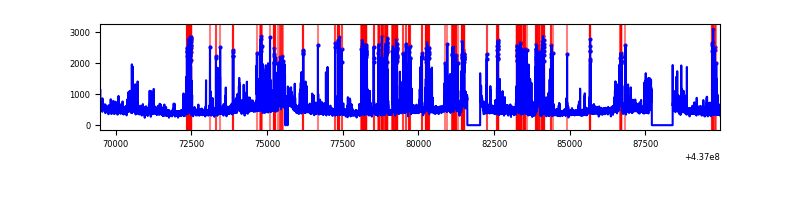 |
| C | 20482 | 19329 | 1934 | 1934 | 9.44% | 10.01% | 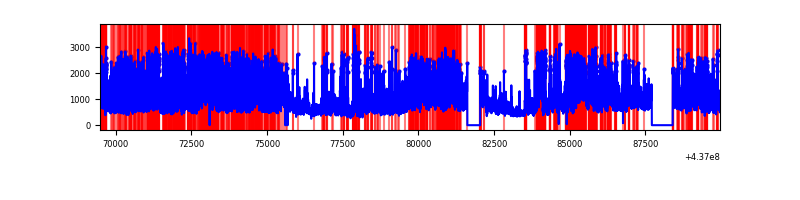 |
| D | 20483 | 19332 | 1250 | 1250 | 6.10% | 6.47% | 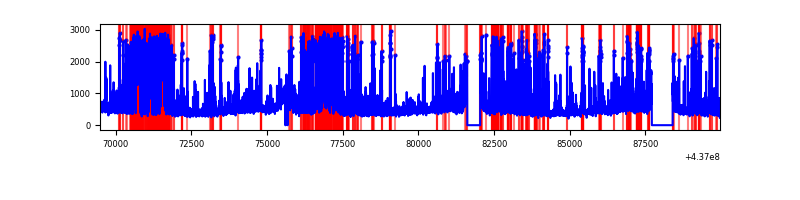 |
Top three noisy pixels from each quadrant. If the there are fewer than three noisy pixels in the level2.evt file, extra rows are filled as -1
| Pixel properties | Quadrant properties | ||||||
|---|---|---|---|---|---|---|---|
| Quadrant | DetID | PixID | Counts | Sigma | Mean | Median | Sigma |
| A | 10 | 83 | 2453975 | 5450.1 | 2176 | 2135 | 449.9 |
| A | 2 | 79 | 114500 | 249.77 | 2176 | 2135 | 449.9 |
| A | 15 | 223 | 87578 | 189.93 | 2176 | 2135 | 449.9 |
| B | 5 | 172 | 1452270 | 3452.95 | 2133 | 2065 | 420.0 |
| B | 5 | 235 | 1271784 | 3023.21 | 2133 | 2065 | 420.0 |
| B | 4 | 170 | 270142 | 638.29 | 2133 | 2065 | 420.0 |
| C | 3 | 233 | 6959036 | 14323.55 | 2049 | 2056 | 485.7 |
| C | 0 | 239 | 3146374 | 6473.76 | 2049 | 2056 | 485.7 |
| C | 15 | 158 | 2336575 | 4806.48 | 2049 | 2056 | 485.7 |
| D | 2 | 249 | 3284820 | 6262.8 | 2066 | 2002 | 524.2 |
| D | 1 | 52 | 571951 | 1087.32 | 2066 | 2002 | 524.2 |
| D | 13 | 249 | 545941 | 1037.7 | 2066 | 2002 | 524.2 |
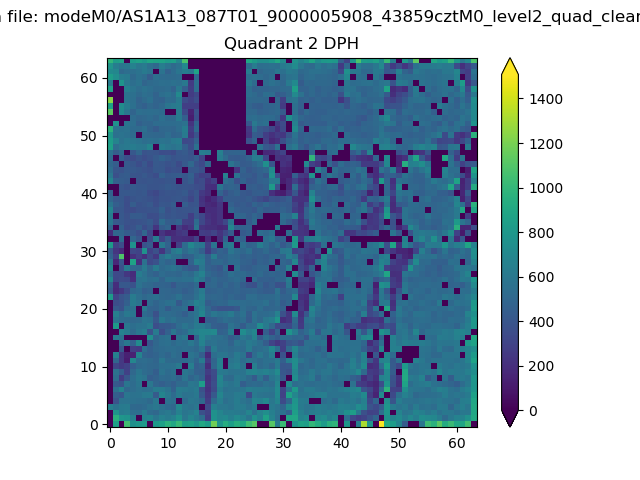
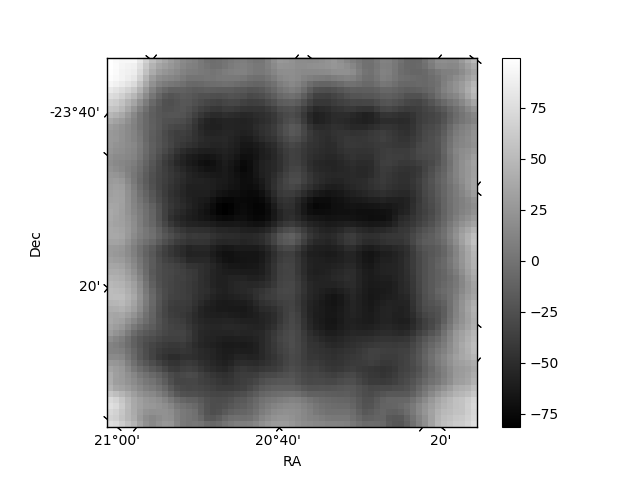
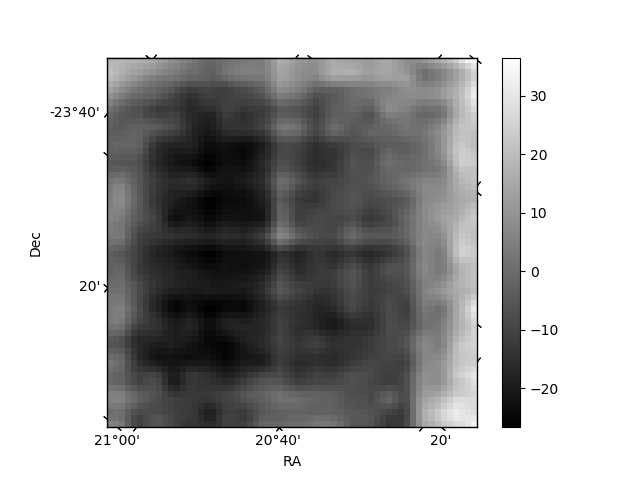
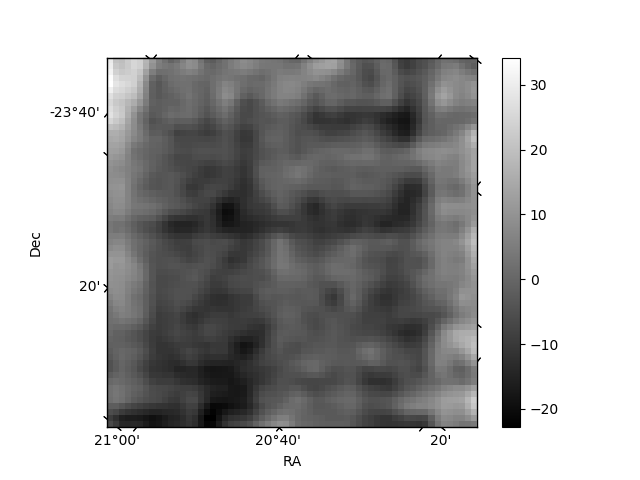
Histogram calculated using DETX and DETY for each event in the final _common_clean file
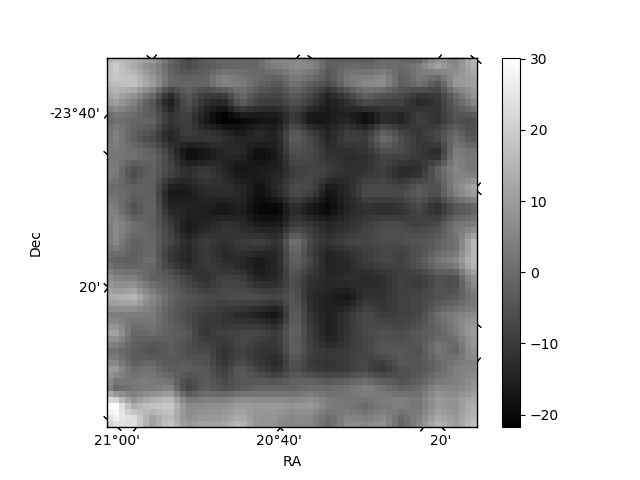
| Quadrant A | 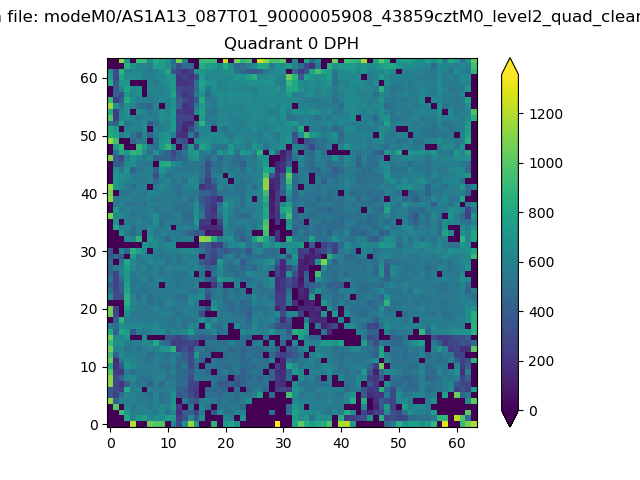 |
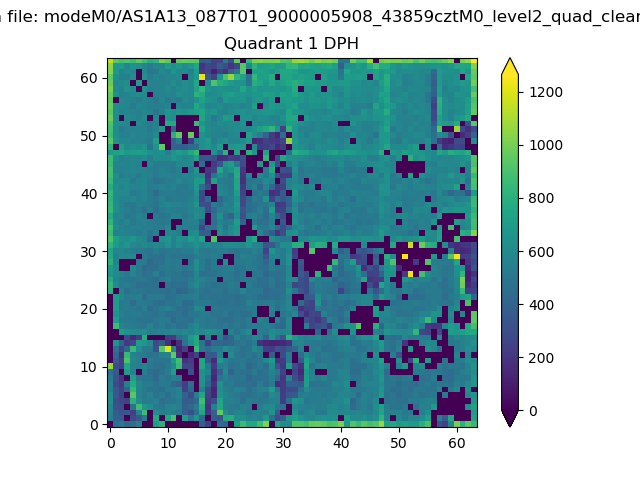 |
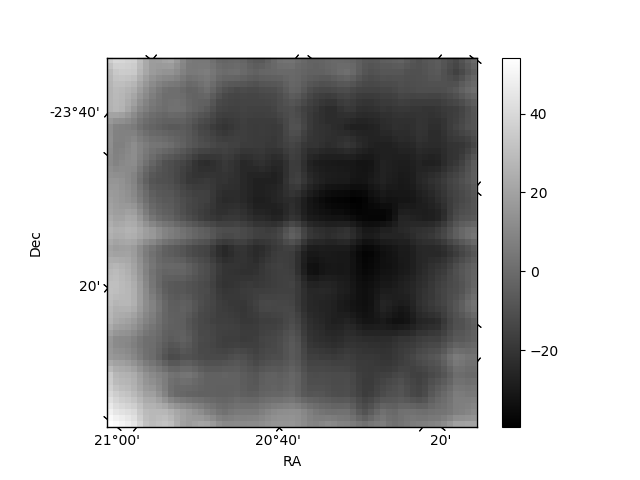
Quadrant B |
|---|---|---|---|
| Quadrant D | 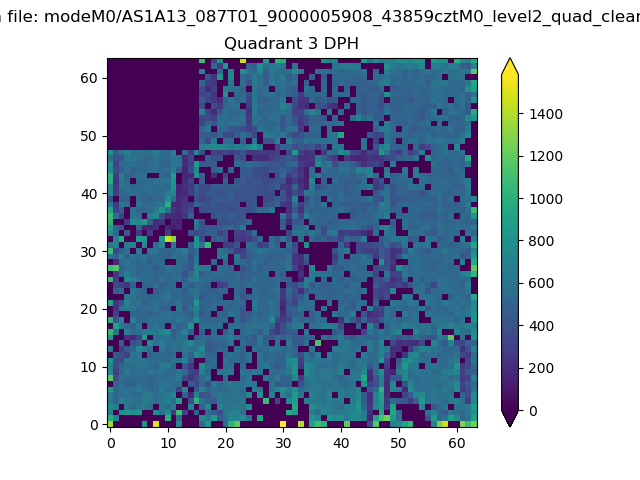 |
 |
Quadrant C |
| Plot type | Count rate plots | Images |
|---|---|---|
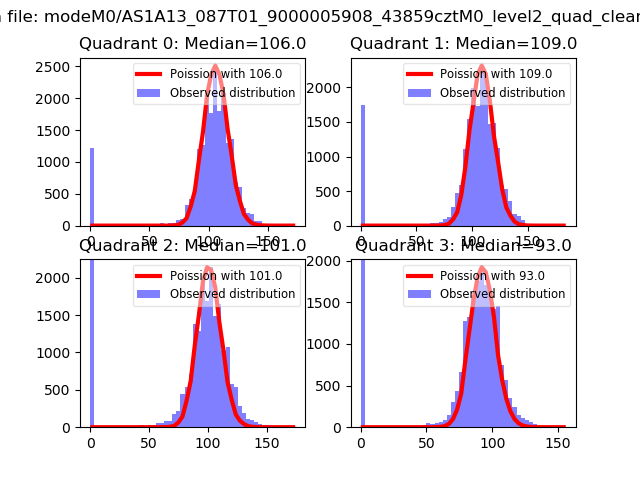
| Comparison with Poisson distribution Blue bars denote a histogram of data divided into 1 sec bins. Red curve is a Poisson curve with rate = median count rate of data. |
 |
 |
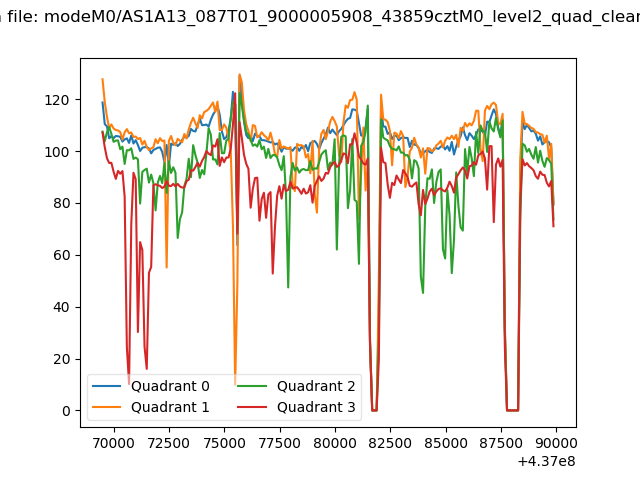
| Quadrant-wise count rates Data is divided into 100 sec bins |
 |
|
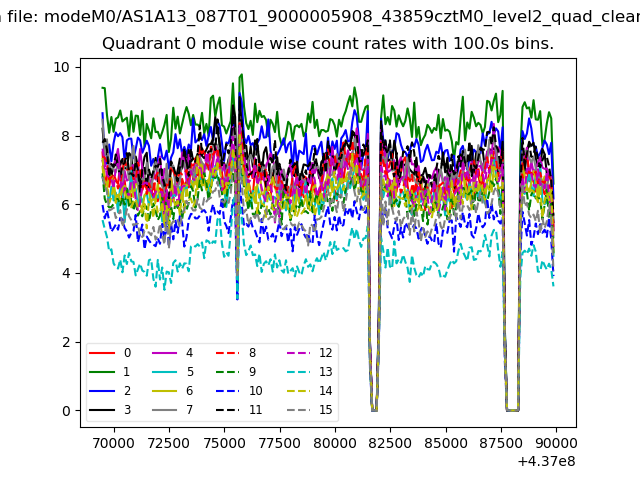
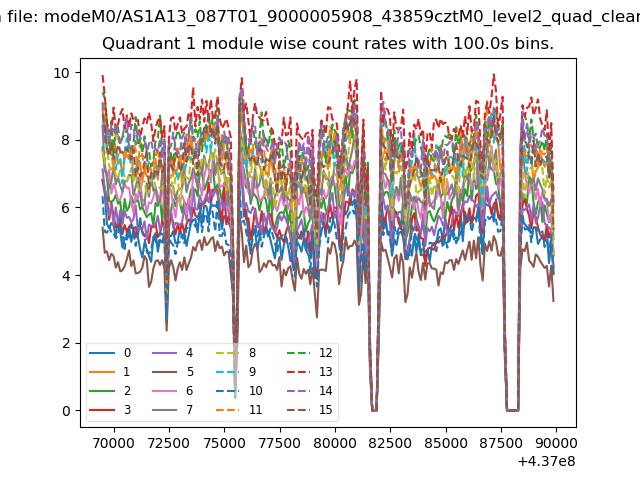
| Module-wise count rates for Quadrant A Data is divided into 100 sec bins |
 |
 |
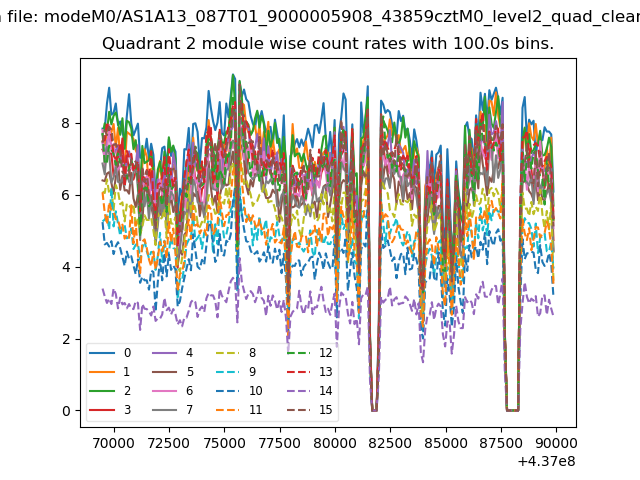
| Module-wise count rates for Quadrant B Data is divided into 100 sec bins |
 |
 |
| Module-wise count rates for Quadrant C Data is divided into 100 sec bins |
 |
 |
| Module-wise count rates for Quadrant D Data is divided into 100 sec bins |
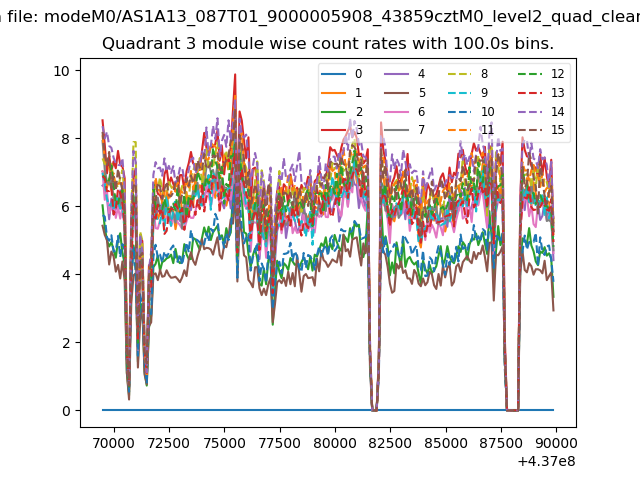 |
 |
| Parameter | Plot |
|---|---|
| CZT HV Monitor | 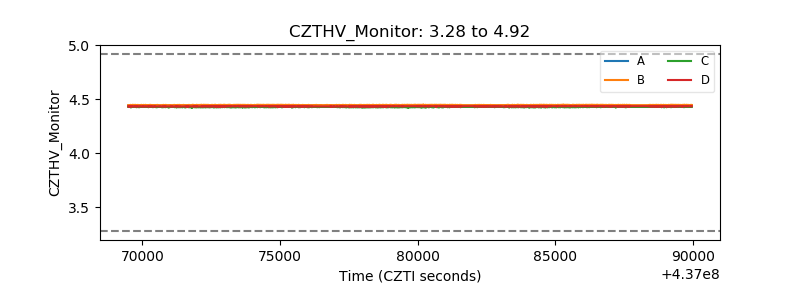 |
| D_VDD | 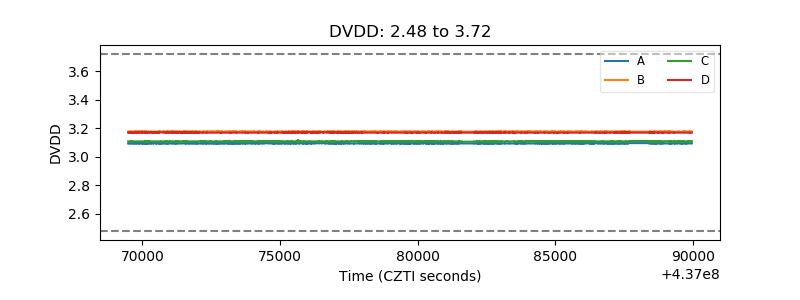 |
| Temperature 1 | 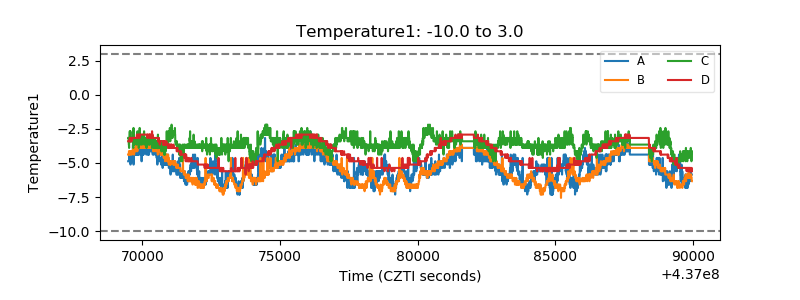 |
| Veto HV Monitor |  |
| Veto LLD | 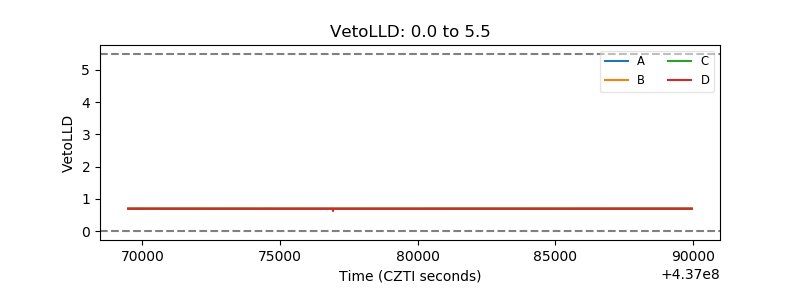 |
| Alpha Counter | 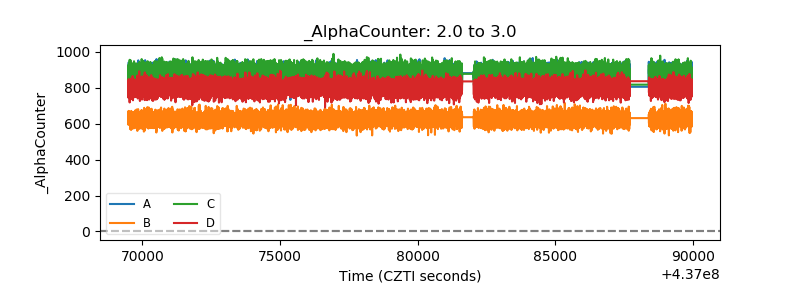 |
| _CPM_Rate | 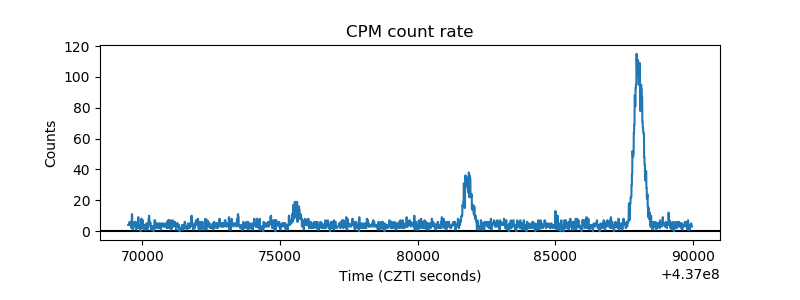 |
| CZT Counter | 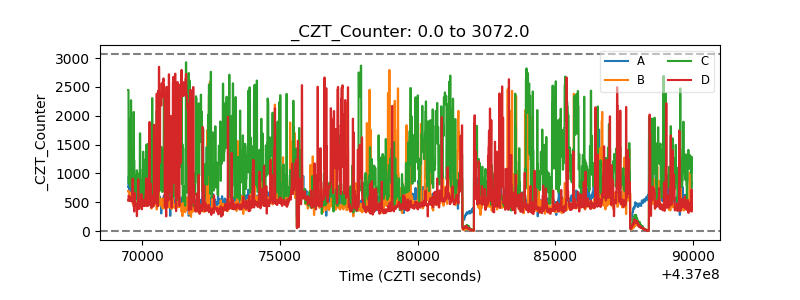 |
| +2.5 Volts monitor |  |
| +5 Volts monitor | 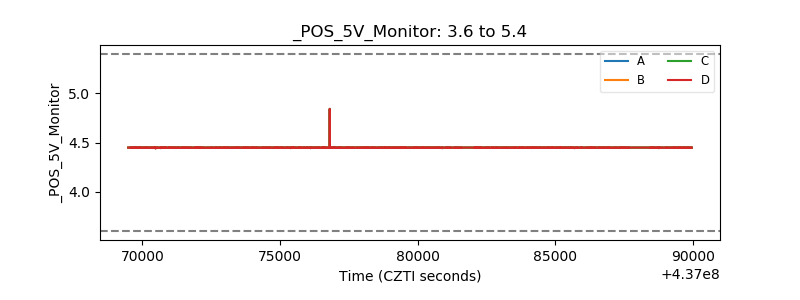 |
| _ROLL_ROT | 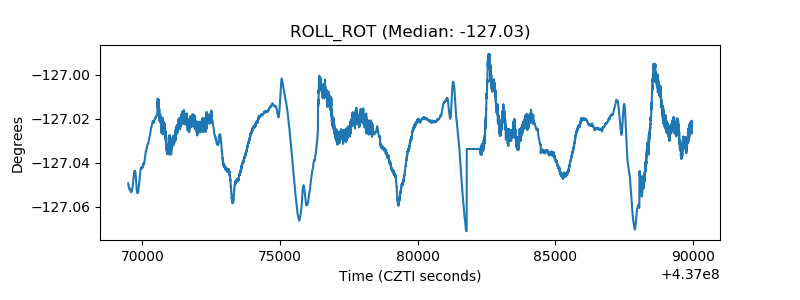 |
| _Roll_DEC | 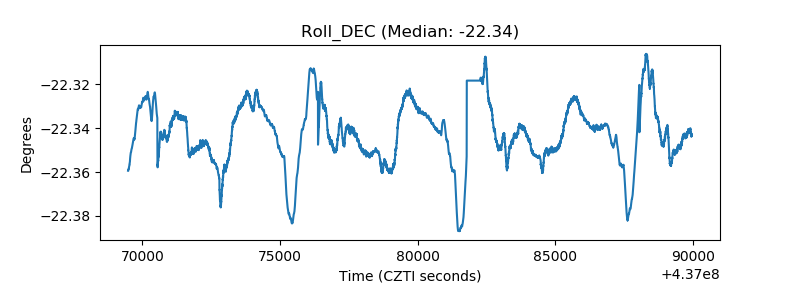 |
| _Roll_RA | 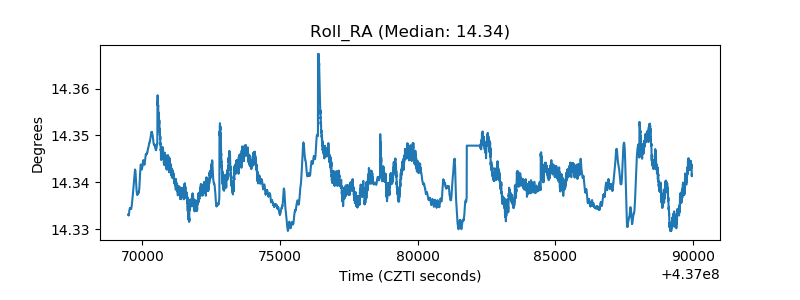 |
| Veto Counter | 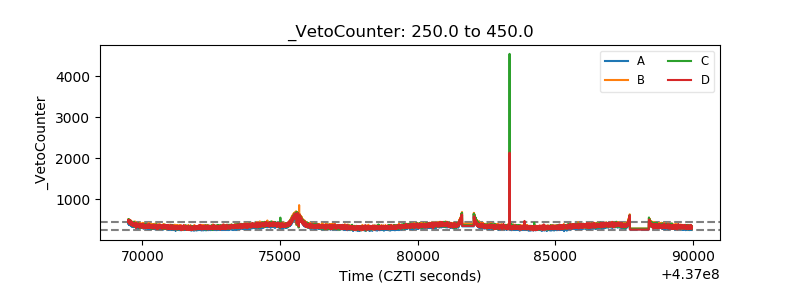 |