| Param | Original file | Final file |
|---|---|---|
| Filename | modeM0/AS1A13_087T01_9000005908_43860cztM0_level2.fits | modeM0/AS1A13_087T01_9000005908_43860cztM0_level2_quad_clean.evt |
| Size (bytes) | 607,216,320 | 106,963,200 |
| Size | 579.1 MB | 102.0 MB |
| Events in quadrant A | 4,411,245 | 736,411 |
| Events in quadrant B | 3,741,068 | 753,357 |
| Events in quadrant C | 8,635,671 | 649,986 |
| Events in quadrant D | 5,153,515 | 616,762 |
| Mode M9 | |||
|---|---|---|---|
| Quadrant | BADHDUFLAG | Total packets | Discarded packets |
| A | 0 | 15 | 0 |
| B | 0 | 16 | 0 |
| C | 0 | 16 | 0 |
| D | 0 | 16 | 0 |
| Mode M0 | |||
|---|---|---|---|
| Quadrant | BADHDUFLAG | Total packets | Discarded packets |
| A | 0 | 17568 | 2 |
| B | 0 | 15839 | 2 |
| C | 0 | 30590 | 2 |
| D | 0 | 20218 | 2 |
| Mode SS | |||
|---|---|---|---|
| Quadrant | BADHDUFLAG | Total packets | Discarded packets |
| A | 0 | 142 | 0 |
| B | 0 | 142 | 0 |
| C | 0 | 142 | 0 |
| D | 0 | 142 | 0 |
| Quadrant | Total seconds | Saturated seconds | Saturation percentage |
|---|---|---|---|
| A | 6918 | 56 | 0.809483% |
| B | 6918 | 136 | 1.965886% |
| C | 6918 | 893 | 12.908355% |
| D | 6918 | 575 | 8.311651% |
Noise dominated data is calculated using 1-second bins in cleaned event files. If a bin has >2000 counts, and if more than 50% of those come from <1% of pixels, then it is considered to be noise-dominated and hence unusable.
| Quadrant | # 1 sec bins | Bins with >0 counts | Bins with >2000 counts | High rate bins dominated by noise | Noise dominated (total time) | Noise dominated (detector-on time) | Marked lightcurve |
|---|---|---|---|---|---|---|---|
| A | 7793 | 6919 | 28 | 28 | 0.36% | 0.40% | 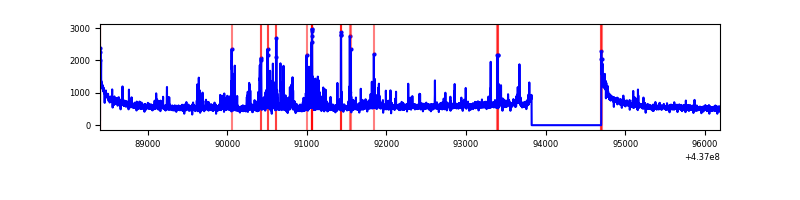 |
| B | 7793 | 6918 | 91 | 91 | 1.17% | 1.32% | 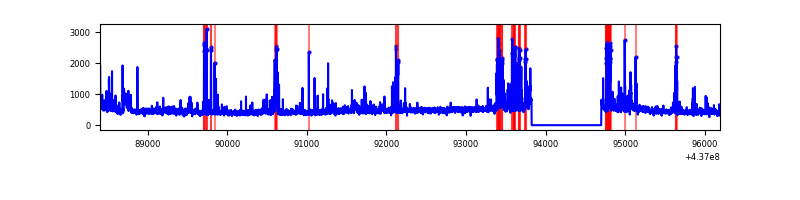 |
| C | 7793 | 6918 | 799 | 799 | 10.25% | 11.55% | 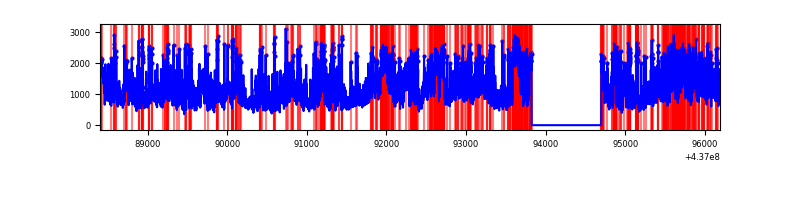 |
| D | 7793 | 6919 | 545 | 545 | 6.99% | 7.88% | 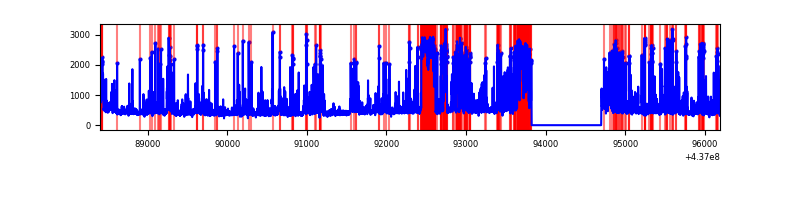 |
Top three noisy pixels from each quadrant. If the there are fewer than three noisy pixels in the level2.evt file, extra rows are filled as -1
| Pixel properties | Quadrant properties | ||||||
|---|---|---|---|---|---|---|---|
| Quadrant | DetID | PixID | Counts | Sigma | Mean | Median | Sigma |
| A | 10 | 83 | 1019509 | 6453.3 | 757 | 742 | 157.9 |
| A | 15 | 223 | 179960 | 1135.24 | 757 | 742 | 157.9 |
| A | 7 | 3 | 160493 | 1011.93 | 757 | 742 | 157.9 |
| B | 5 | 235 | 271190 | 1814.91 | 751 | 728 | 149.0 |
| B | 4 | 170 | 245823 | 1644.69 | 751 | 728 | 149.0 |
| B | 0 | 183 | 153565 | 1025.6 | 751 | 728 | 149.0 |
| C | 3 | 233 | 5125739 | 30296.48 | 709 | 713 | 169.2 |
| C | 0 | 239 | 651341 | 3846.17 | 709 | 713 | 169.2 |
| C | 14 | 254 | 43222 | 251.29 | 709 | 713 | 169.2 |
| D | 13 | 249 | 1036720 | 5913.22 | 703 | 684 | 175.2 |
| D | 12 | 233 | 361897 | 2061.64 | 703 | 684 | 175.2 |
| D | 10 | 102 | 315906 | 1799.14 | 703 | 684 | 175.2 |
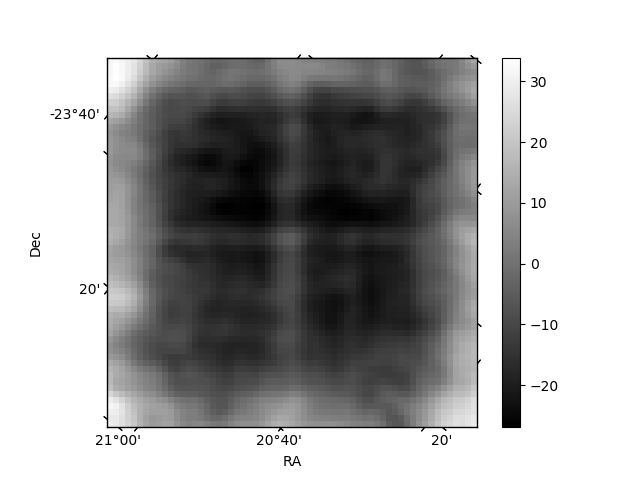
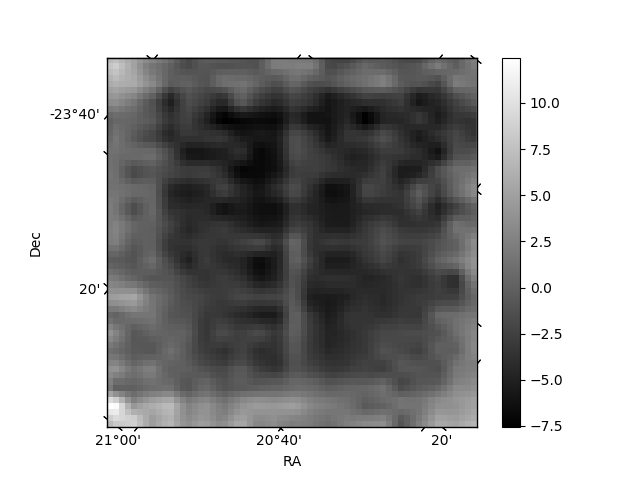
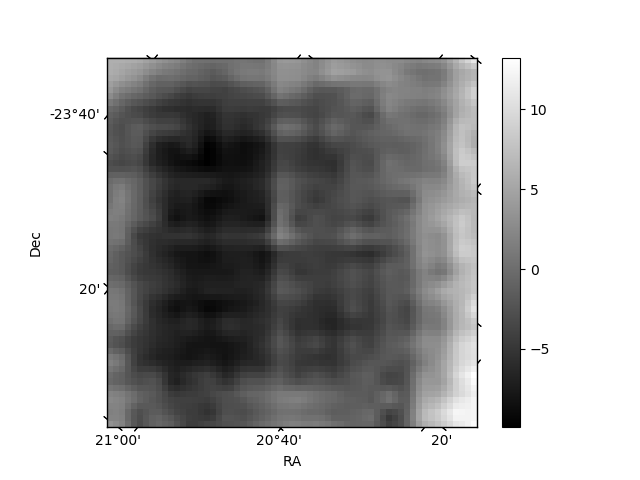
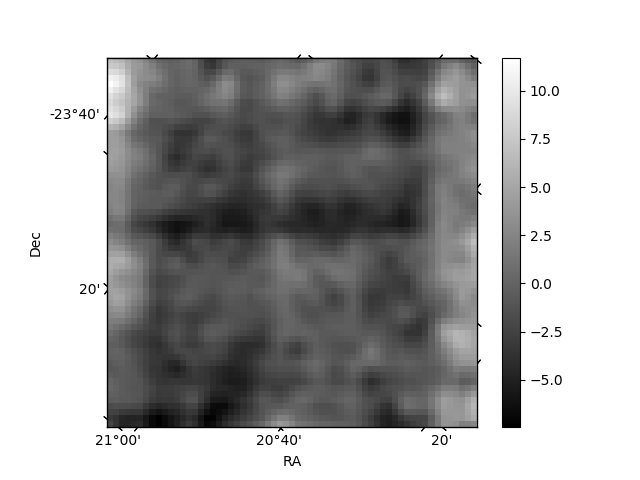
Histogram calculated using DETX and DETY for each event in the final _common_clean file
| Quadrant A | 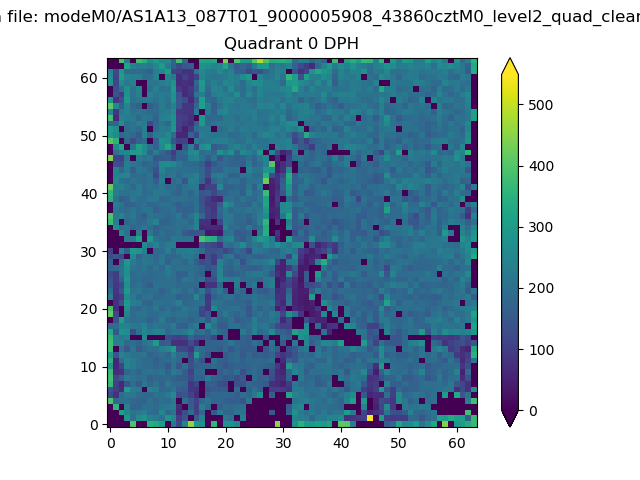 |
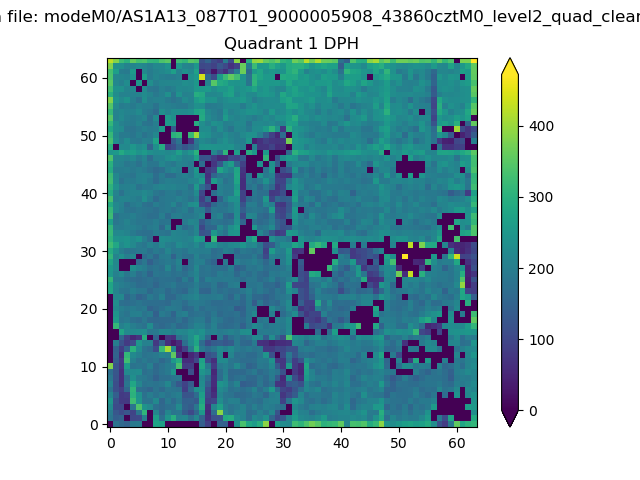 |
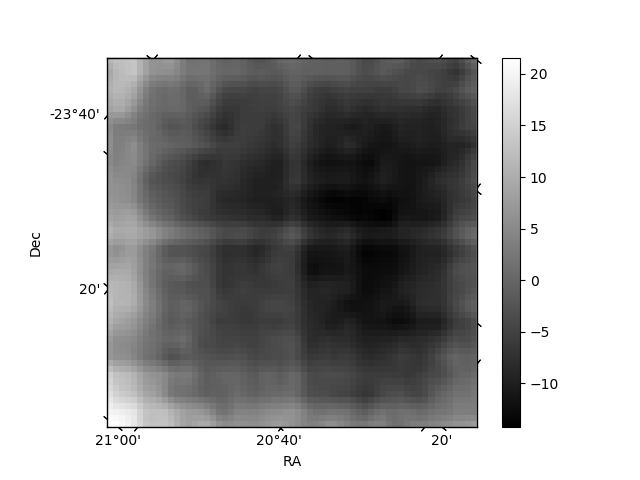
Quadrant B |
|---|---|---|---|
| Quadrant D | 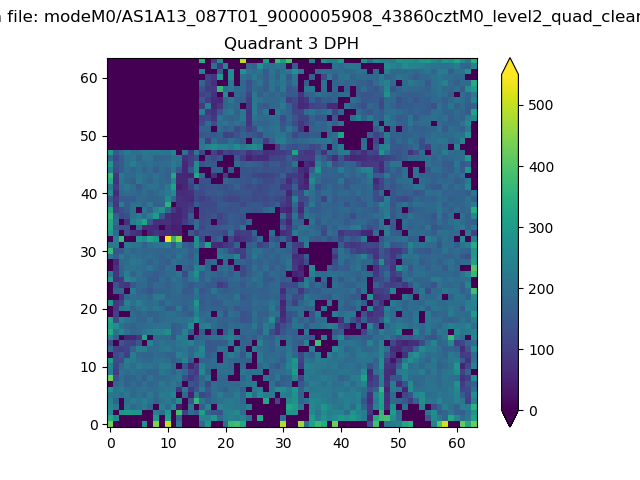 |
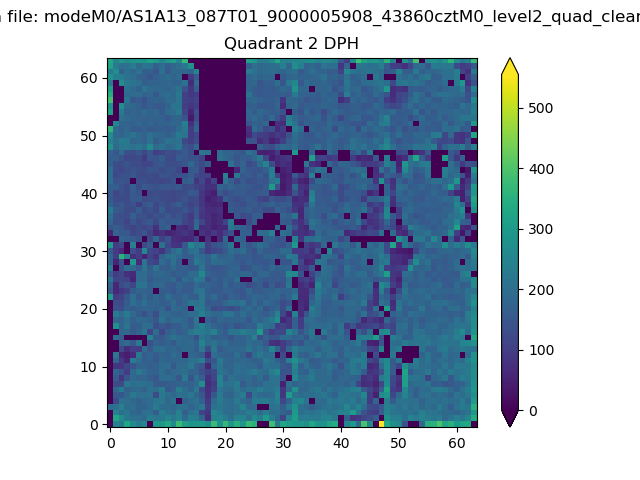 |
Quadrant C |
| Plot type | Count rate plots | Images |
|---|---|---|
| Comparison with Poisson distribution Blue bars denote a histogram of data divided into 1 sec bins. Red curve is a Poisson curve with rate = median count rate of data. |
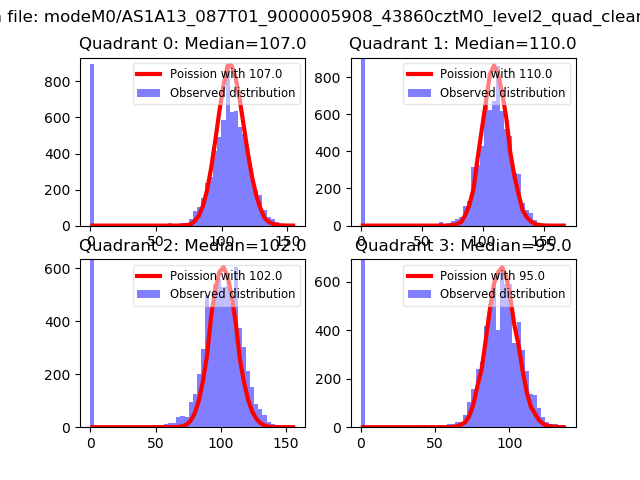 |
 |
| Quadrant-wise count rates Data is divided into 100 sec bins |
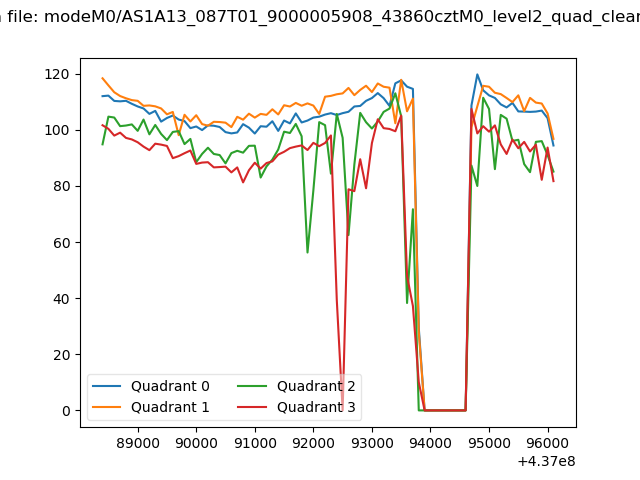 |
|
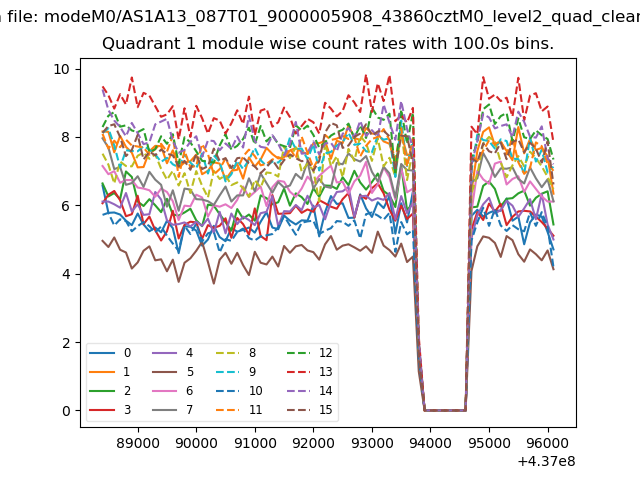
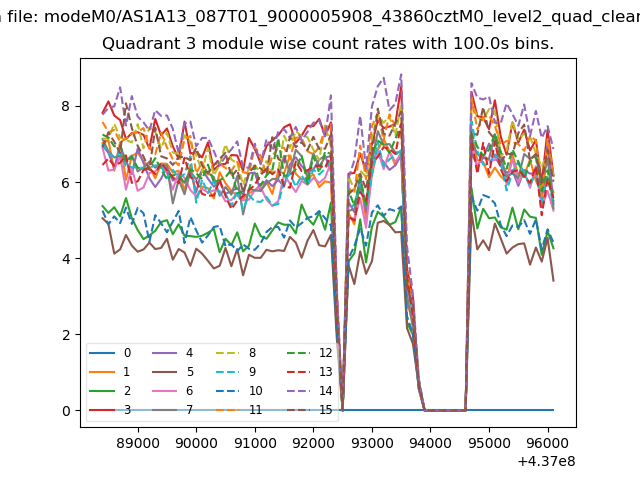
| Module-wise count rates for Quadrant A Data is divided into 100 sec bins |
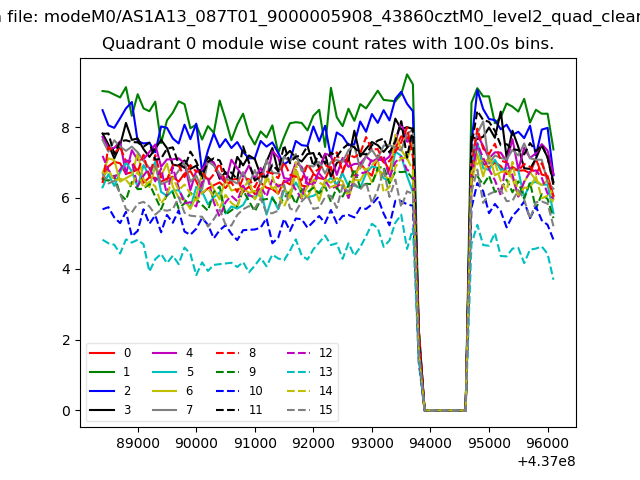 |
 |
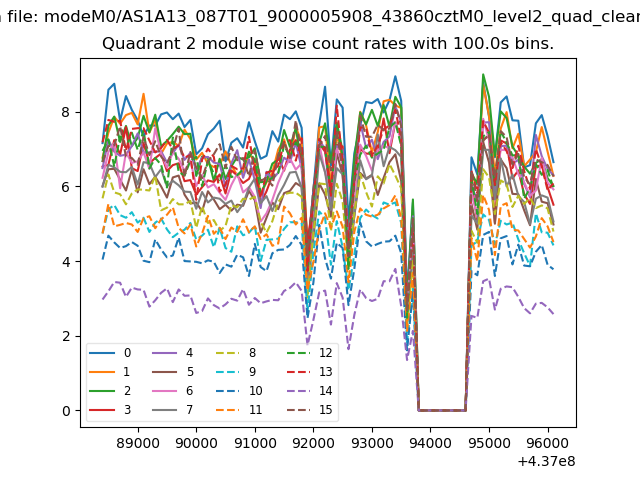
| Module-wise count rates for Quadrant B Data is divided into 100 sec bins |
 |
 |
| Module-wise count rates for Quadrant C Data is divided into 100 sec bins |
 |
 |
| Module-wise count rates for Quadrant D Data is divided into 100 sec bins |
 |
 |
| Parameter | Plot |
|---|---|
| CZT HV Monitor | 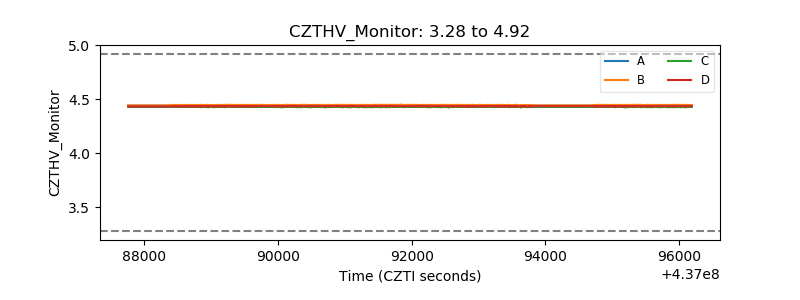 |
| D_VDD | 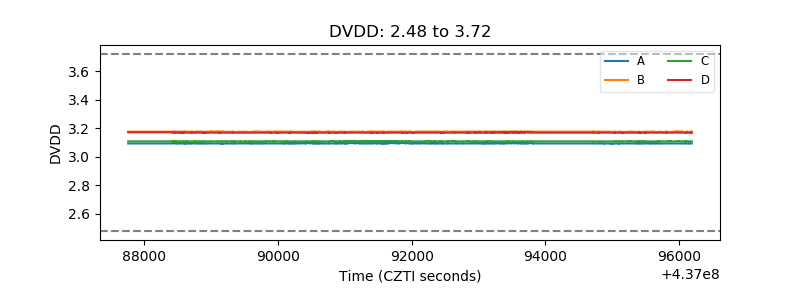 |
| Temperature 1 | 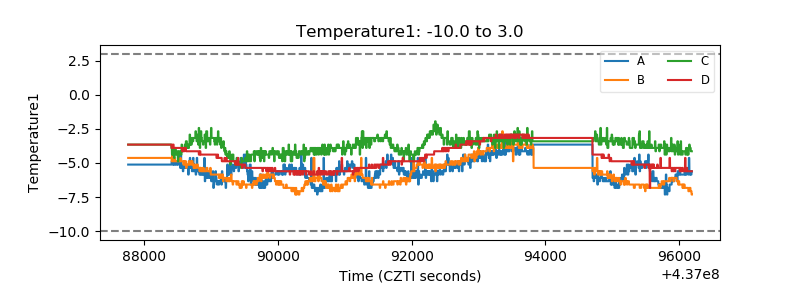 |
| Veto HV Monitor |  |
| Veto LLD | 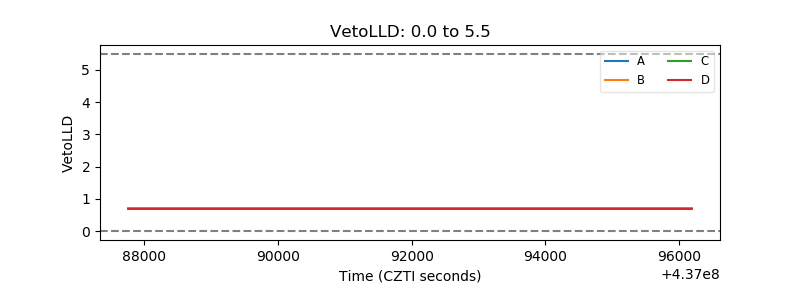 |
| Alpha Counter | 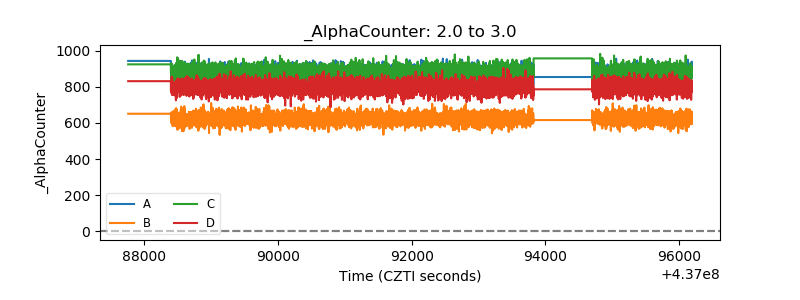 |
| _CPM_Rate | 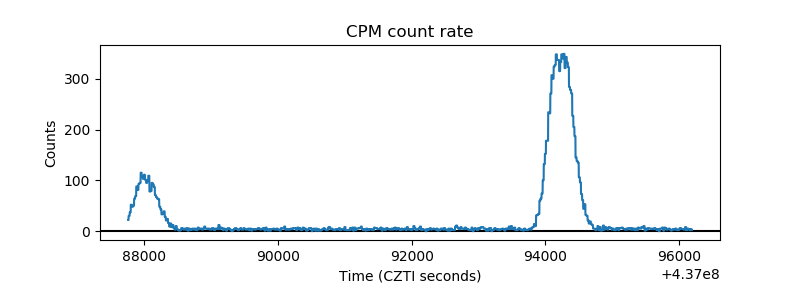 |
| CZT Counter | 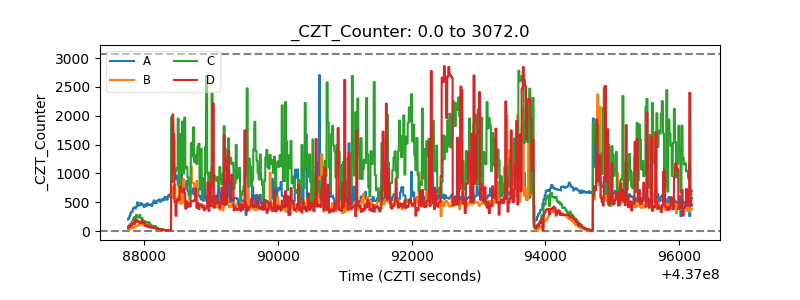 |
| +2.5 Volts monitor | 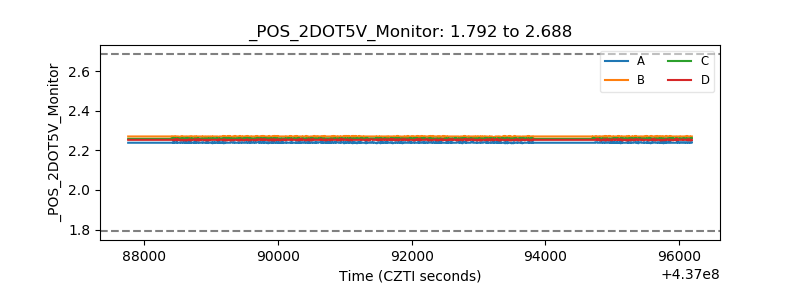 |
| +5 Volts monitor | 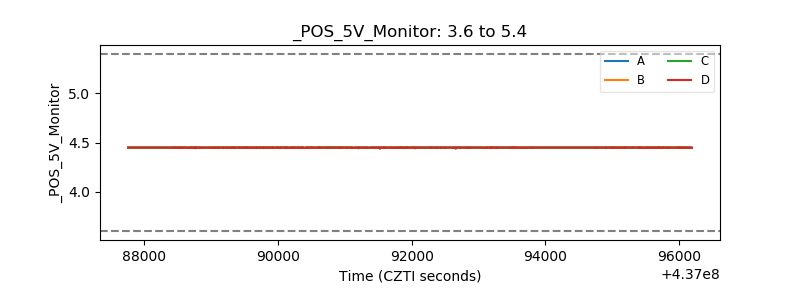 |
| _ROLL_ROT | 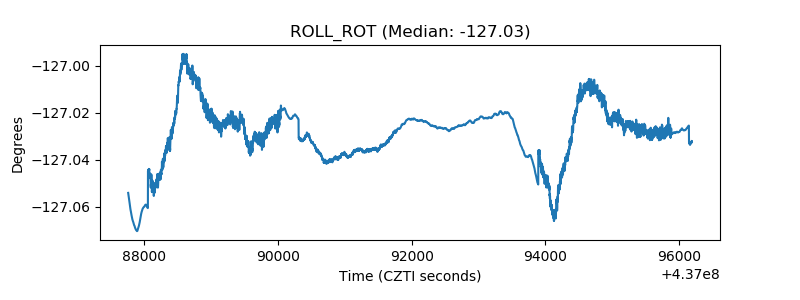 |
| _Roll_DEC | 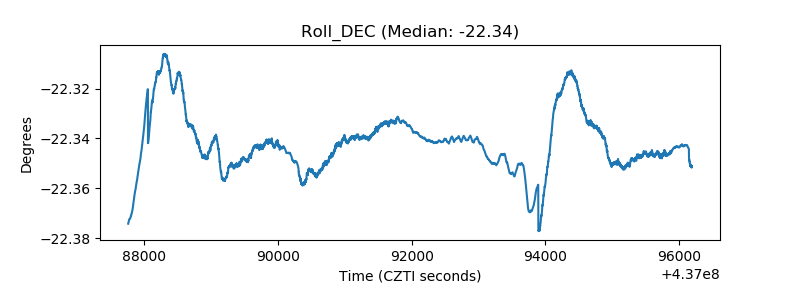 |
| _Roll_RA | 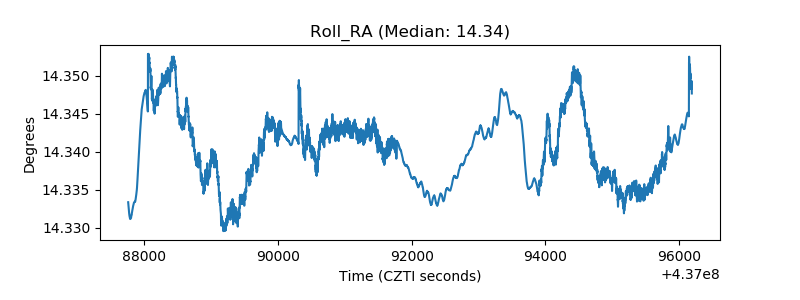 |
| Veto Counter | 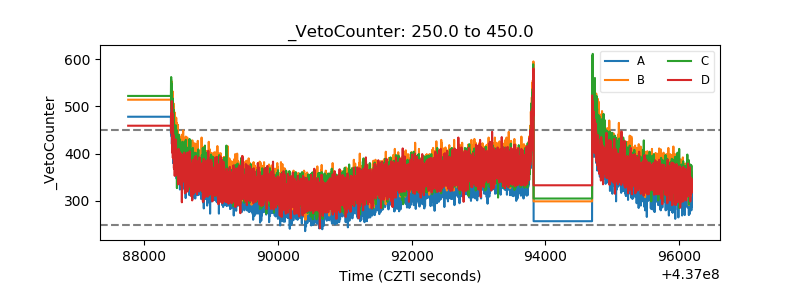 |