| Param | Original file | Final file |
|---|---|---|
| Filename | modeM0/AS1A13_087T01_9000005908_43861cztM0_level2.fits | modeM0/AS1A13_087T01_9000005908_43861cztM0_level2_quad_clean.evt |
| Size (bytes) | 626,423,040 | 102,389,760 |
| Size | 597.4 MB | 97.6 MB |
| Events in quadrant A | 3,948,304 | 723,616 |
| Events in quadrant B | 3,341,591 | 742,375 |
| Events in quadrant C | 9,861,250 | 587,782 |
| Events in quadrant D | 5,521,984 | 582,312 |
| Mode M9 | |||
|---|---|---|---|
| Quadrant | BADHDUFLAG | Total packets | Discarded packets |
| A | 0 | 13 | 0 |
| B | 0 | 14 | 0 |
| C | 0 | 14 | 0 |
| D | 0 | 14 | 0 |
| Mode M0 | |||
|---|---|---|---|
| Quadrant | BADHDUFLAG | Total packets | Discarded packets |
| A | 0 | 15535 | 2 |
| B | 0 | 14548 | 2 |
| C | 0 | 33941 | 2 |
| D | 0 | 21024 | 2 |
| Mode SS | |||
|---|---|---|---|
| Quadrant | BADHDUFLAG | Total packets | Discarded packets |
| A | 0 | 134 | 0 |
| B | 0 | 134 | 0 |
| C | 0 | 134 | 0 |
| D | 0 | 134 | 0 |
| Quadrant | Total seconds | Saturated seconds | Saturation percentage |
|---|---|---|---|
| A | 6649 | 50 | 0.751993% |
| B | 6649 | 109 | 1.639344% |
| C | 6649 | 1527 | 22.965860% |
| D | 6649 | 790 | 11.881486% |
Noise dominated data is calculated using 1-second bins in cleaned event files. If a bin has >2000 counts, and if more than 50% of those come from <1% of pixels, then it is considered to be noise-dominated and hence unusable.
| Quadrant | # 1 sec bins | Bins with >0 counts | Bins with >2000 counts | High rate bins dominated by noise | Noise dominated (total time) | Noise dominated (detector-on time) | Marked lightcurve |
|---|---|---|---|---|---|---|---|
| A | 7665 | 6650 | 11 | 11 | 0.14% | 0.17% |  |
| B | 7665 | 6650 | 76 | 76 | 0.99% | 1.14% |  |
| C | 7664 | 6648 | 1512 | 1512 | 19.73% | 22.74% | 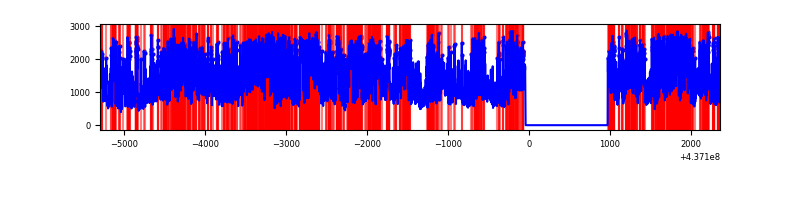 |
| D | 7665 | 6650 | 728 | 728 | 9.50% | 10.95% |  |
Top three noisy pixels from each quadrant. If the there are fewer than three noisy pixels in the level2.evt file, extra rows are filled as -1
| Pixel properties | Quadrant properties | ||||||
|---|---|---|---|---|---|---|---|
| Quadrant | DetID | PixID | Counts | Sigma | Mean | Median | Sigma |
| A | 10 | 83 | 1014895 | 6657.35 | 736 | 721 | 152.3 |
| A | 7 | 3 | 44993 | 290.61 | 736 | 721 | 152.3 |
| A | 2 | 79 | 22071 | 140.14 | 736 | 721 | 152.3 |
| B | 0 | 183 | 180812 | 1241.42 | 734 | 711 | 145.1 |
| B | 4 | 170 | 123655 | 847.44 | 734 | 711 | 145.1 |
| B | 5 | 235 | 92682 | 633.95 | 734 | 711 | 145.1 |
| C | 3 | 233 | 5003303 | 31416.52 | 676 | 681 | 159.2 |
| C | 0 | 239 | 2102117 | 13197.04 | 676 | 681 | 159.2 |
| C | 14 | 254 | 56112 | 348.11 | 676 | 681 | 159.2 |
| D | 13 | 249 | 1579885 | 9204.24 | 686 | 667 | 171.6 |
| D | 12 | 233 | 446306 | 2597.34 | 686 | 667 | 171.6 |
| D | 2 | 249 | 342265 | 1990.95 | 686 | 667 | 171.6 |
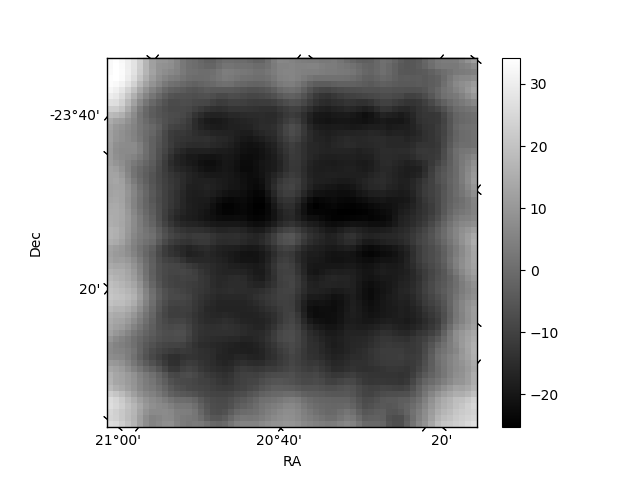
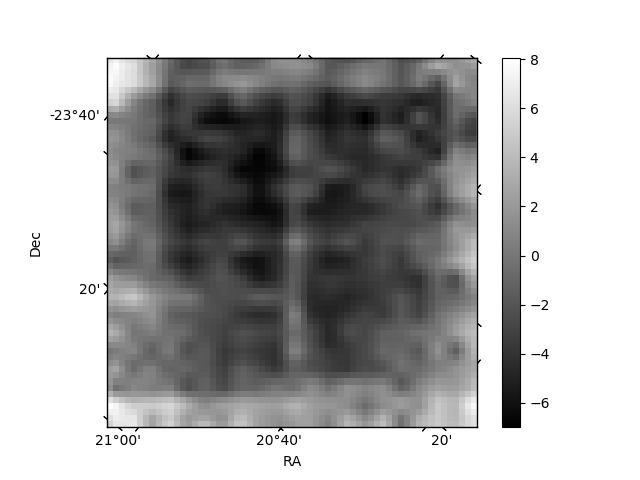
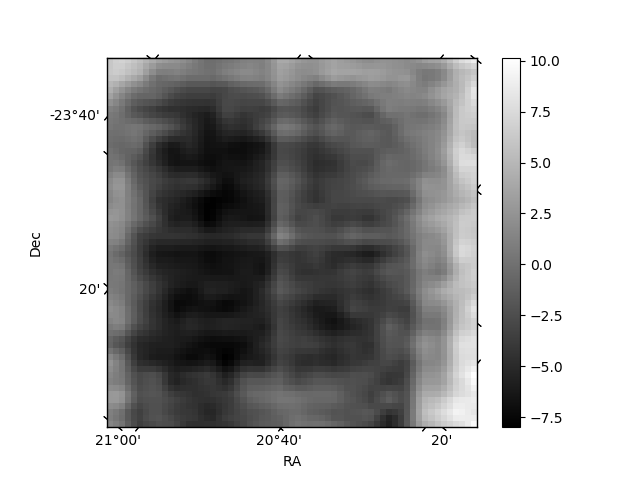
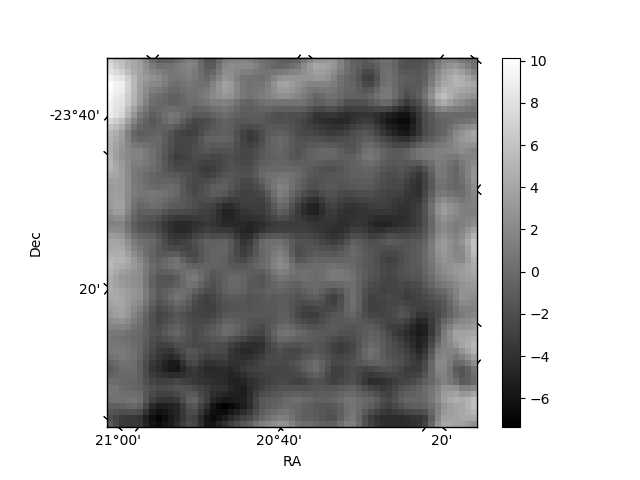
Histogram calculated using DETX and DETY for each event in the final _common_clean file
| Quadrant A | 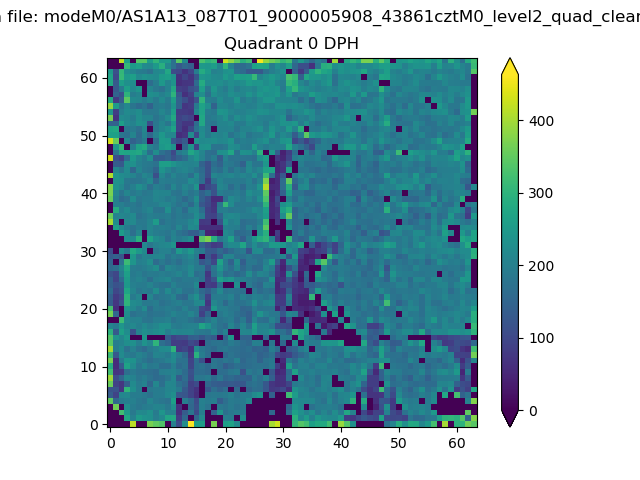 |
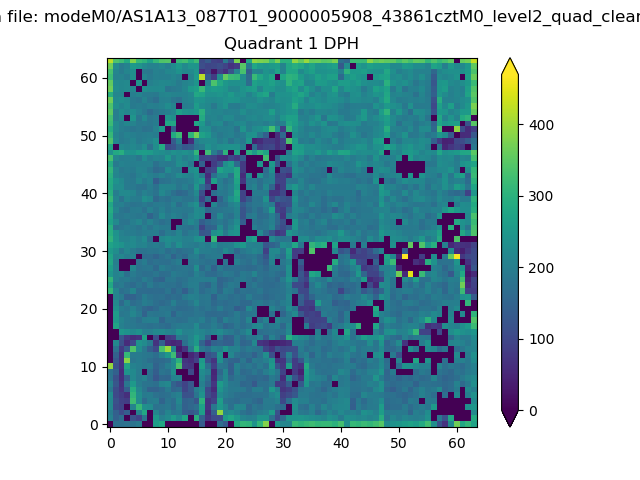 |
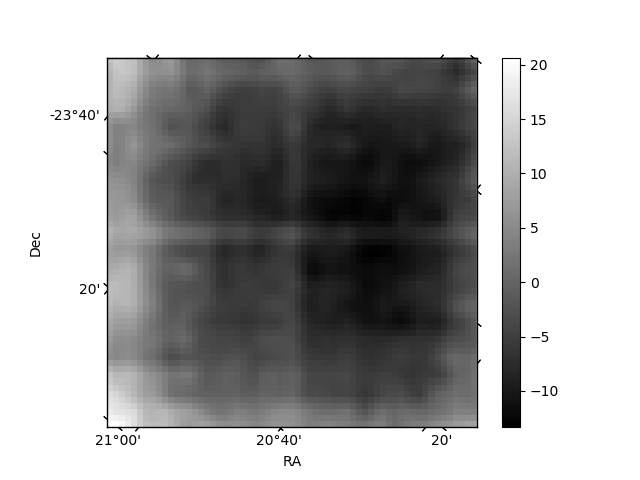
Quadrant B |
|---|---|---|---|
| Quadrant D | 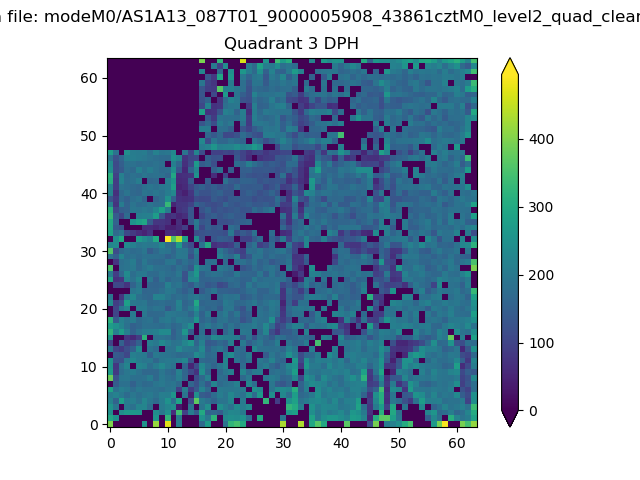 |
 |
Quadrant C |
| Plot type | Count rate plots | Images |
|---|---|---|
| Comparison with Poisson distribution Blue bars denote a histogram of data divided into 1 sec bins. Red curve is a Poisson curve with rate = median count rate of data. |
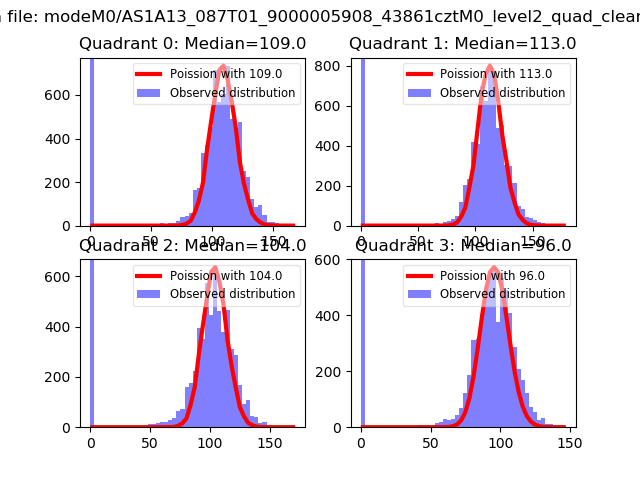 |
 |
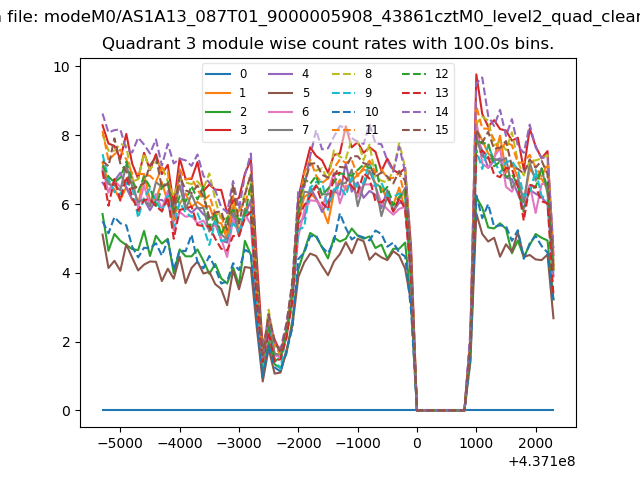
| Quadrant-wise count rates Data is divided into 100 sec bins |
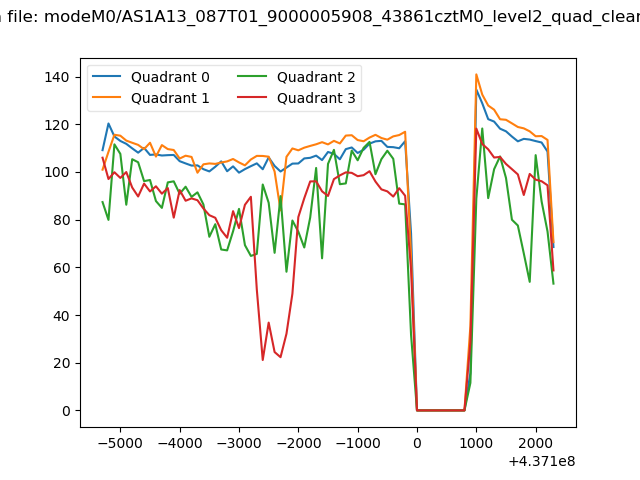 |
|
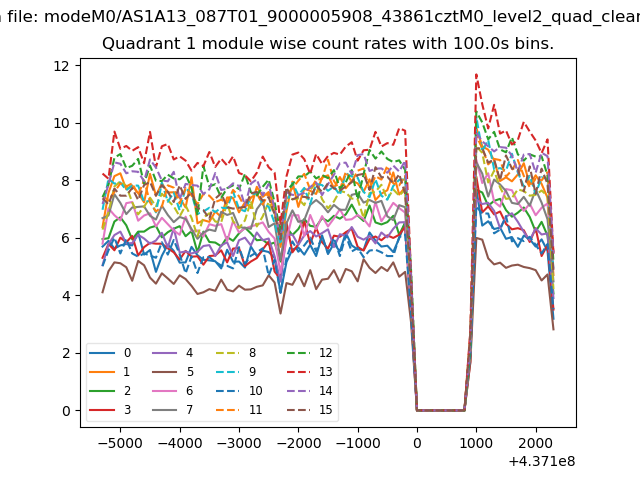
| Module-wise count rates for Quadrant A Data is divided into 100 sec bins |
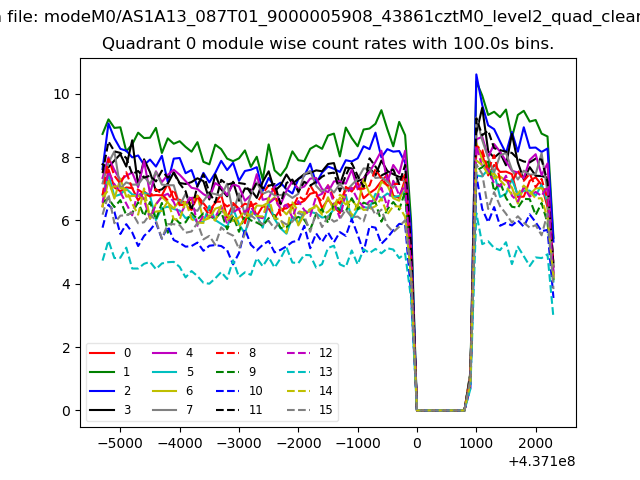 |
 |
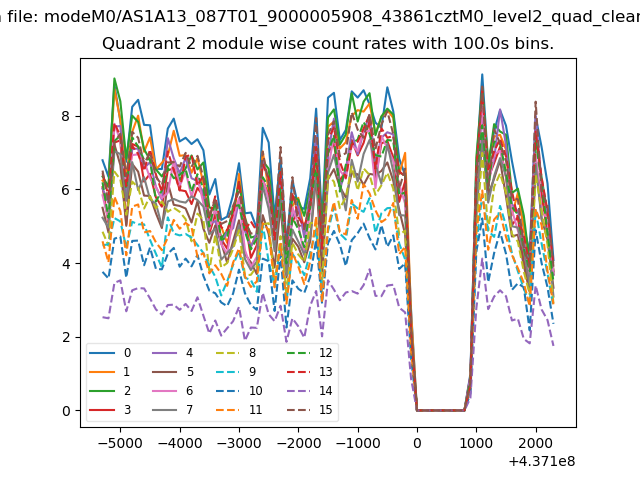
| Module-wise count rates for Quadrant B Data is divided into 100 sec bins |
 |
 |
| Module-wise count rates for Quadrant C Data is divided into 100 sec bins |
 |
 |
| Module-wise count rates for Quadrant D Data is divided into 100 sec bins |
 |
 |
| Parameter | Plot |
|---|---|
| CZT HV Monitor | 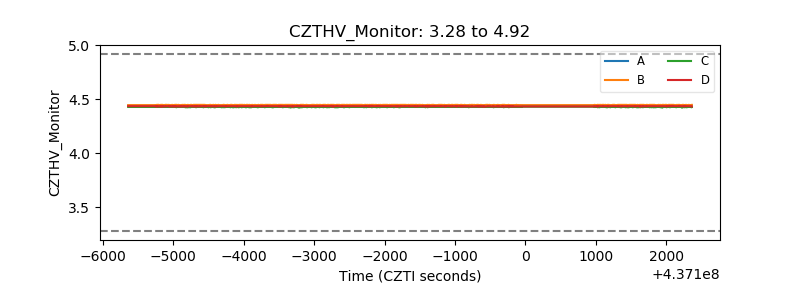 |
| D_VDD | 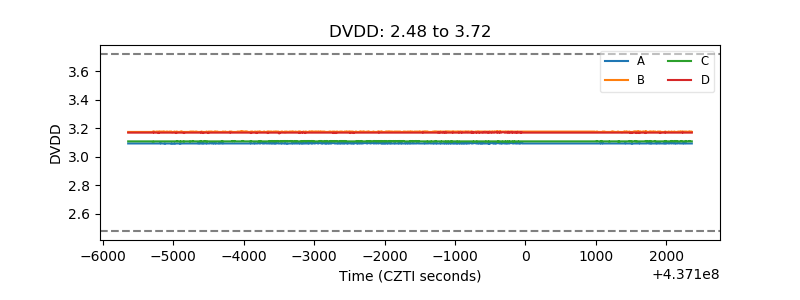 |
| Temperature 1 | 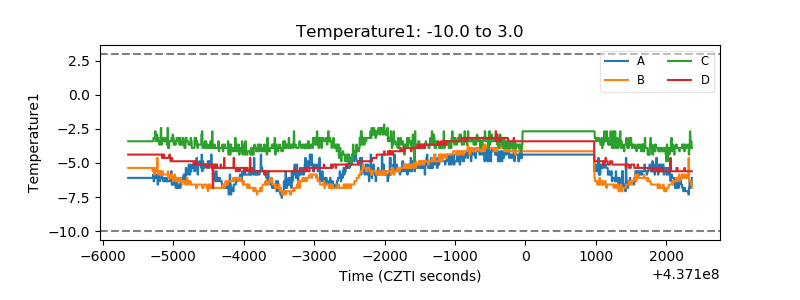 |
| Veto HV Monitor |  |
| Veto LLD | 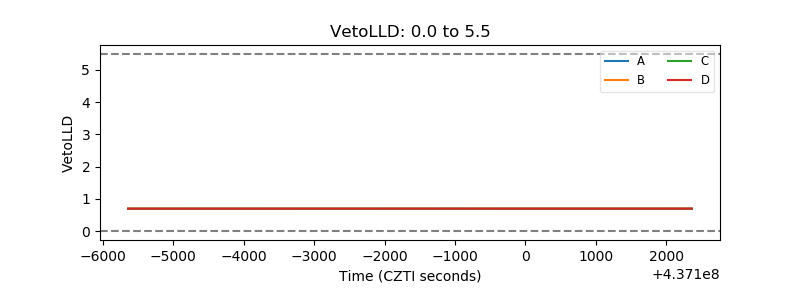 |
| Alpha Counter | 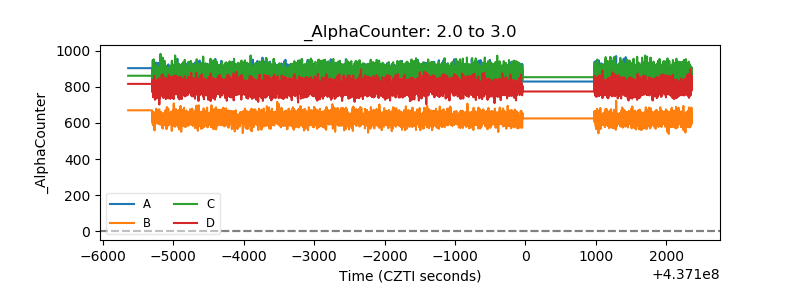 |
| _CPM_Rate | 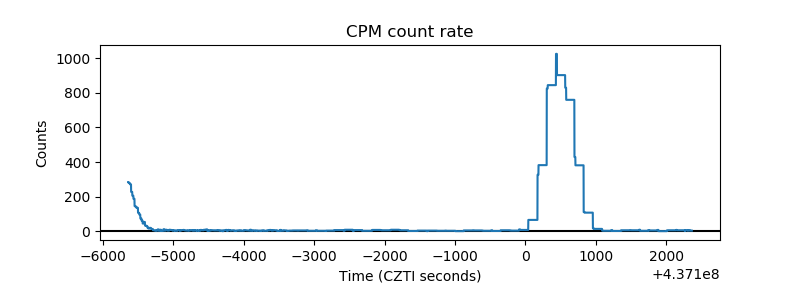 |
| CZT Counter | 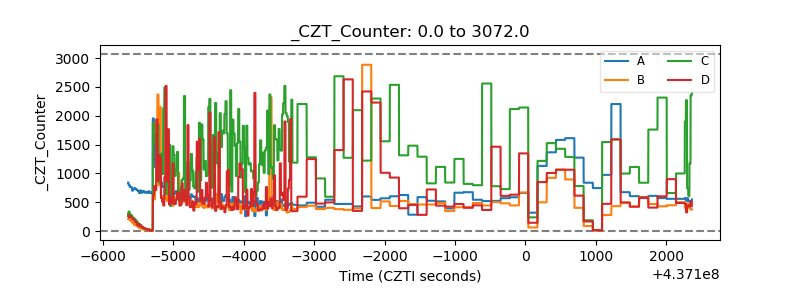 |
| +2.5 Volts monitor | 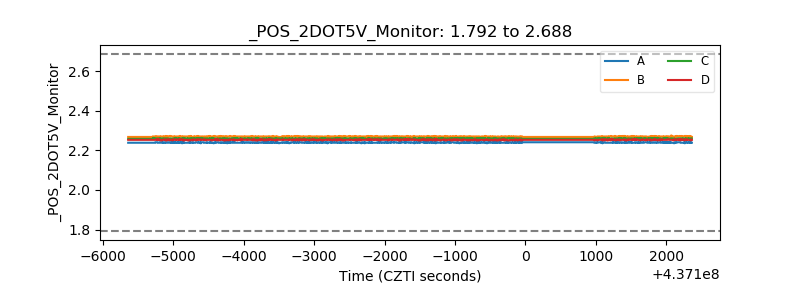 |
| +5 Volts monitor | 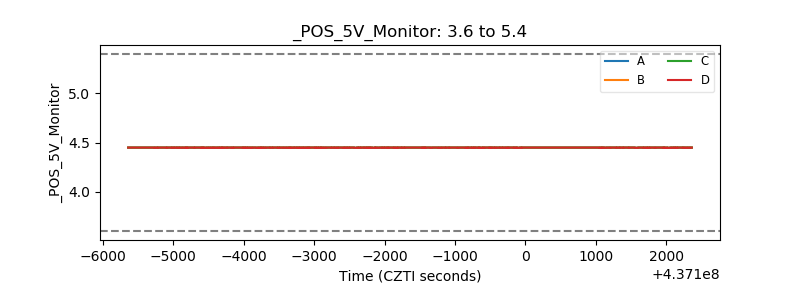 |
| _ROLL_ROT | 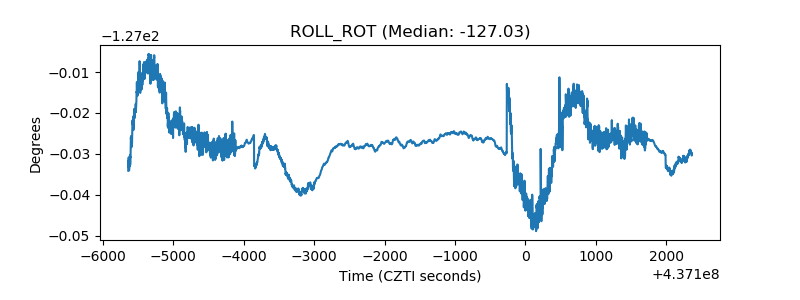 |
| _Roll_DEC | 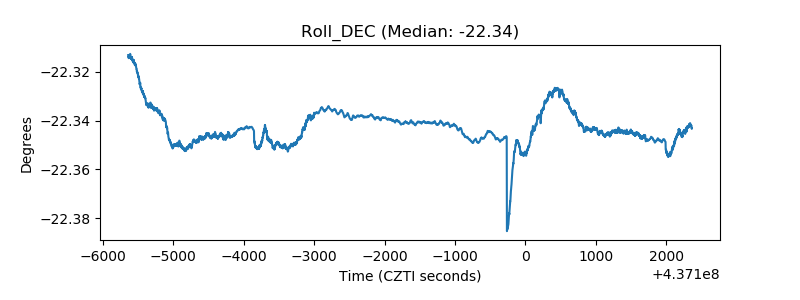 |
| _Roll_RA | 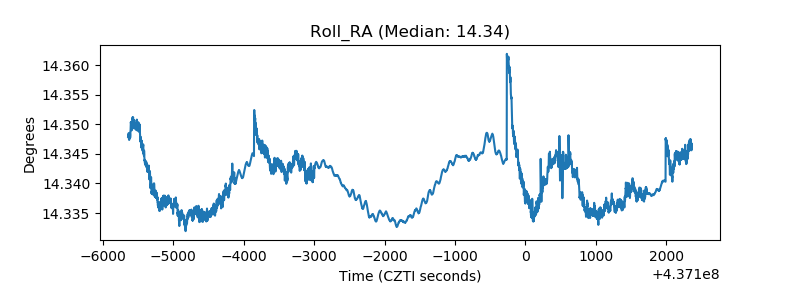 |
| Veto Counter | 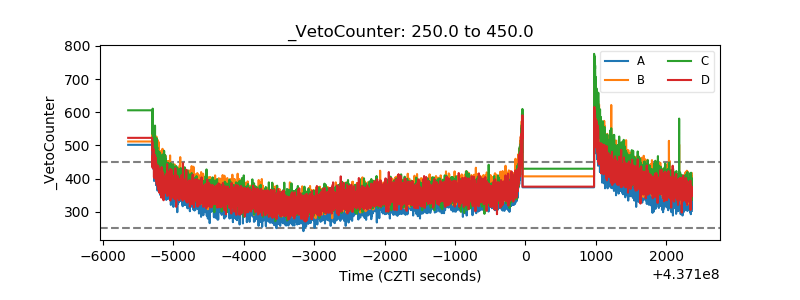 |