| Param | Original file | Final file |
|---|---|---|
| Filename | modeM0/AS1A13_087T01_9000005908_43863cztM0_level2.fits | modeM0/AS1A13_087T01_9000005908_43863cztM0_level2_quad_clean.evt |
| Size (bytes) | 551,678,400 | 105,543,360 |
| Size | 526.1 MB | 100.7 MB |
| Events in quadrant A | 4,163,166 | 734,347 |
| Events in quadrant B | 3,461,673 | 764,790 |
| Events in quadrant C | 8,696,939 | 579,632 |
| Events in quadrant D | 3,594,744 | 663,216 |
| Mode M9 | |||
|---|---|---|---|
| Quadrant | BADHDUFLAG | Total packets | Discarded packets |
| A | 0 | 15 | 0 |
| B | 0 | 16 | 0 |
| C | 0 | 16 | 0 |
| D | 0 | 16 | 0 |
| Mode M0 | |||
|---|---|---|---|
| Quadrant | BADHDUFLAG | Total packets | Discarded packets |
| A | 0 | 16280 | 2 |
| B | 0 | 14660 | 2 |
| C | 0 | 30278 | 3 |
| D | 0 | 15217 | 2 |
| Mode SS | |||
|---|---|---|---|
| Quadrant | BADHDUFLAG | Total packets | Discarded packets |
| A | 0 | 132 | 0 |
| B | 0 | 132 | 0 |
| C | 0 | 132 | 0 |
| D | 0 | 132 | 0 |
| Quadrant | Total seconds | Saturated seconds | Saturation percentage |
|---|---|---|---|
| A | 6506 | 112 | 1.721488% |
| B | 6506 | 134 | 2.059637% |
| C | 6505 | 1659 | 25.503459% |
| D | 6505 | 135 | 2.075327% |
Noise dominated data is calculated using 1-second bins in cleaned event files. If a bin has >2000 counts, and if more than 50% of those come from <1% of pixels, then it is considered to be noise-dominated and hence unusable.
| Quadrant | # 1 sec bins | Bins with >0 counts | Bins with >2000 counts | High rate bins dominated by noise | Noise dominated (total time) | Noise dominated (detector-on time) | Marked lightcurve |
|---|---|---|---|---|---|---|---|
| A | 7631 | 6506 | 39 | 39 | 0.51% | 0.60% |  |
| B | 7631 | 6506 | 83 | 83 | 1.09% | 1.28% |  |
| C | 7630 | 6505 | 1579 | 1579 | 20.69% | 24.27% |  |
| D | 7630 | 6505 | 93 | 93 | 1.22% | 1.43% |  |
Top three noisy pixels from each quadrant. If the there are fewer than three noisy pixels in the level2.evt file, extra rows are filled as -1
| Pixel properties | Quadrant properties | ||||||
|---|---|---|---|---|---|---|---|
| Quadrant | DetID | PixID | Counts | Sigma | Mean | Median | Sigma |
| A | 10 | 83 | 1023539 | 6659.76 | 744 | 729 | 153.6 |
| A | 15 | 223 | 124295 | 804.57 | 744 | 729 | 153.6 |
| A | 7 | 3 | 71354 | 459.86 | 744 | 729 | 153.6 |
| B | 5 | 235 | 301946 | 2052.96 | 746 | 724 | 146.7 |
| B | 0 | 183 | 110280 | 746.67 | 746 | 724 | 146.7 |
| B | 4 | 170 | 78550 | 530.42 | 746 | 724 | 146.7 |
| C | 0 | 239 | 2941629 | 18553.23 | 668 | 672 | 158.5 |
| C | 3 | 233 | 2534503 | 15984.85 | 668 | 672 | 158.5 |
| C | 15 | 158 | 553528 | 3487.73 | 668 | 672 | 158.5 |
| D | 12 | 233 | 267869 | 1472.45 | 731 | 710 | 181.4 |
| D | 2 | 249 | 178344 | 979.03 | 731 | 710 | 181.4 |
| D | 1 | 52 | 89216 | 487.8 | 731 | 710 | 181.4 |
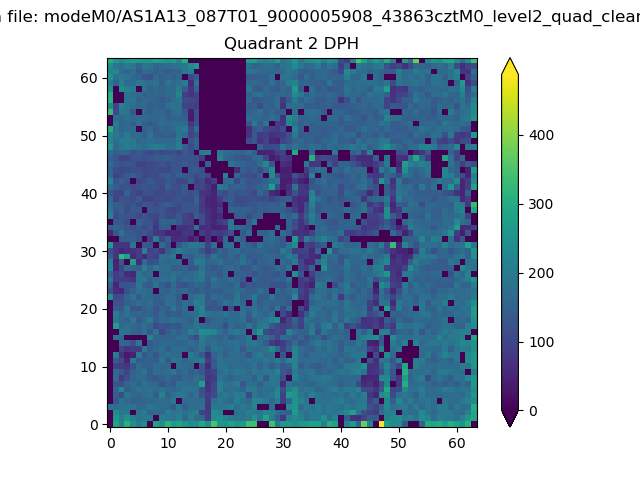
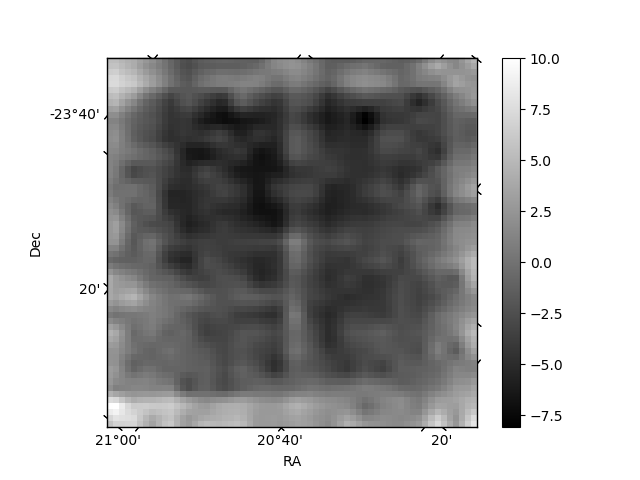
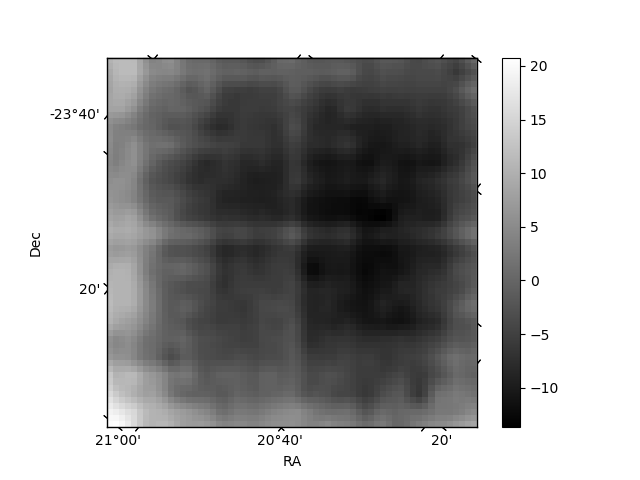
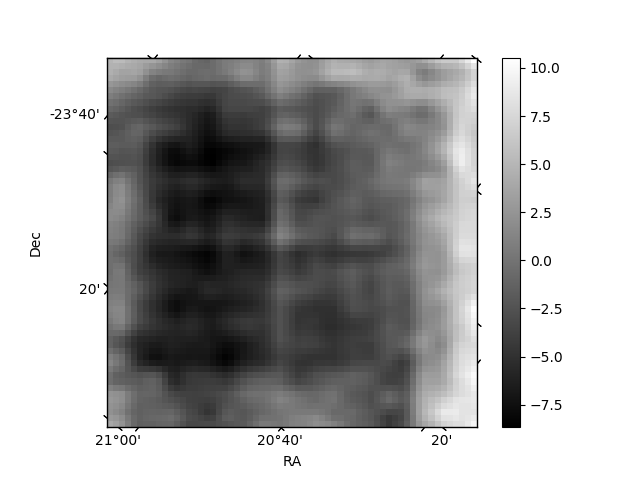
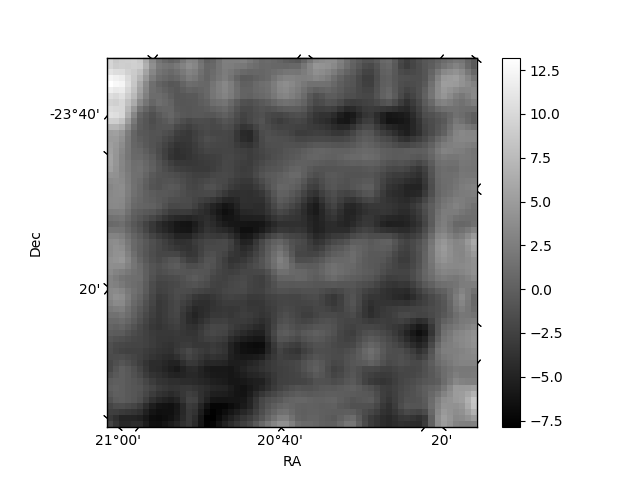
Histogram calculated using DETX and DETY for each event in the final _common_clean file
| Quadrant A | 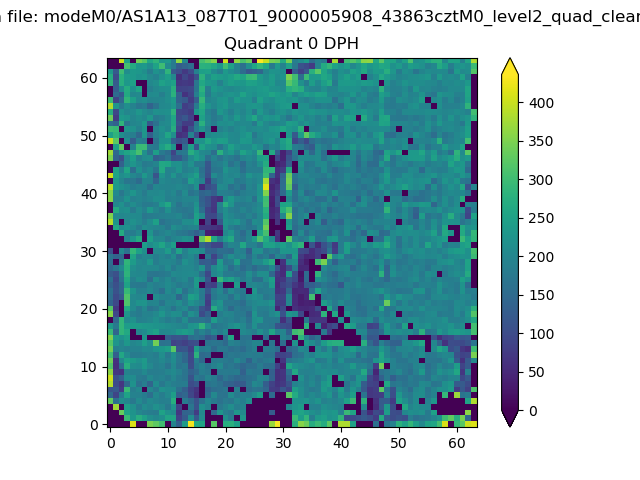 |
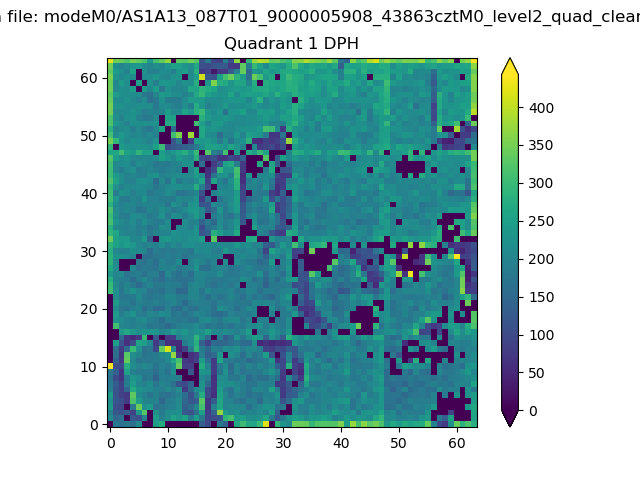 |
Quadrant B |
|---|---|---|---|
| Quadrant D | 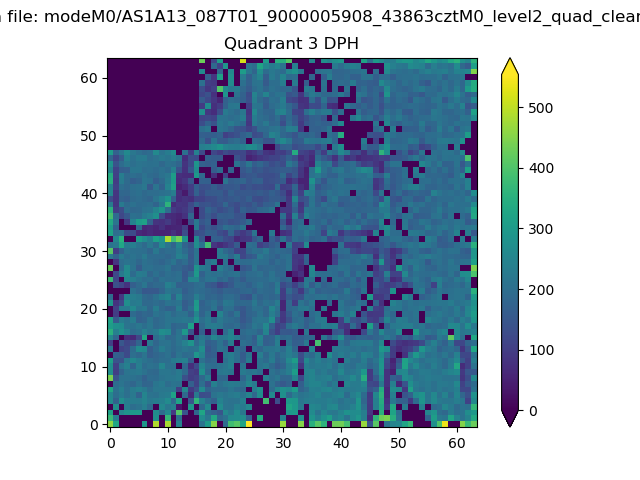 |
 |
Quadrant C |
| Plot type | Count rate plots | Images |
|---|---|---|
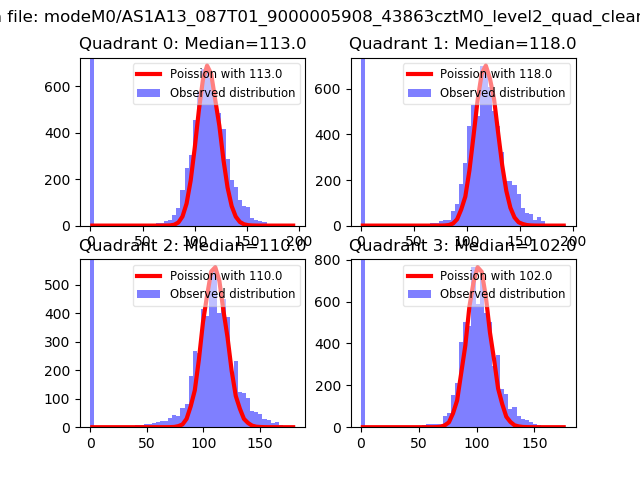
| Comparison with Poisson distribution Blue bars denote a histogram of data divided into 1 sec bins. Red curve is a Poisson curve with rate = median count rate of data. |
 |
 |
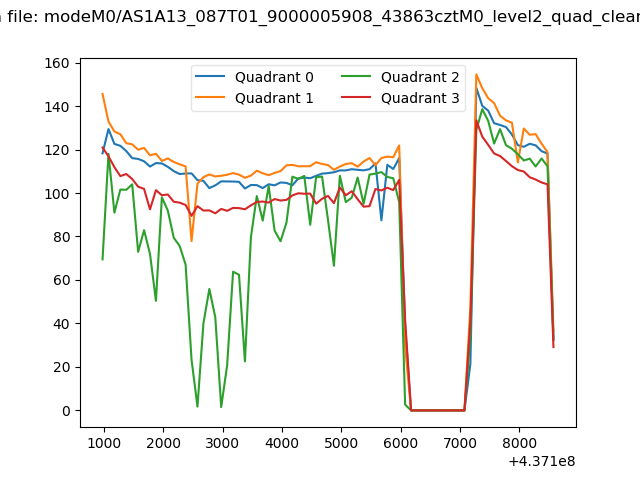
| Quadrant-wise count rates Data is divided into 100 sec bins |
 |
|
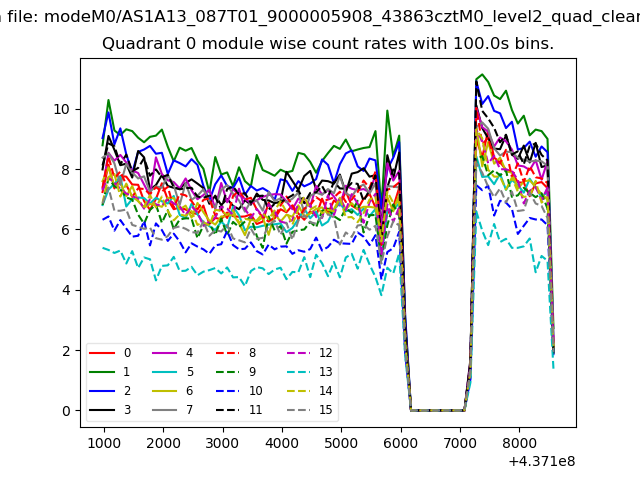
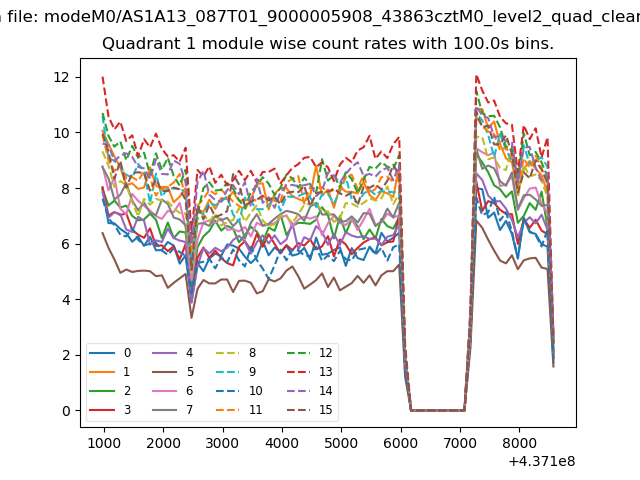
| Module-wise count rates for Quadrant A Data is divided into 100 sec bins |
 |
 |
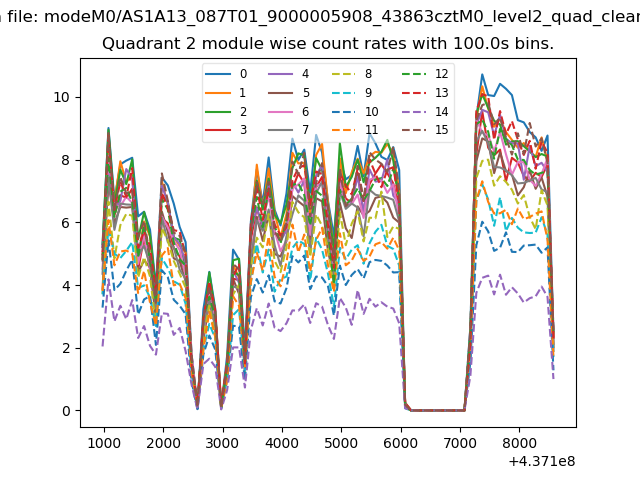
| Module-wise count rates for Quadrant B Data is divided into 100 sec bins |
 |
 |
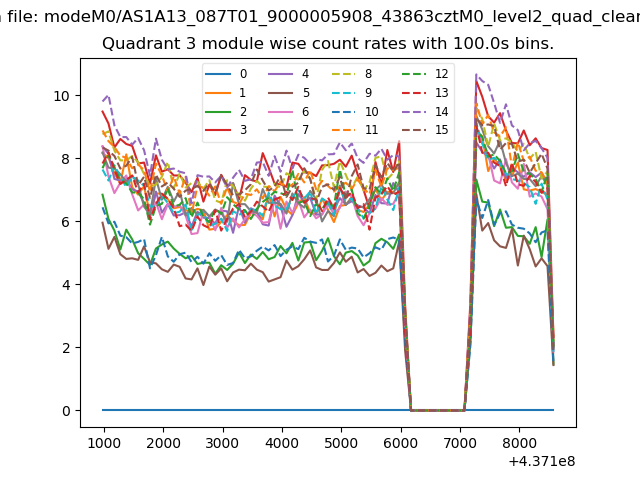
| Module-wise count rates for Quadrant C Data is divided into 100 sec bins |
 |
 |
| Module-wise count rates for Quadrant D Data is divided into 100 sec bins |
 |
 |
| Parameter | Plot |
|---|---|
| CZT HV Monitor | 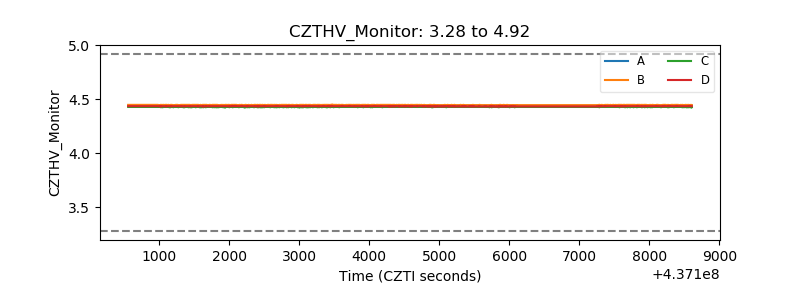 |
| D_VDD | 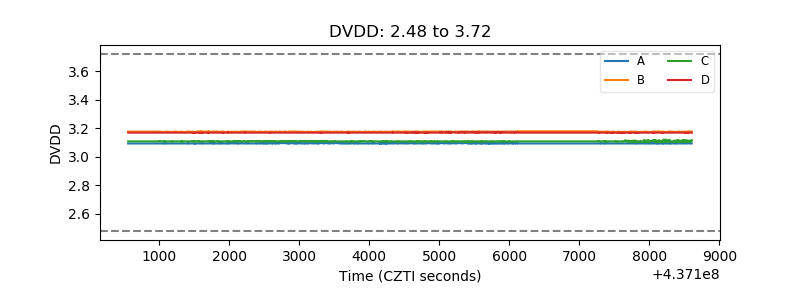 |
| Temperature 1 | 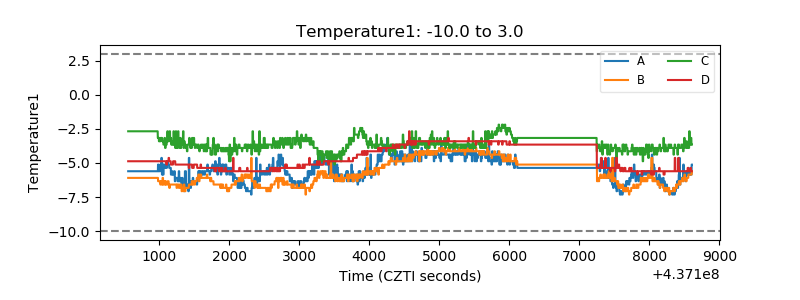 |
| Veto HV Monitor | 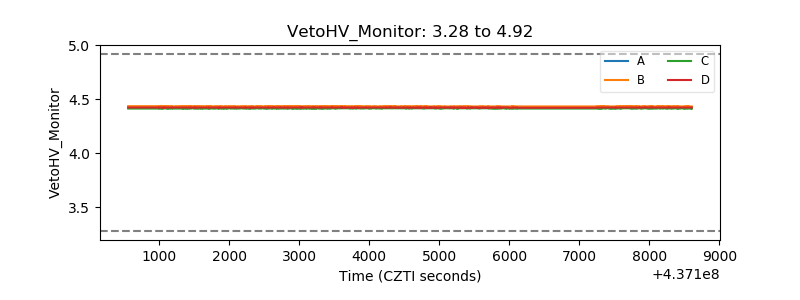 |
| Veto LLD | 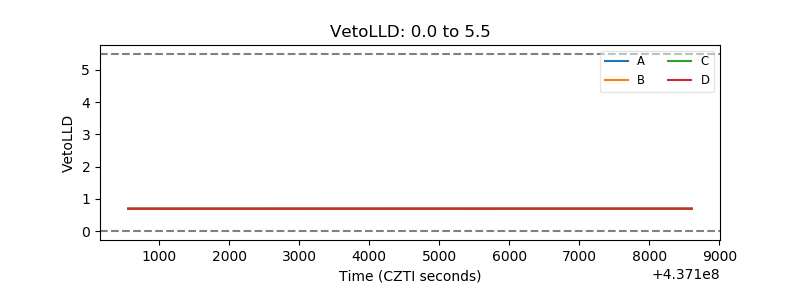 |
| Alpha Counter | 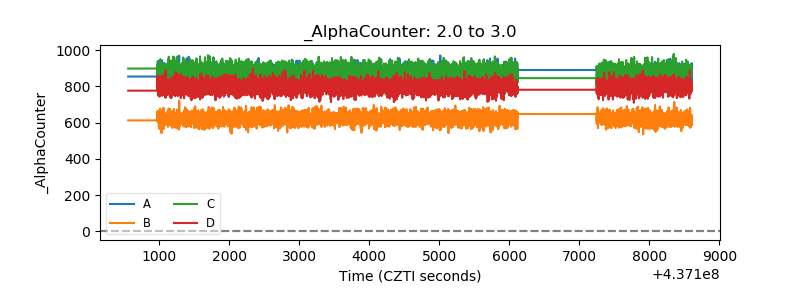 |
| _CPM_Rate | 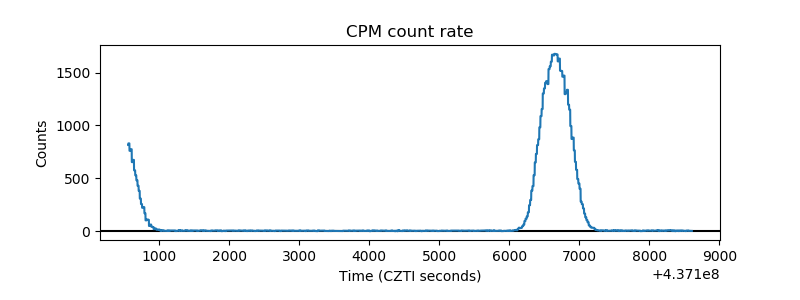 |
| CZT Counter | 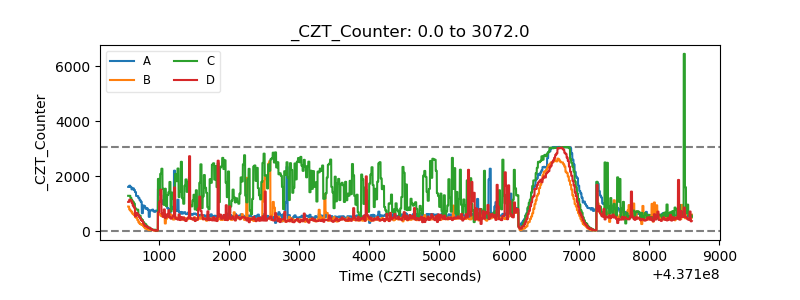 |
| +2.5 Volts monitor |  |
| +5 Volts monitor | 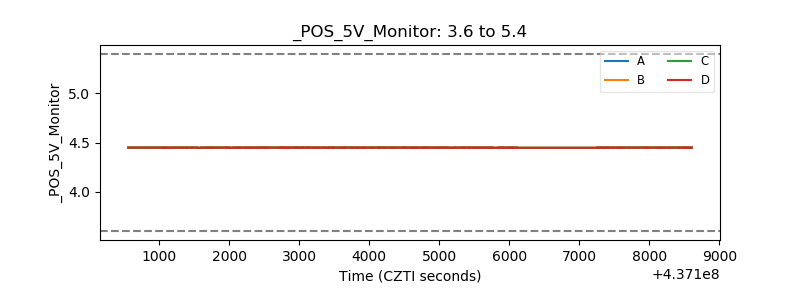 |
| _ROLL_ROT | 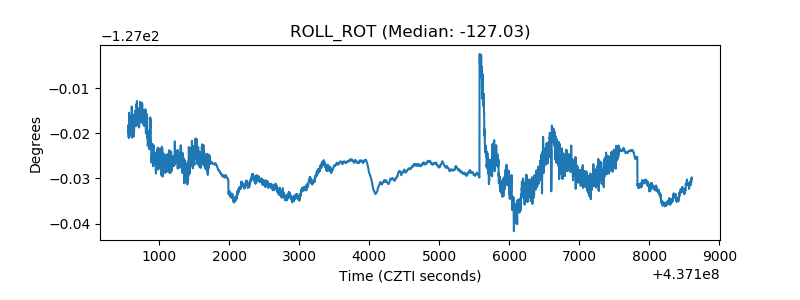 |
| _Roll_DEC | 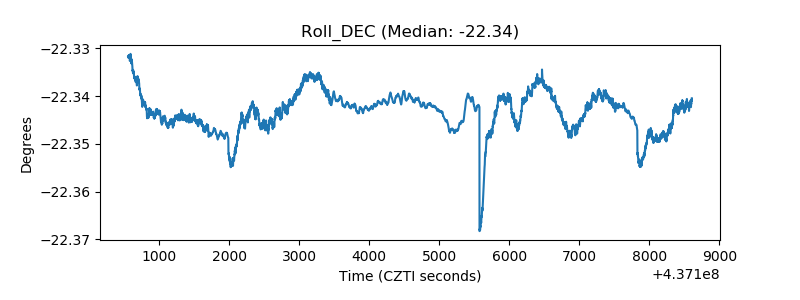 |
| _Roll_RA | 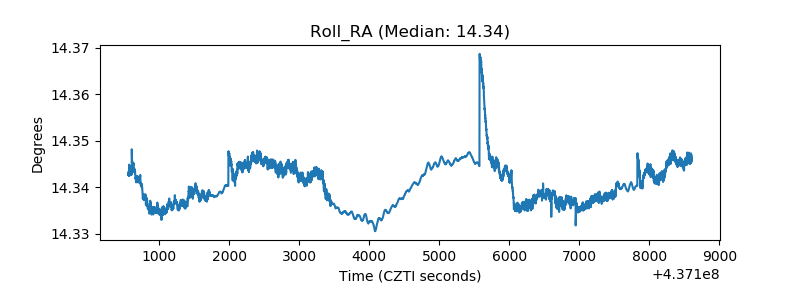 |
| Veto Counter | 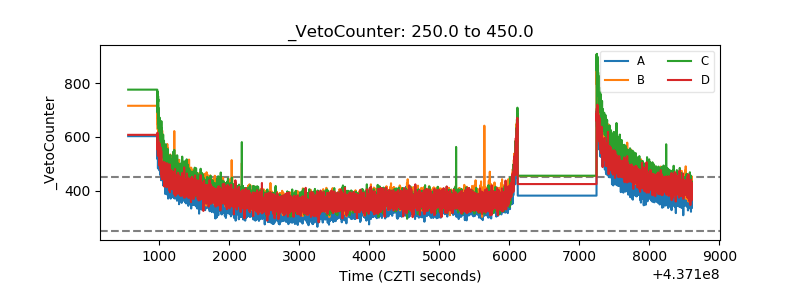 |