| Param | Original file | Final file |
|---|---|---|
| Filename | modeM0/AS1A13_087T01_9000005908_43864cztM0_level2.fits | modeM0/AS1A13_087T01_9000005908_43864cztM0_level2_quad_clean.evt |
| Size (bytes) | 466,773,120 | 114,791,040 |
| Size | 445.1 MB | 109.5 MB |
| Events in quadrant A | 4,069,626 | 774,301 |
| Events in quadrant B | 3,494,074 | 810,499 |
| Events in quadrant C | 4,926,825 | 758,612 |
| Events in quadrant D | 4,286,193 | 681,656 |
| Mode M9 | |||
|---|---|---|---|
| Quadrant | BADHDUFLAG | Total packets | Discarded packets |
| A | 0 | 15 | 0 |
| B | 0 | 16 | 0 |
| C | 0 | 16 | 0 |
| D | 0 | 16 | 0 |
| Mode M0 | |||
|---|---|---|---|
| Quadrant | BADHDUFLAG | Total packets | Discarded packets |
| A | 0 | 16020 | 2 |
| B | 0 | 14486 | 2 |
| C | 0 | 19119 | 2 |
| D | 0 | 17080 | 2 |
| Mode SS | |||
|---|---|---|---|
| Quadrant | BADHDUFLAG | Total packets | Discarded packets |
| A | 0 | 132 | 0 |
| B | 0 | 132 | 0 |
| C | 0 | 132 | 0 |
| D | 0 | 132 | 0 |
| Quadrant | Total seconds | Saturated seconds | Saturation percentage |
|---|---|---|---|
| A | 6466 | 85 | 1.314569% |
| B | 6466 | 115 | 1.778534% |
| C | 6466 | 194 | 3.000309% |
| D | 6465 | 279 | 4.315545% |
Noise dominated data is calculated using 1-second bins in cleaned event files. If a bin has >2000 counts, and if more than 50% of those come from <1% of pixels, then it is considered to be noise-dominated and hence unusable.
| Quadrant | # 1 sec bins | Bins with >0 counts | Bins with >2000 counts | High rate bins dominated by noise | Noise dominated (total time) | Noise dominated (detector-on time) | Marked lightcurve |
|---|---|---|---|---|---|---|---|
| A | 7661 | 6466 | 5 | 5 | 0.07% | 0.08% | 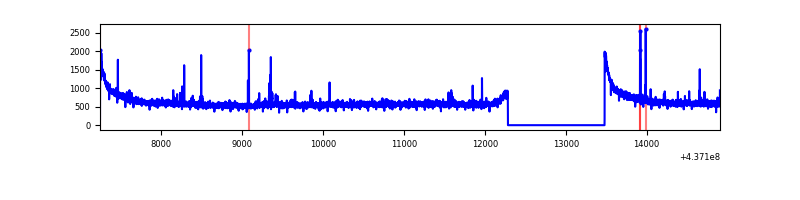 |
| B | 7661 | 6466 | 44 | 44 | 0.57% | 0.68% | 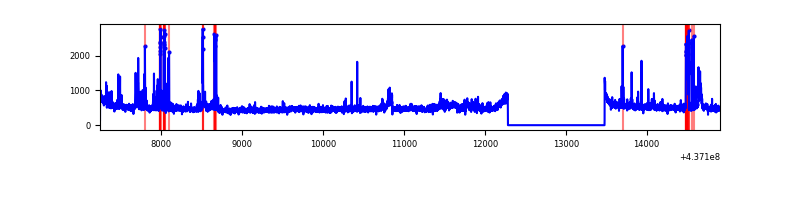 |
| C | 7661 | 6466 | 121 | 121 | 1.58% | 1.87% | 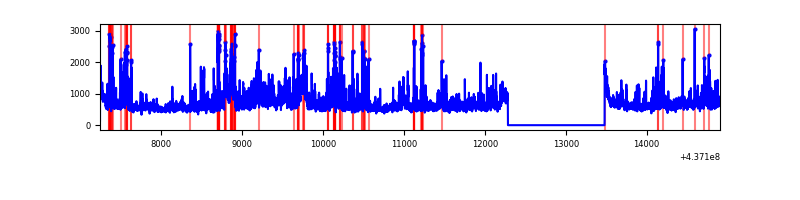 |
| D | 7660 | 6465 | 227 | 227 | 2.96% | 3.51% | 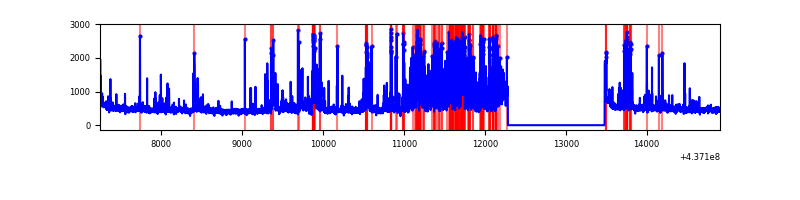 |
Top three noisy pixels from each quadrant. If the there are fewer than three noisy pixels in the level2.evt file, extra rows are filled as -1
| Pixel properties | Quadrant properties | ||||||
|---|---|---|---|---|---|---|---|
| Quadrant | DetID | PixID | Counts | Sigma | Mean | Median | Sigma |
| A | 10 | 83 | 1004376 | 6354.21 | 769 | 753 | 157.9 |
| A | 13 | 248 | 21435 | 130.94 | 769 | 753 | 157.9 |
| A | 7 | 3 | 19664 | 119.73 | 769 | 753 | 157.9 |
| B | 0 | 183 | 200962 | 1334.05 | 773 | 750 | 150.1 |
| B | 4 | 170 | 151059 | 1001.54 | 773 | 750 | 150.1 |
| B | 5 | 235 | 68023 | 448.25 | 773 | 750 | 150.1 |
| C | 3 | 233 | 1594393 | 8921.0 | 761 | 766 | 178.6 |
| C | 0 | 239 | 154119 | 858.46 | 761 | 766 | 178.6 |
| C | 10 | 22 | 90471 | 502.16 | 761 | 766 | 178.6 |
| D | 10 | 102 | 289277 | 1548.97 | 749 | 728 | 186.3 |
| D | 5 | 235 | 233295 | 1248.45 | 749 | 728 | 186.3 |
| D | 1 | 52 | 181123 | 968.39 | 749 | 728 | 186.3 |
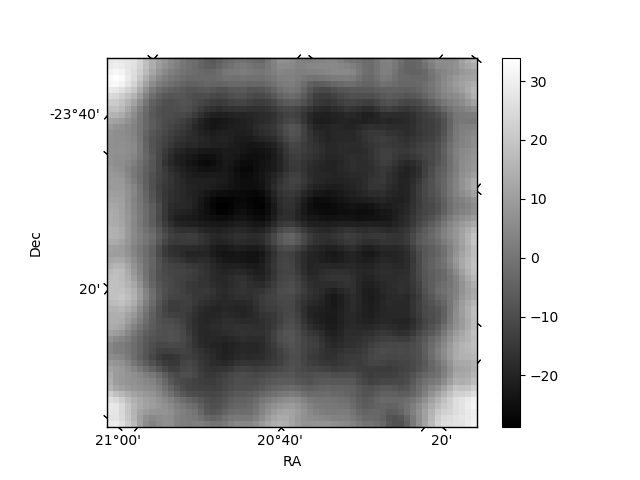
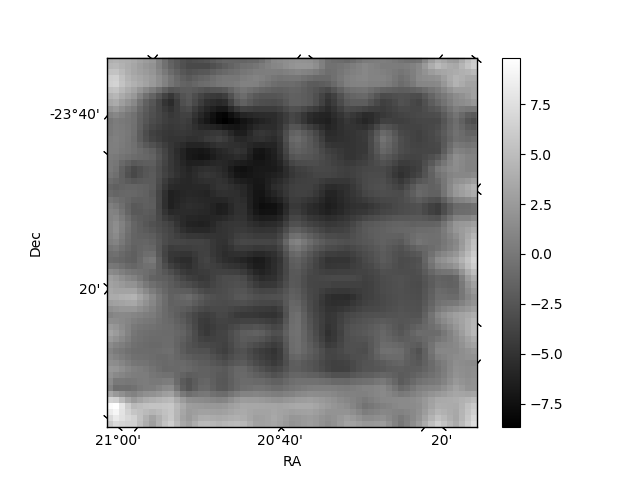
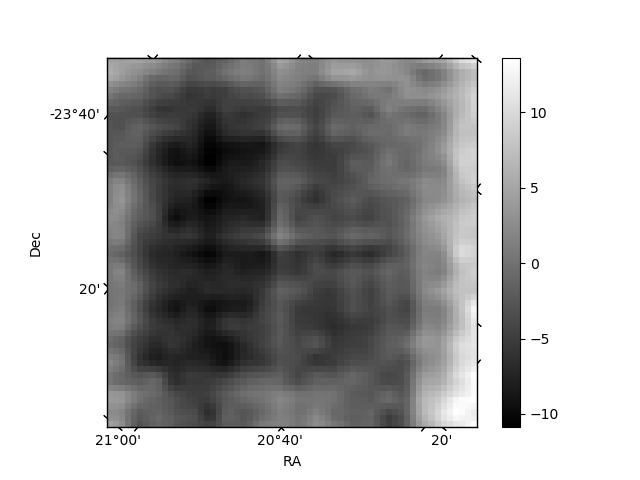
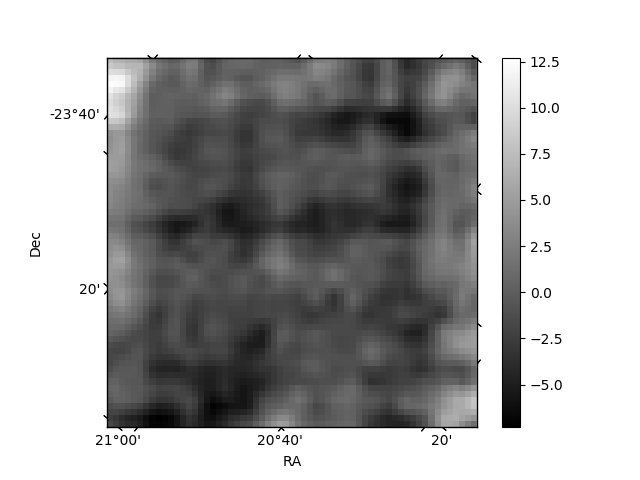
Histogram calculated using DETX and DETY for each event in the final _common_clean file
| Quadrant A | 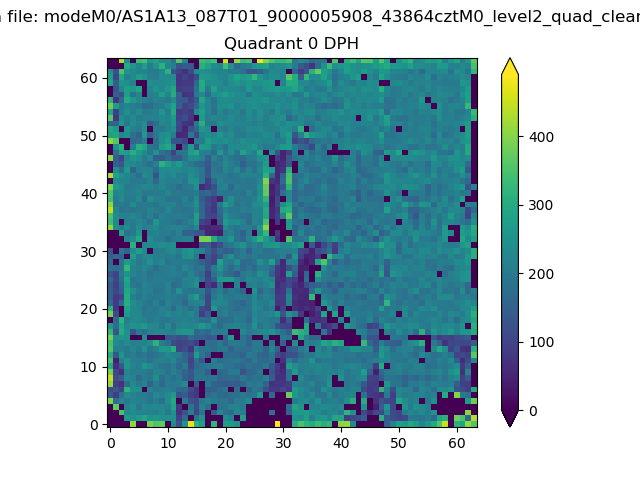 |
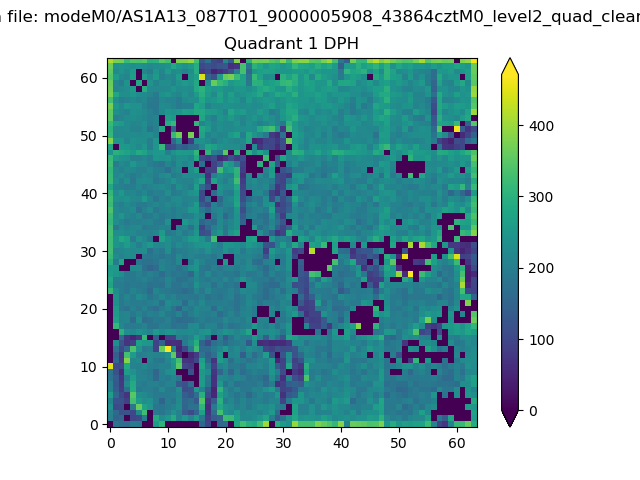 |
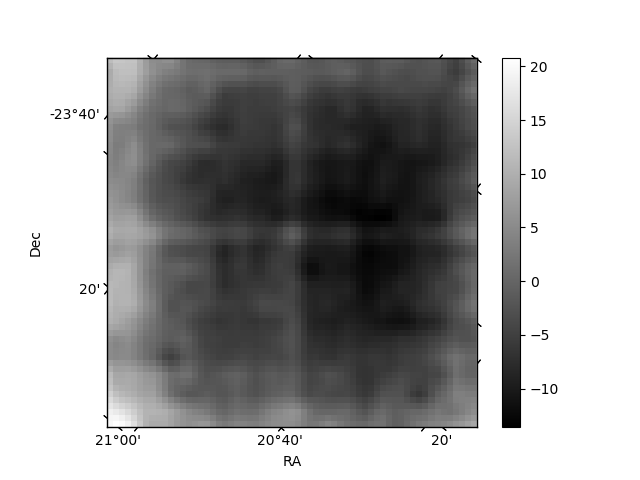
Quadrant B |
|---|---|---|---|
| Quadrant D | 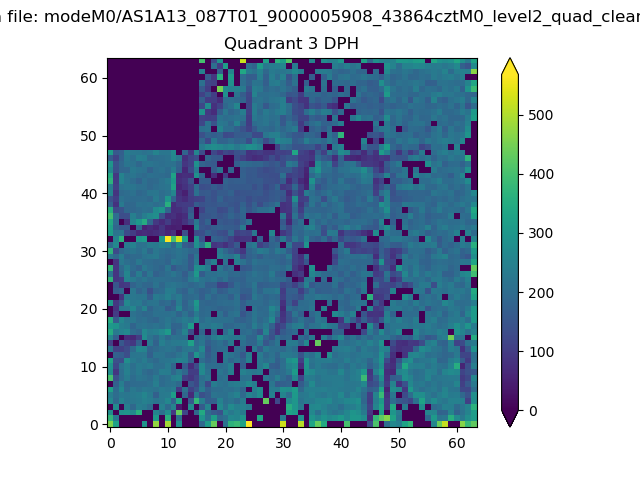 |
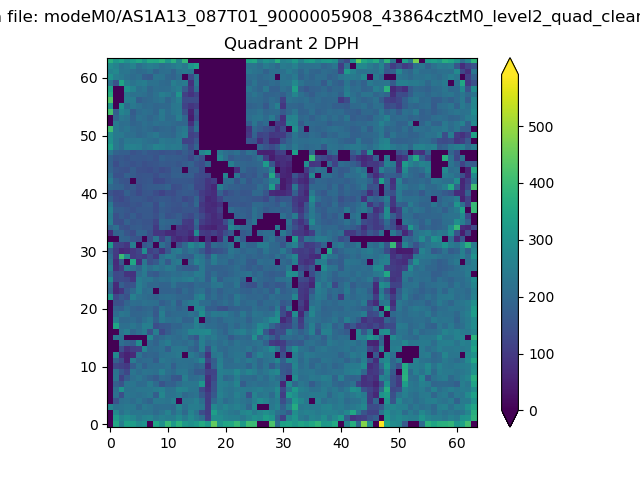 |
Quadrant C |
| Plot type | Count rate plots | Images |
|---|---|---|
| Comparison with Poisson distribution Blue bars denote a histogram of data divided into 1 sec bins. Red curve is a Poisson curve with rate = median count rate of data. |
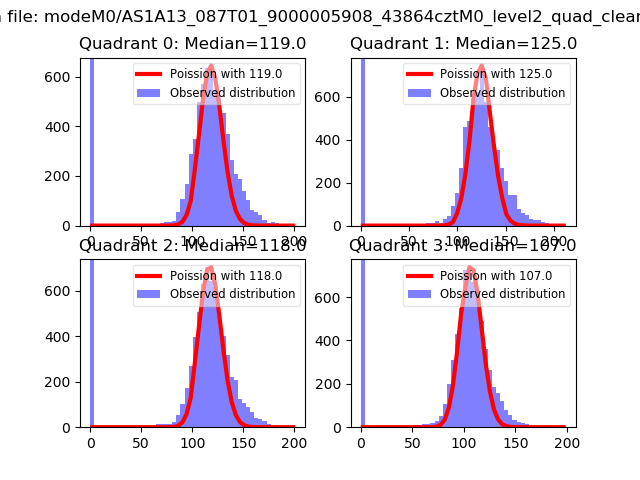 |
 |
| Quadrant-wise count rates Data is divided into 100 sec bins |
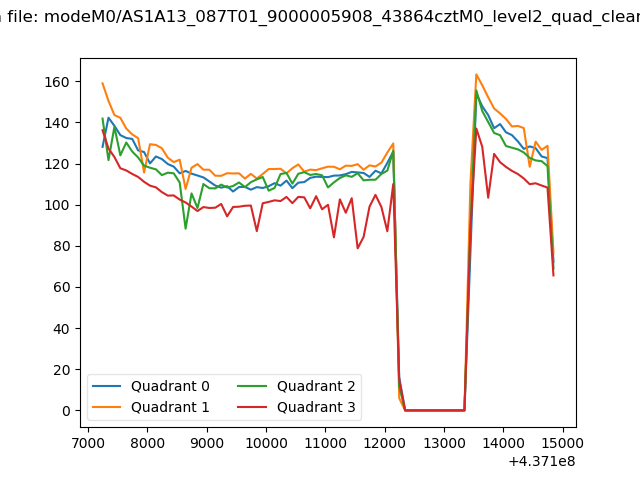 |
|
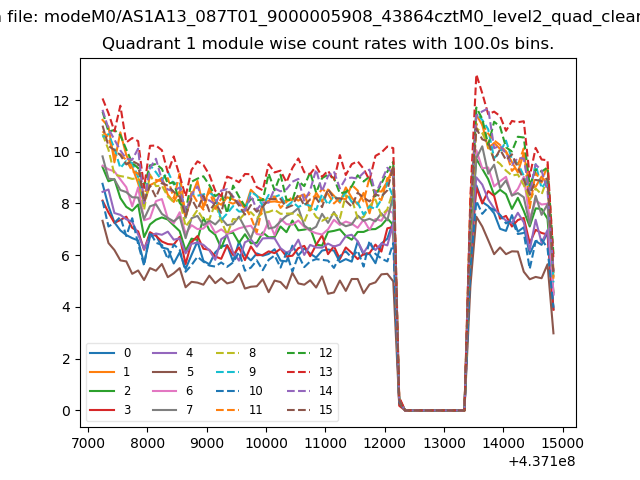
| Module-wise count rates for Quadrant A Data is divided into 100 sec bins |
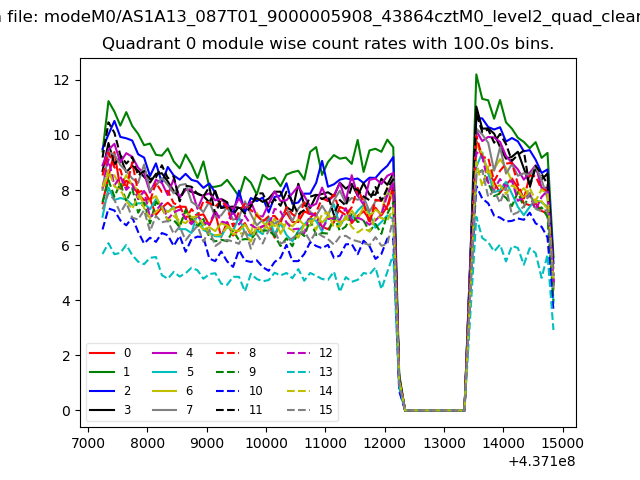 |
 |
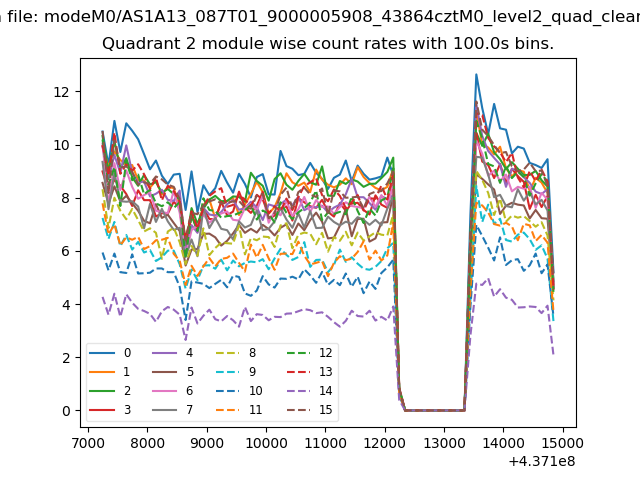
| Module-wise count rates for Quadrant B Data is divided into 100 sec bins |
 |
 |
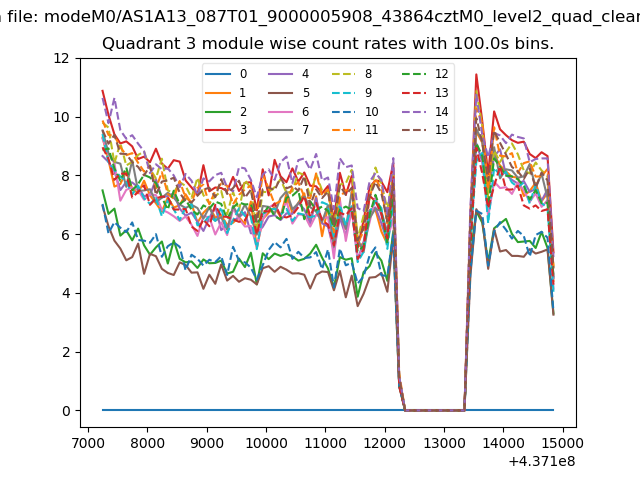
| Module-wise count rates for Quadrant C Data is divided into 100 sec bins |
 |
 |
| Module-wise count rates for Quadrant D Data is divided into 100 sec bins |
 |
 |
| Parameter | Plot |
|---|---|
| CZT HV Monitor |  |
| D_VDD | 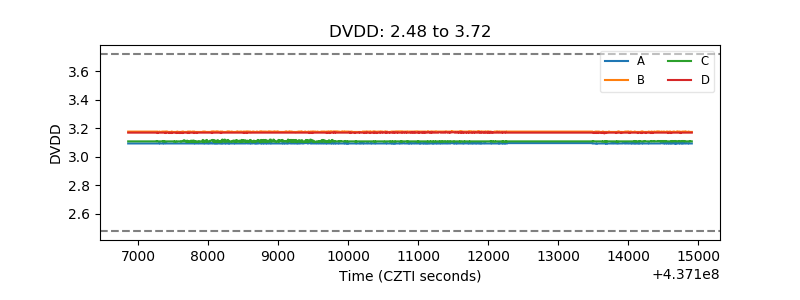 |
| Temperature 1 | 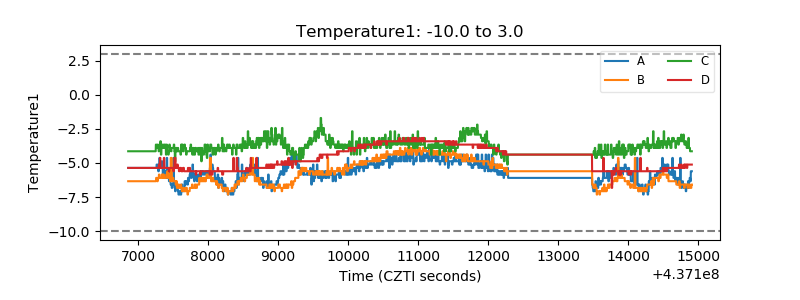 |
| Veto HV Monitor | 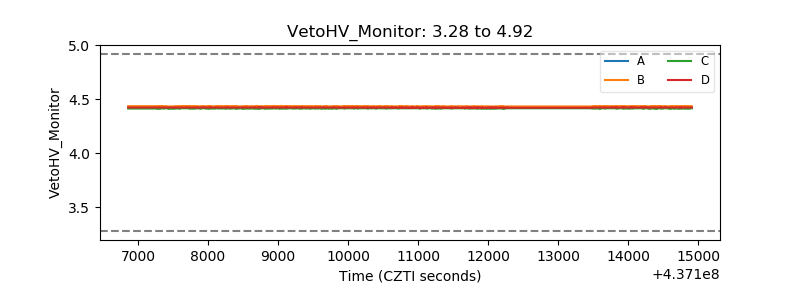 |
| Veto LLD | 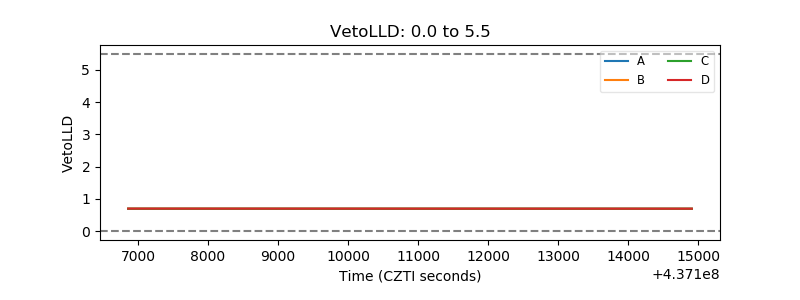 |
| Alpha Counter | 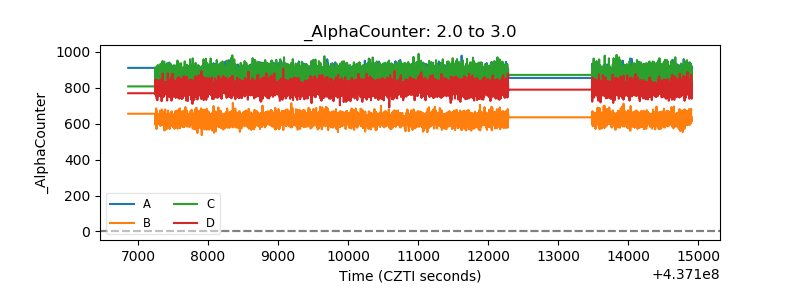 |
| _CPM_Rate | 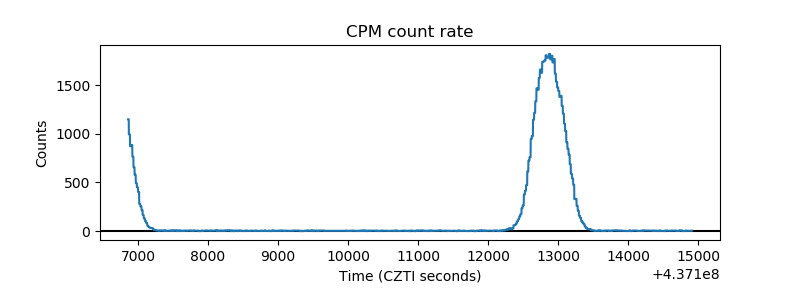 |
| CZT Counter | 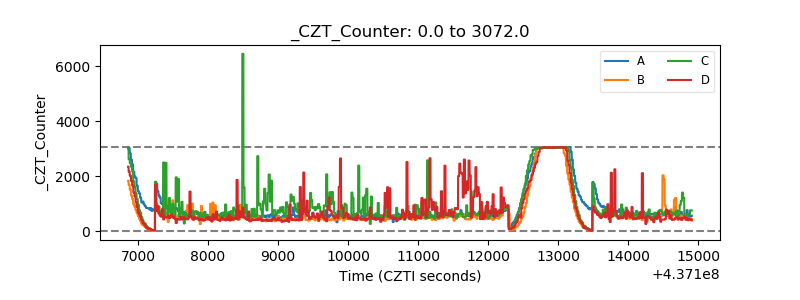 |
| +2.5 Volts monitor | 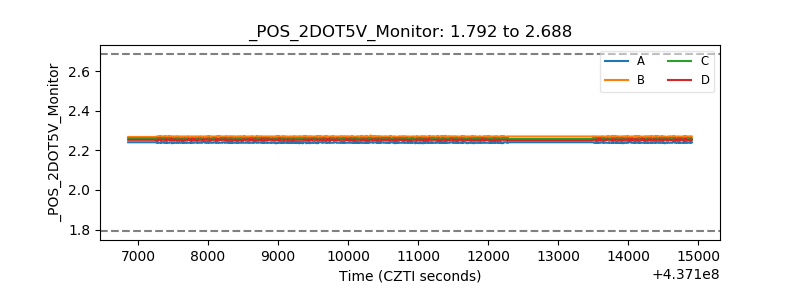 |
| +5 Volts monitor | 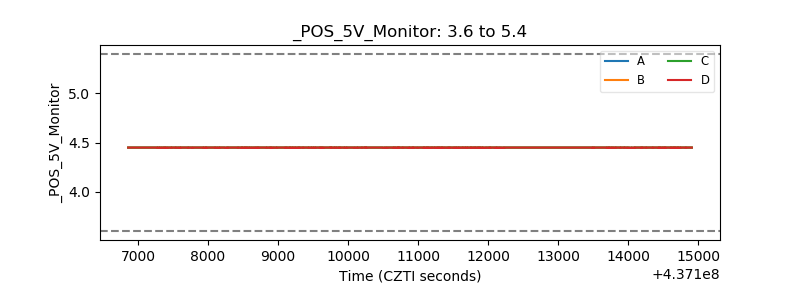 |
| _ROLL_ROT | 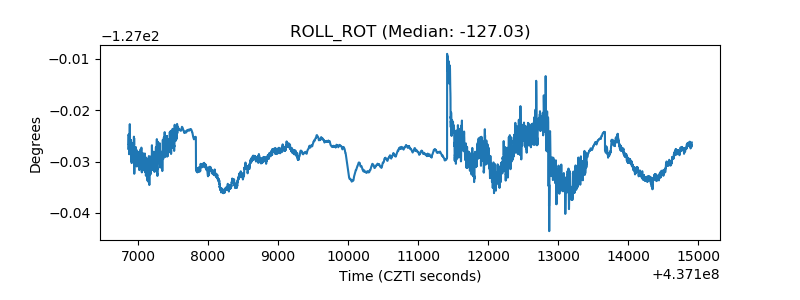 |
| _Roll_DEC | 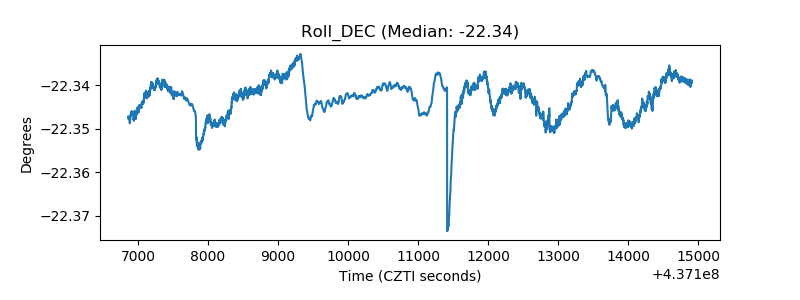 |
| _Roll_RA | 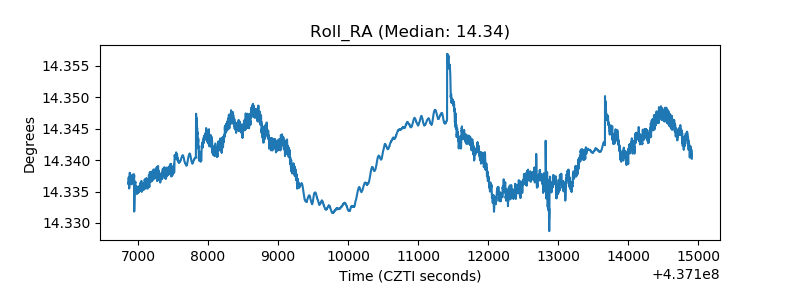 |
| Veto Counter | 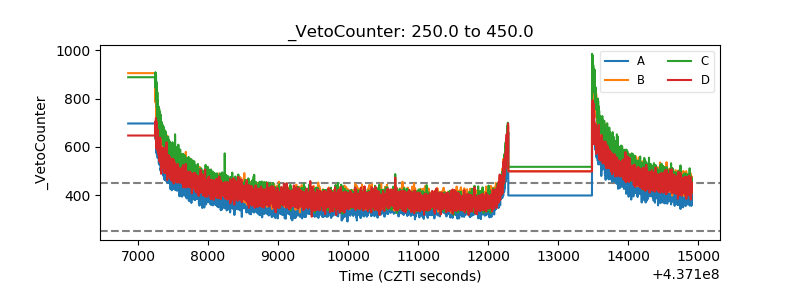 |