| Param | Original file | Final file |
|---|---|---|
| Filename | modeM0/AS1A13_087T01_9000005908_43865cztM0_level2.fits | modeM0/AS1A13_087T01_9000005908_43865cztM0_level2_quad_clean.evt |
| Size (bytes) | 449,239,680 | 113,025,600 |
| Size | 428.4 MB | 107.8 MB |
| Events in quadrant A | 3,962,001 | 763,893 |
| Events in quadrant B | 3,642,462 | 790,002 |
| Events in quadrant C | 4,460,326 | 755,656 |
| Events in quadrant D | 4,080,012 | 677,692 |
| Mode M9 | |||
|---|---|---|---|
| Quadrant | BADHDUFLAG | Total packets | Discarded packets |
| A | 0 | 12 | 0 |
| B | 0 | 12 | 0 |
| C | 0 | 12 | 0 |
| D | 0 | 12 | 0 |
| Mode M0 | |||
|---|---|---|---|
| Quadrant | BADHDUFLAG | Total packets | Discarded packets |
| A | 0 | 15785 | 1 |
| B | 0 | 14746 | 1 |
| C | 0 | 17581 | 2 |
| D | 0 | 16223 | 2 |
| Mode SS | |||
|---|---|---|---|
| Quadrant | BADHDUFLAG | Total packets | Discarded packets |
| A | 0 | 126 | 0 |
| B | 0 | 126 | 0 |
| C | 0 | 128 | 0 |
| D | 0 | 128 | 0 |
| Quadrant | Total seconds | Saturated seconds | Saturation percentage |
|---|---|---|---|
| A | 6240 | 124 | 1.987179% |
| B | 6240 | 236 | 3.782051% |
| C | 6240 | 159 | 2.548077% |
| D | 6240 | 250 | 4.006410% |
Noise dominated data is calculated using 1-second bins in cleaned event files. If a bin has >2000 counts, and if more than 50% of those come from <1% of pixels, then it is considered to be noise-dominated and hence unusable.
| Quadrant | # 1 sec bins | Bins with >0 counts | Bins with >2000 counts | High rate bins dominated by noise | Noise dominated (total time) | Noise dominated (detector-on time) | Marked lightcurve |
|---|---|---|---|---|---|---|---|
| A | 7425 | 6240 | 4 | 4 | 0.05% | 0.06% | 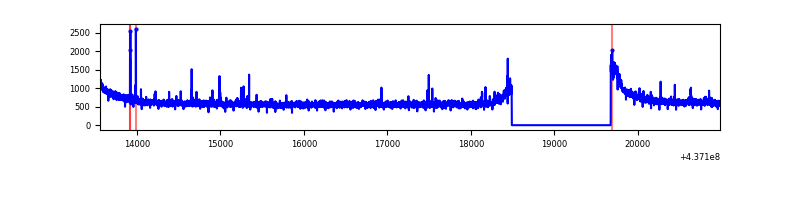 |
| B | 7425 | 6240 | 93 | 93 | 1.25% | 1.49% | 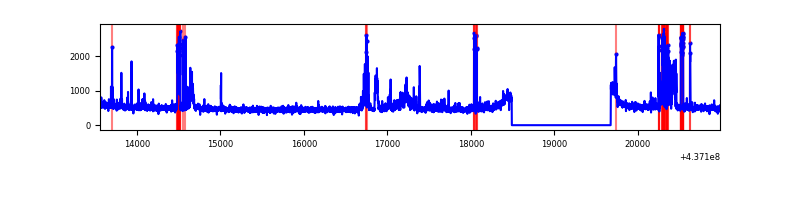 |
| C | 7425 | 6240 | 41 | 41 | 0.55% | 0.66% | 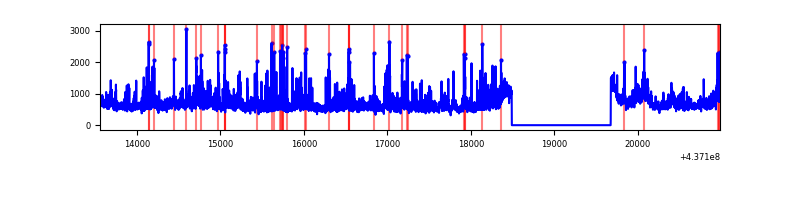 |
| D | 7425 | 6240 | 136 | 136 | 1.83% | 2.18% | 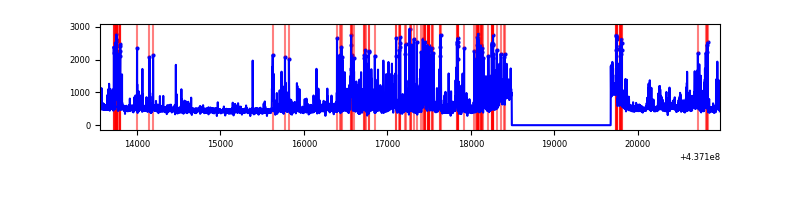 |
Top three noisy pixels from each quadrant. If the there are fewer than three noisy pixels in the level2.evt file, extra rows are filled as -1
| Pixel properties | Quadrant properties | ||||||
|---|---|---|---|---|---|---|---|
| Quadrant | DetID | PixID | Counts | Sigma | Mean | Median | Sigma |
| A | 10 | 83 | 926331 | 5892.36 | 763 | 748 | 157.1 |
| A | 2 | 79 | 26562 | 164.33 | 763 | 748 | 157.1 |
| A | 7 | 3 | 15107 | 91.41 | 763 | 748 | 157.1 |
| B | 5 | 235 | 260200 | 1759.75 | 763 | 740 | 147.4 |
| B | 0 | 183 | 207801 | 1404.36 | 763 | 740 | 147.4 |
| B | 4 | 170 | 134243 | 905.47 | 763 | 740 | 147.4 |
| C | 3 | 233 | 1217527 | 6824.46 | 761 | 766 | 178.3 |
| C | 14 | 254 | 217699 | 1216.71 | 761 | 766 | 178.3 |
| C | 1 | 16 | 15274 | 81.37 | 761 | 766 | 178.3 |
| D | 2 | 249 | 273750 | 1468.61 | 748 | 729 | 185.9 |
| D | 12 | 233 | 199471 | 1069.06 | 748 | 729 | 185.9 |
| D | 13 | 249 | 184734 | 989.78 | 748 | 729 | 185.9 |
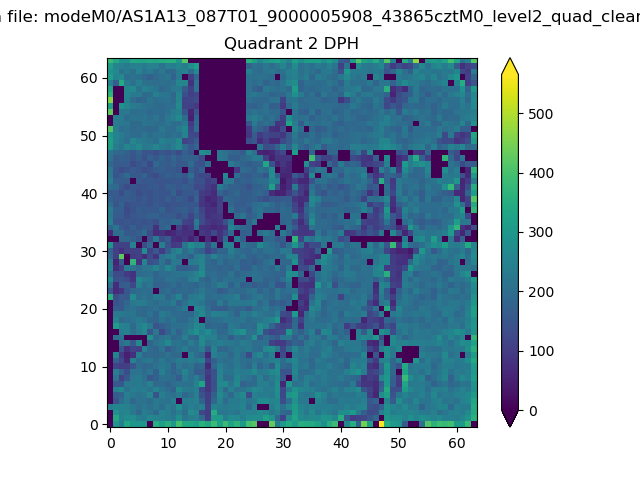
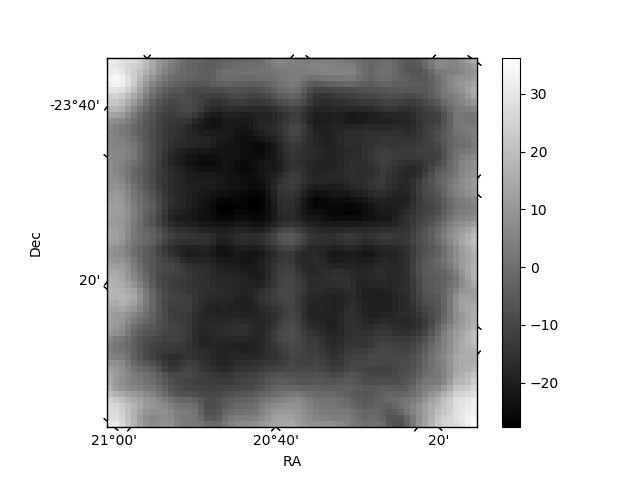
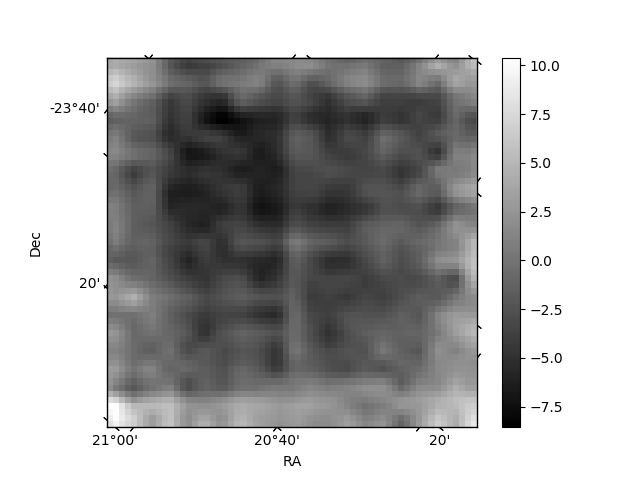
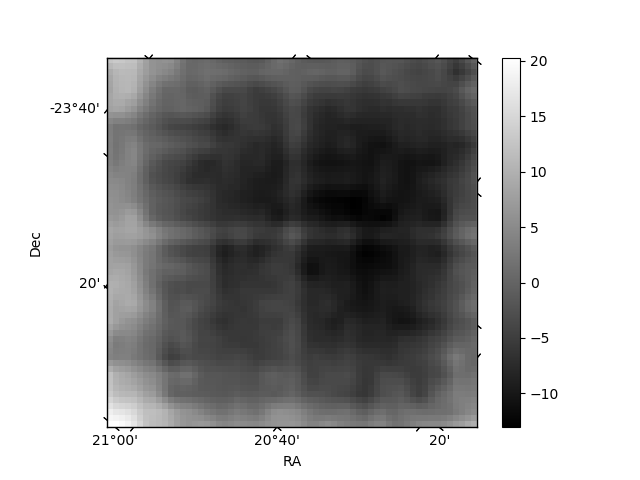
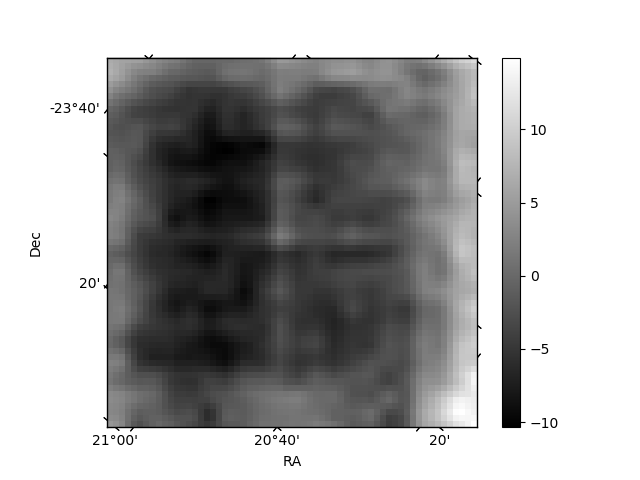
Histogram calculated using DETX and DETY for each event in the final _common_clean file
| Quadrant A | 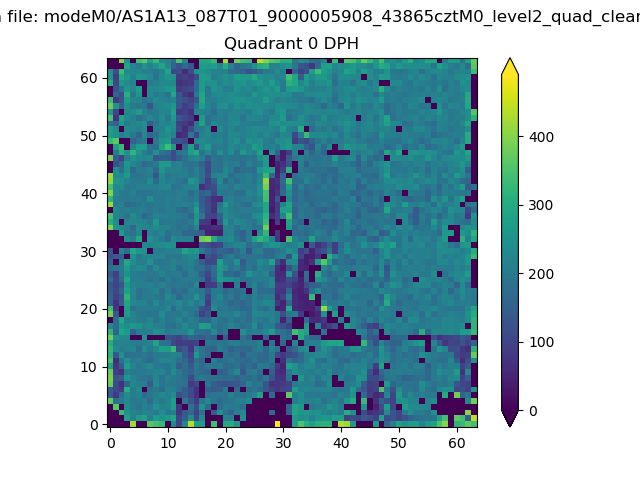 |
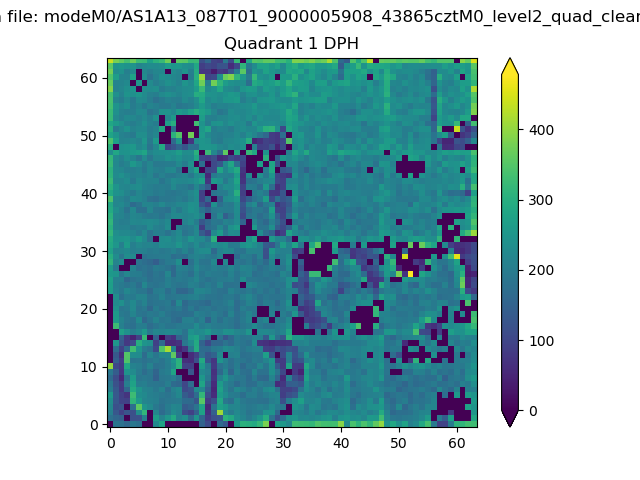 |
Quadrant B |
|---|---|---|---|
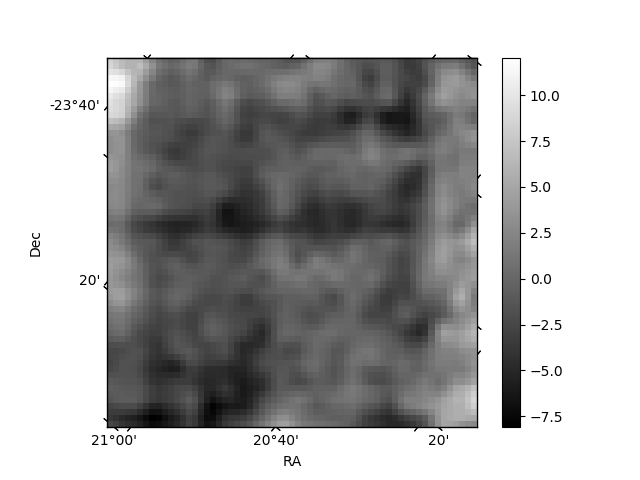
| Quadrant D | 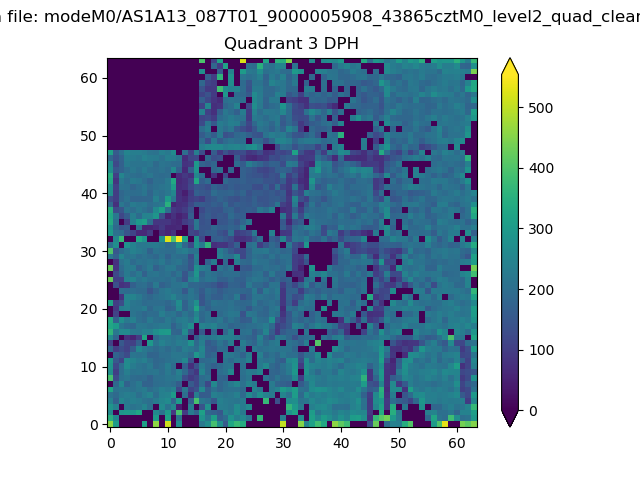 |
 |
Quadrant C |
| Plot type | Count rate plots | Images |
|---|---|---|
| Comparison with Poisson distribution Blue bars denote a histogram of data divided into 1 sec bins. Red curve is a Poisson curve with rate = median count rate of data. |
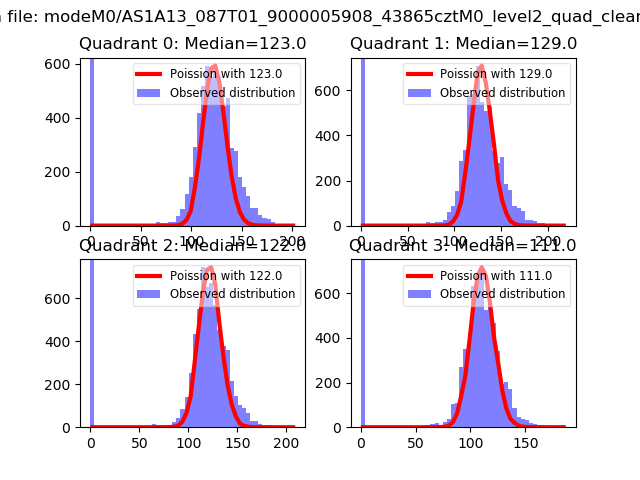 |
 |
| Quadrant-wise count rates Data is divided into 100 sec bins |
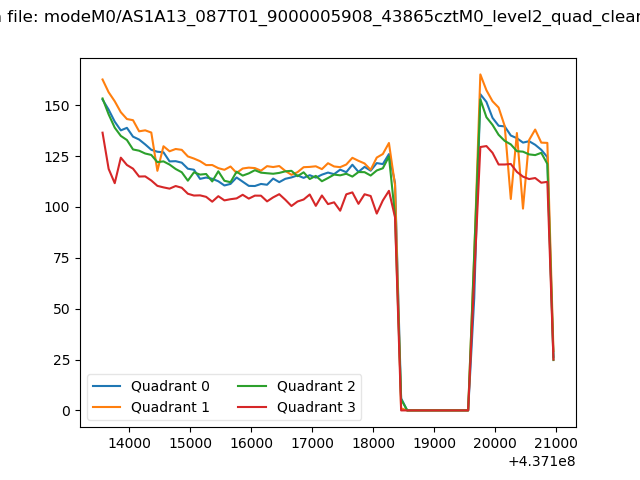 |
|
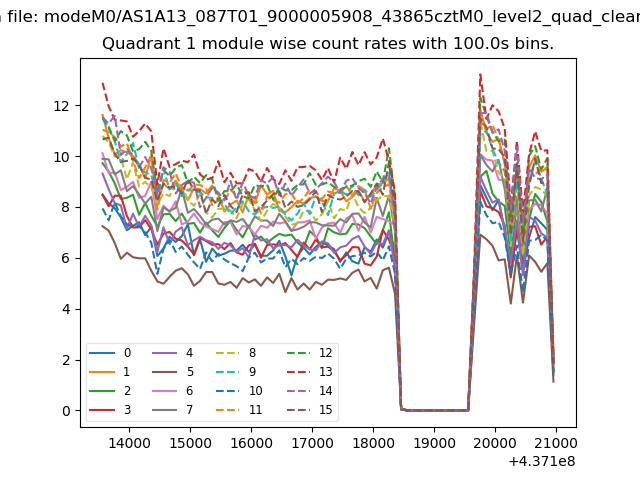
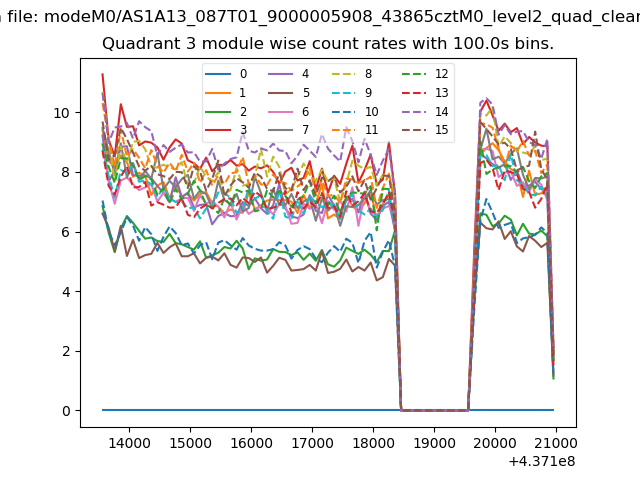
| Module-wise count rates for Quadrant A Data is divided into 100 sec bins |
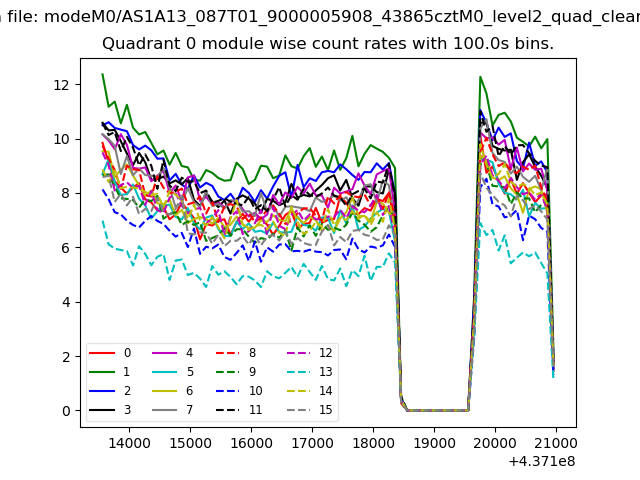 |
 |
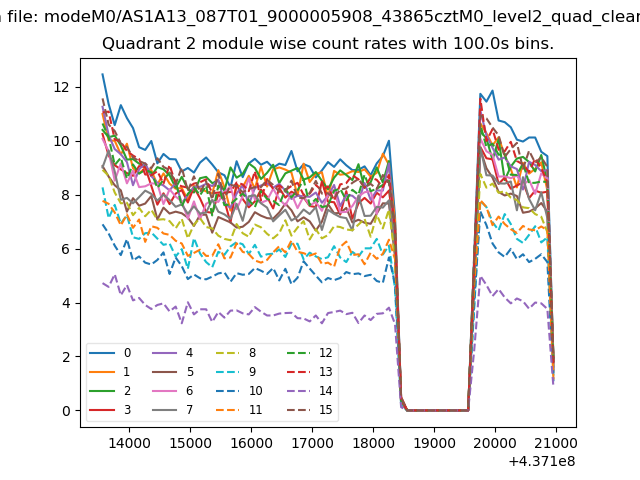
| Module-wise count rates for Quadrant B Data is divided into 100 sec bins |
 |
 |
| Module-wise count rates for Quadrant C Data is divided into 100 sec bins |
 |
 |
| Module-wise count rates for Quadrant D Data is divided into 100 sec bins |
 |
 |
| Parameter | Plot |
|---|---|
| CZT HV Monitor | 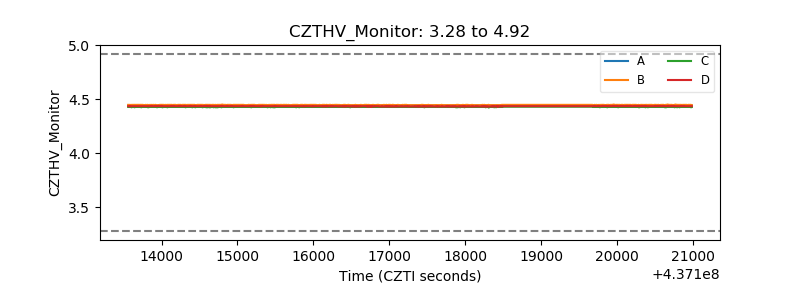 |
| D_VDD | 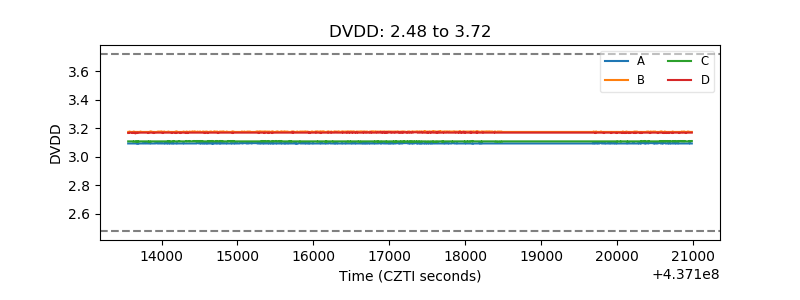 |
| Temperature 1 | 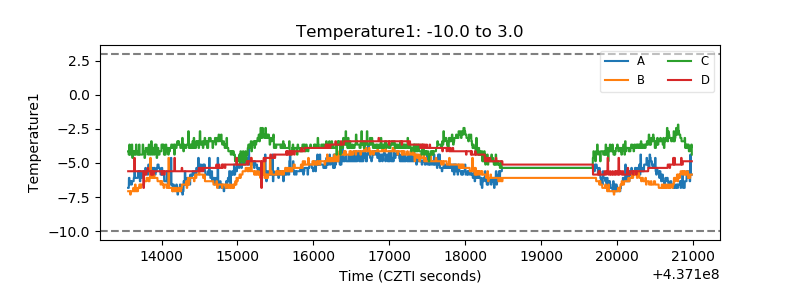 |
| Veto HV Monitor | 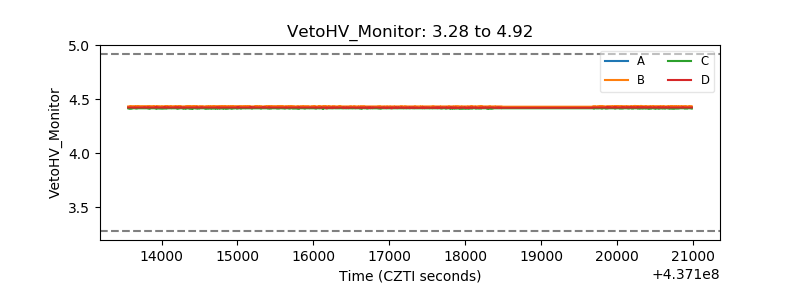 |
| Veto LLD | 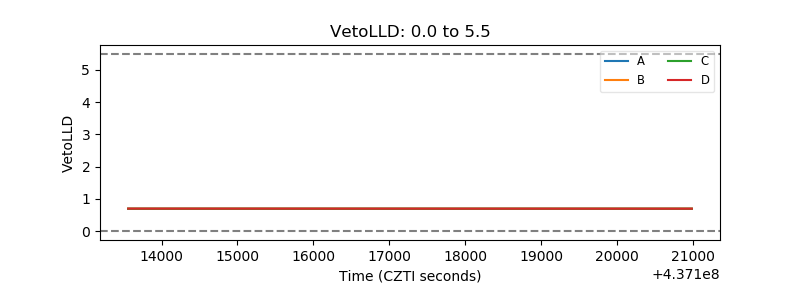 |
| Alpha Counter | 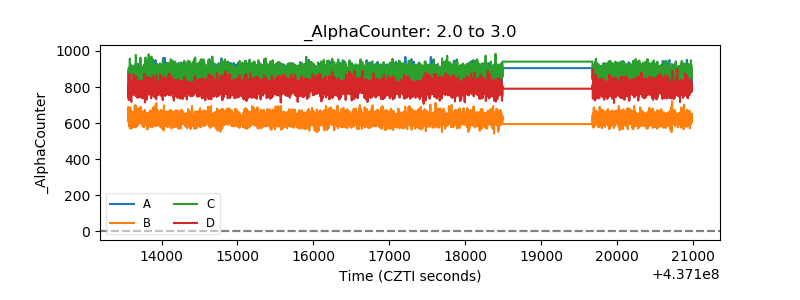 |
| _CPM_Rate | 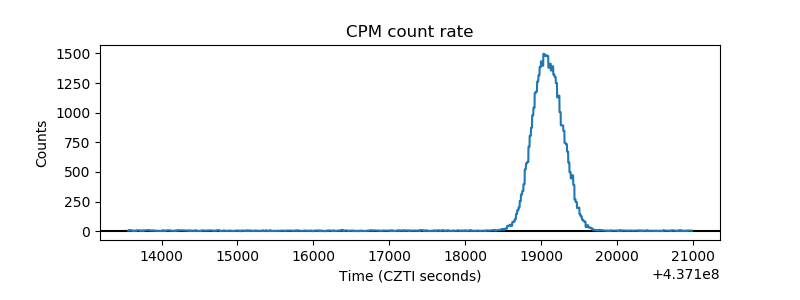 |
| CZT Counter | 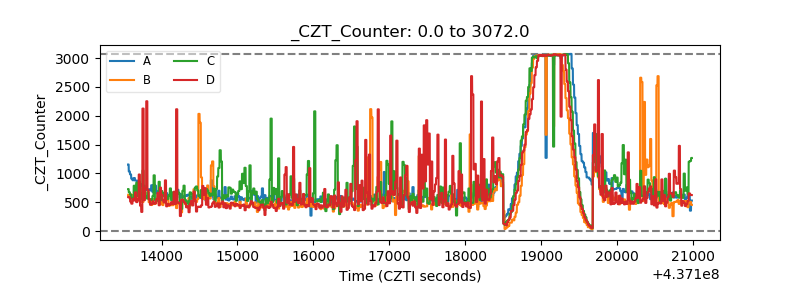 |
| +2.5 Volts monitor | 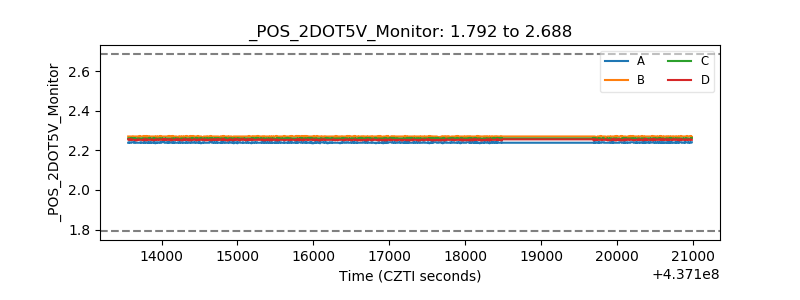 |
| +5 Volts monitor | 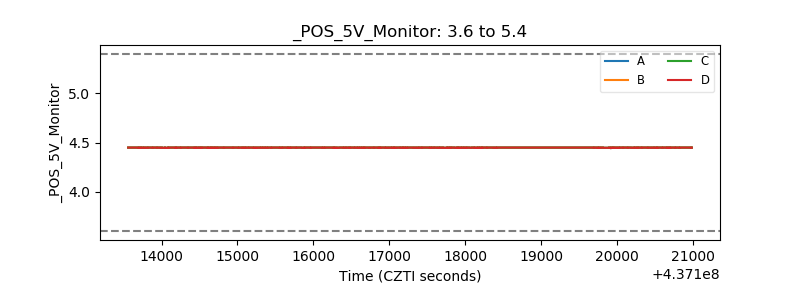 |
| _ROLL_ROT | 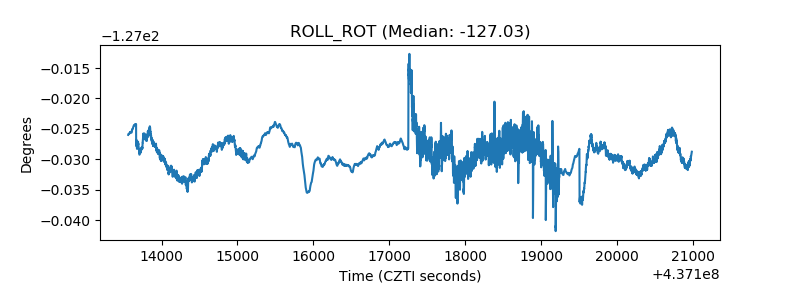 |
| _Roll_DEC | 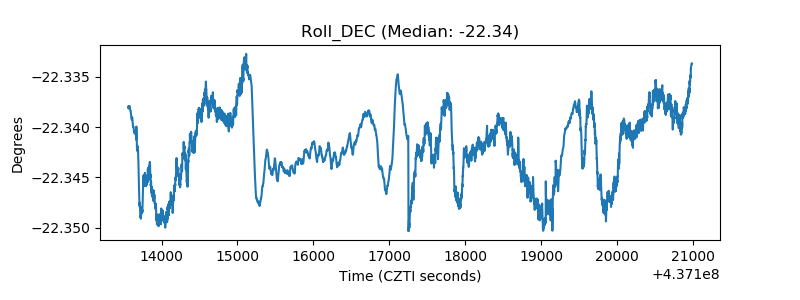 |
| _Roll_RA | 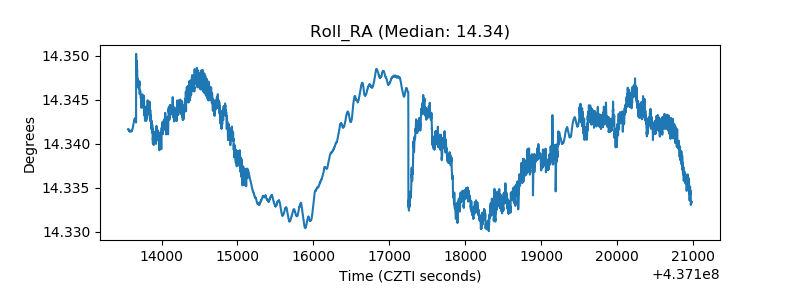 |
| Veto Counter | 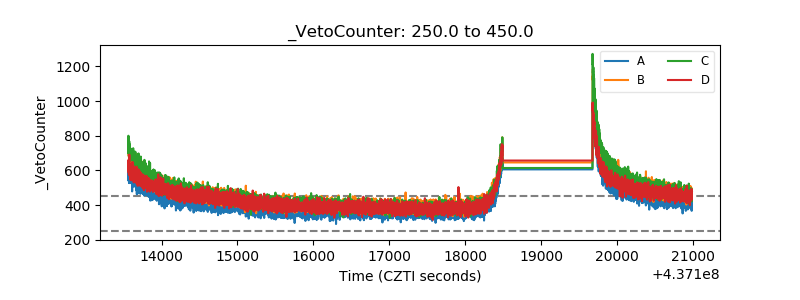 |