| Param | Original file | Final file |
|---|---|---|
| Filename | modeM0/AS1A13_087T01_9000005908_43866cztM0_level2.fits | modeM0/AS1A13_087T01_9000005908_43866cztM0_level2_quad_clean.evt |
| Size (bytes) | 509,641,920 | 112,037,760 |
| Size | 486.0 MB | 106.8 MB |
| Events in quadrant A | 4,172,320 | 762,323 |
| Events in quadrant B | 3,668,829 | 787,805 |
| Events in quadrant C | 5,826,900 | 730,505 |
| Events in quadrant D | 4,705,633 | 670,090 |
| Mode M9 | |||
|---|---|---|---|
| Quadrant | BADHDUFLAG | Total packets | Discarded packets |
| A | 0 | 19 | 0 |
| B | 0 | 20 | 0 |
| C | 0 | 20 | 0 |
| D | 0 | 20 | 0 |
| Mode M0 | |||
|---|---|---|---|
| Quadrant | BADHDUFLAG | Total packets | Discarded packets |
| A | 0 | 16607 | 2 |
| B | 0 | 14884 | 2 |
| C | 0 | 21862 | 2 |
| D | 0 | 18200 | 2 |
| Mode SS | |||
|---|---|---|---|
| Quadrant | BADHDUFLAG | Total packets | Discarded packets |
| A | 0 | 128 | 0 |
| B | 0 | 128 | 0 |
| C | 0 | 128 | 0 |
| D | 0 | 128 | 0 |
| Quadrant | Total seconds | Saturated seconds | Saturation percentage |
|---|---|---|---|
| A | 6338 | 209 | 3.297570% |
| B | 6338 | 288 | 4.544020% |
| C | 6338 | 463 | 7.305144% |
| D | 6338 | 420 | 6.626696% |
Noise dominated data is calculated using 1-second bins in cleaned event files. If a bin has >2000 counts, and if more than 50% of those come from <1% of pixels, then it is considered to be noise-dominated and hence unusable.
| Quadrant | # 1 sec bins | Bins with >0 counts | Bins with >2000 counts | High rate bins dominated by noise | Noise dominated (total time) | Noise dominated (detector-on time) | Marked lightcurve |
|---|---|---|---|---|---|---|---|
| A | 7513 | 6338 | 14 | 14 | 0.19% | 0.22% | 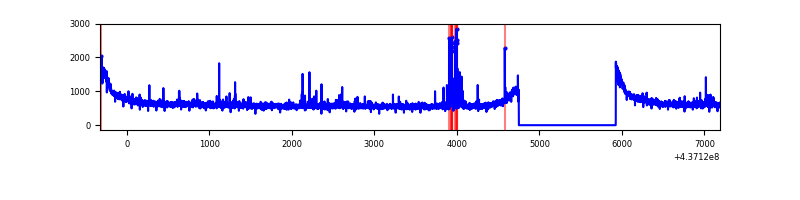 |
| B | 7513 | 6338 | 113 | 113 | 1.50% | 1.78% | 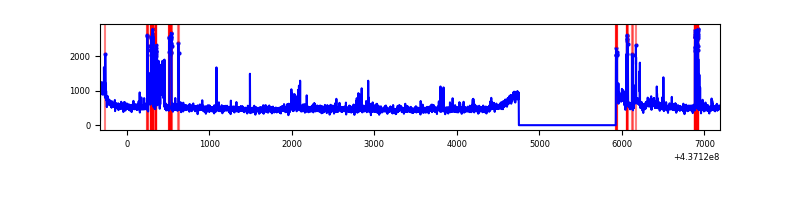 |
| C | 7513 | 6338 | 249 | 249 | 3.31% | 3.93% | 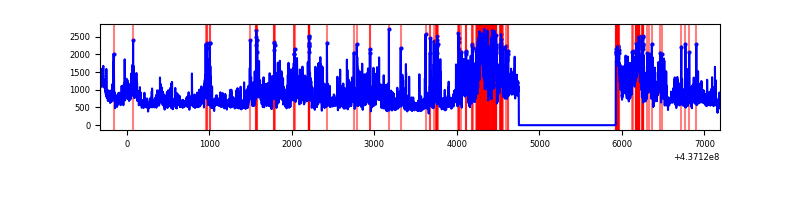 |
| D | 7513 | 6338 | 305 | 305 | 4.06% | 4.81% | 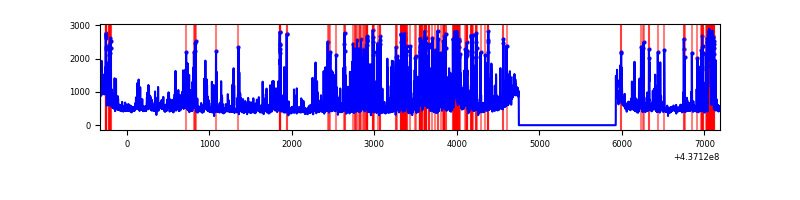 |
Top three noisy pixels from each quadrant. If the there are fewer than three noisy pixels in the level2.evt file, extra rows are filled as -1
| Pixel properties | Quadrant properties | ||||||
|---|---|---|---|---|---|---|---|
| Quadrant | DetID | PixID | Counts | Sigma | Mean | Median | Sigma |
| A | 10 | 83 | 1003053 | 6231.18 | 783 | 768 | 160.8 |
| A | 2 | 79 | 96510 | 595.22 | 783 | 768 | 160.8 |
| A | 15 | 223 | 17172 | 101.98 | 783 | 768 | 160.8 |
| B | 5 | 235 | 374463 | 2451.2 | 778 | 756 | 152.5 |
| B | 4 | 170 | 162766 | 1062.65 | 778 | 756 | 152.5 |
| B | 0 | 199 | 22030 | 139.54 | 778 | 756 | 152.5 |
| C | 3 | 233 | 2544445 | 14108.28 | 768 | 773 | 180.3 |
| C | 14 | 254 | 170919 | 943.7 | 768 | 773 | 180.3 |
| C | 15 | 158 | 72664 | 398.74 | 768 | 773 | 180.3 |
| D | 2 | 249 | 499483 | 2631.44 | 761 | 739 | 189.5 |
| D | 5 | 235 | 338778 | 1783.54 | 761 | 739 | 189.5 |
| D | 7 | 80 | 331242 | 1743.78 | 761 | 739 | 189.5 |
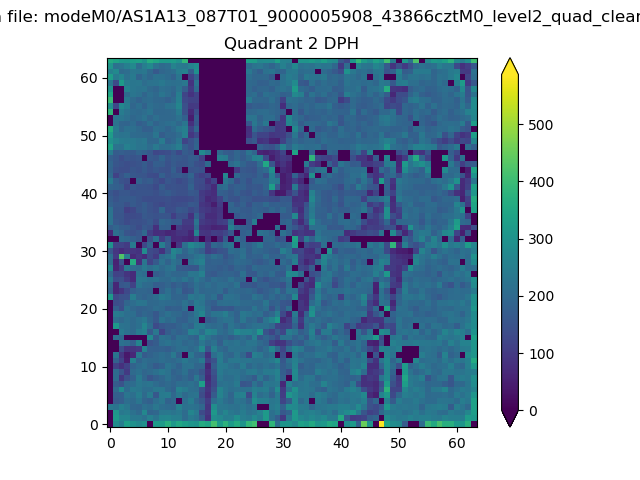
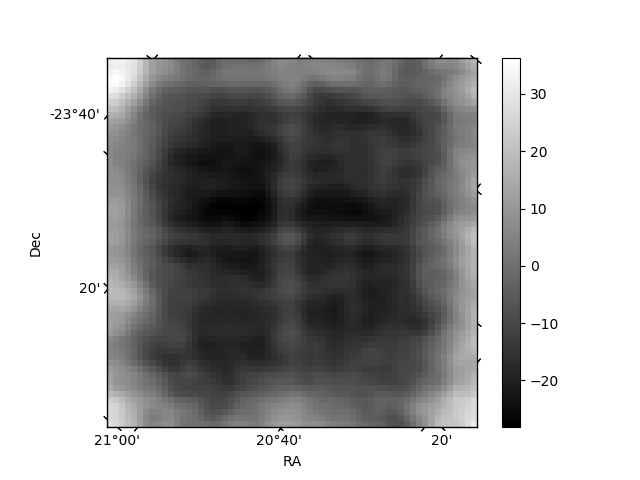
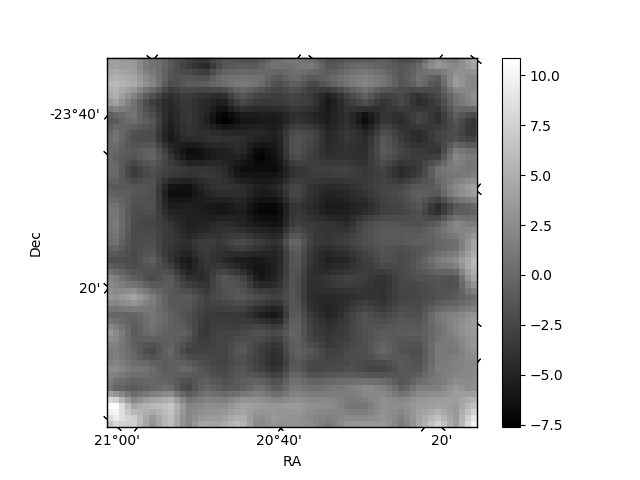
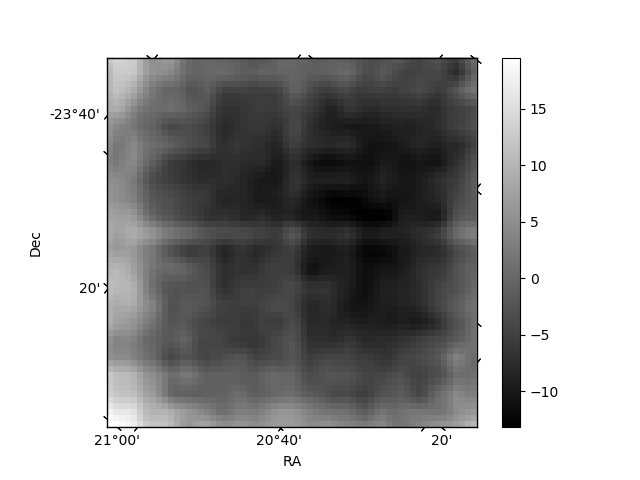
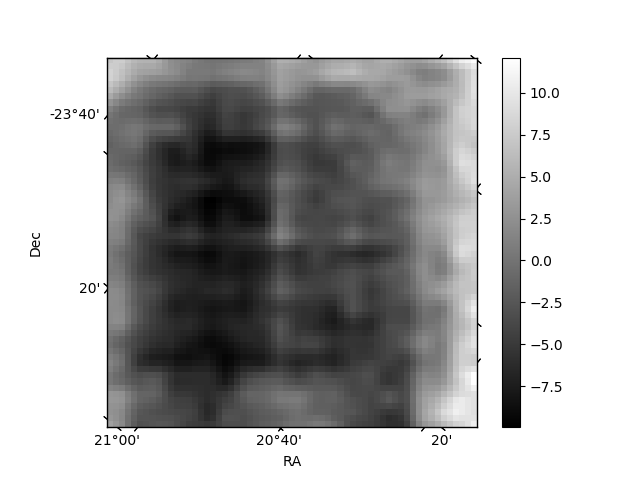
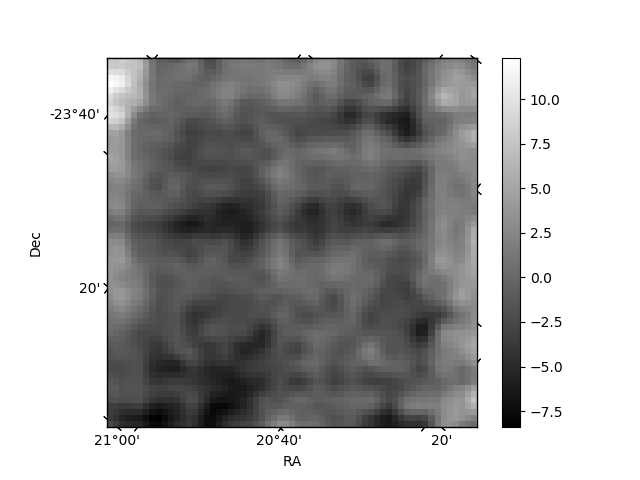
Histogram calculated using DETX and DETY for each event in the final _common_clean file
| Quadrant A | 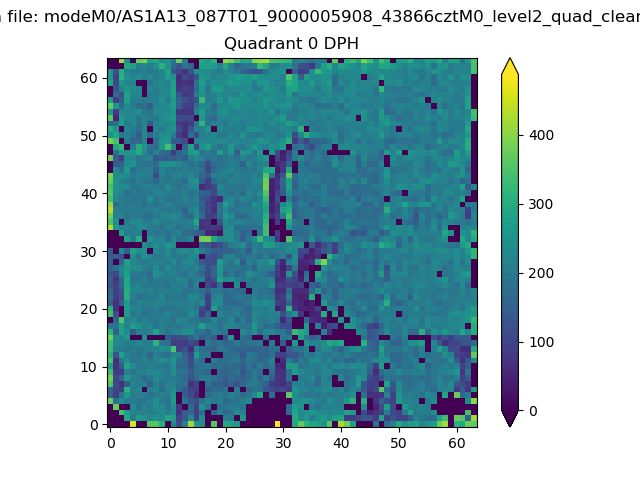 |
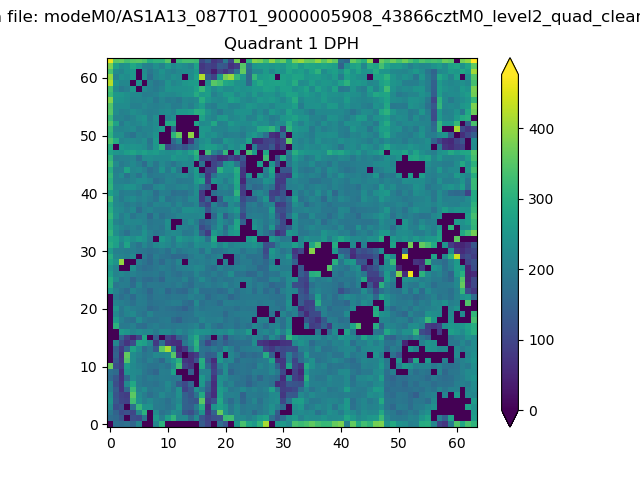 |
Quadrant B |
|---|---|---|---|
| Quadrant D | 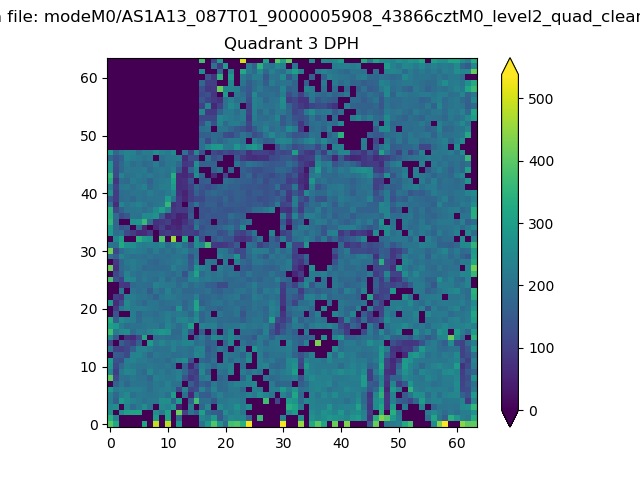 |
 |
Quadrant C |
| Plot type | Count rate plots | Images |
|---|---|---|
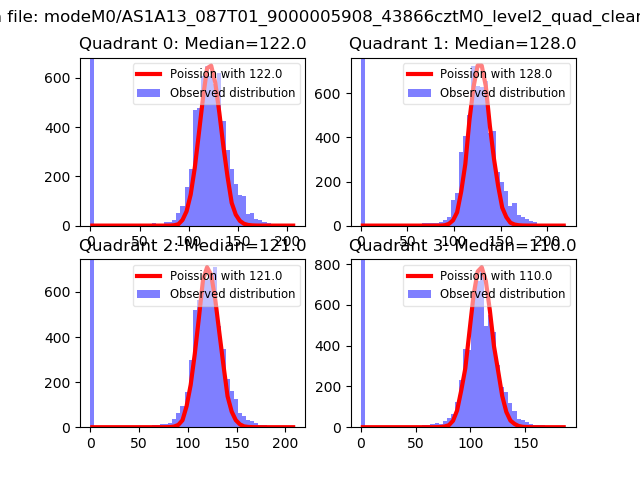
| Comparison with Poisson distribution Blue bars denote a histogram of data divided into 1 sec bins. Red curve is a Poisson curve with rate = median count rate of data. |
 |
 |
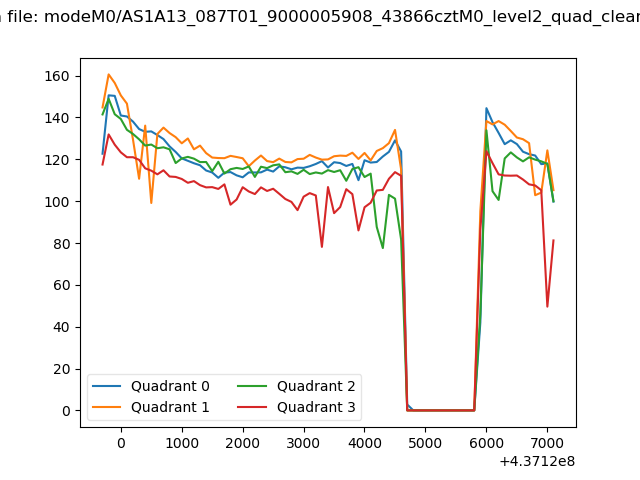
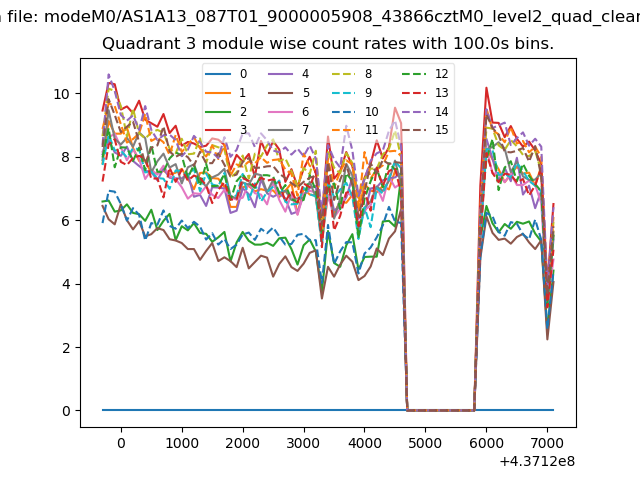
| Quadrant-wise count rates Data is divided into 100 sec bins |
 |
|
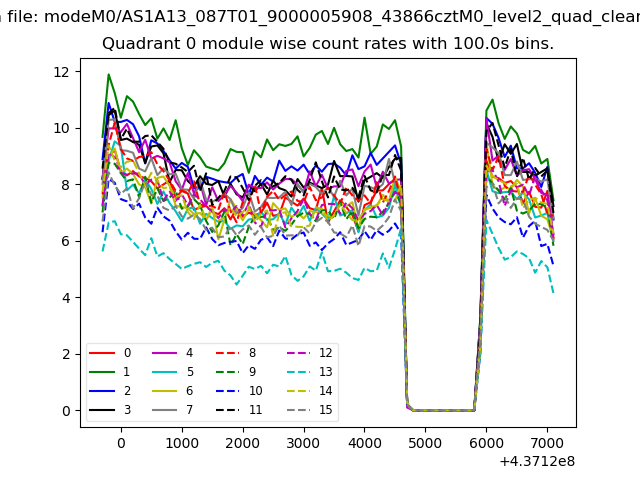
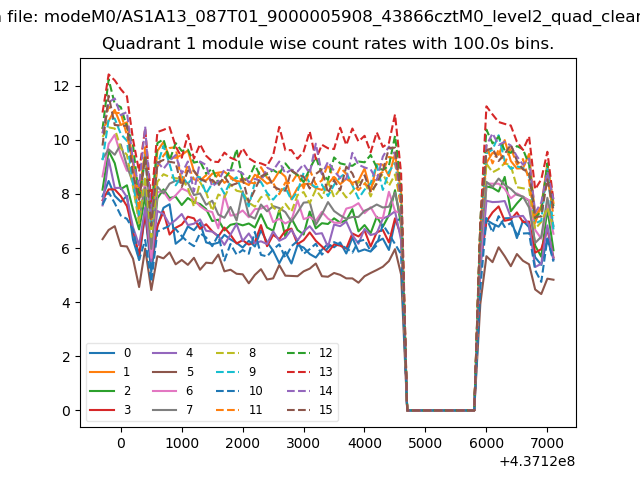
| Module-wise count rates for Quadrant A Data is divided into 100 sec bins |
 |
 |
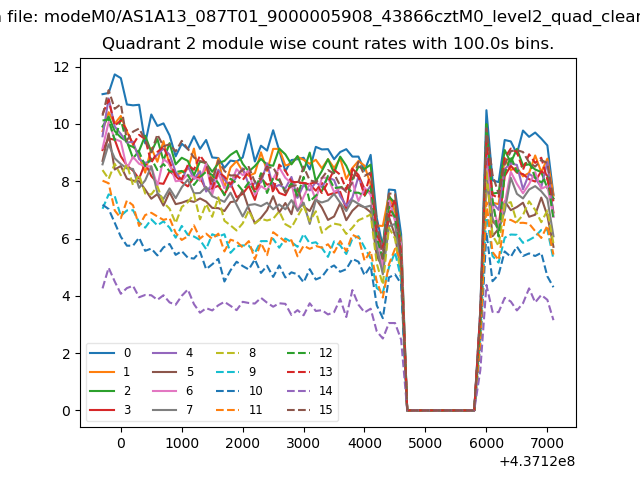
| Module-wise count rates for Quadrant B Data is divided into 100 sec bins |
 |
 |
| Module-wise count rates for Quadrant C Data is divided into 100 sec bins |
 |
 |
| Module-wise count rates for Quadrant D Data is divided into 100 sec bins |
 |
 |
| Parameter | Plot |
|---|---|
| CZT HV Monitor | 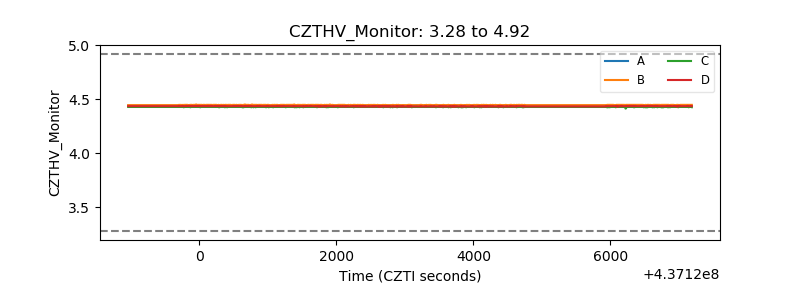 |
| D_VDD | 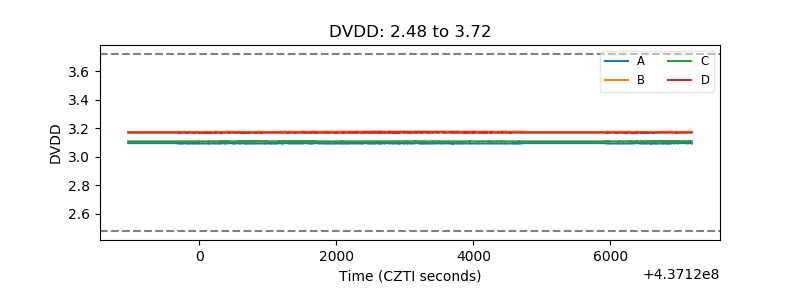 |
| Temperature 1 | 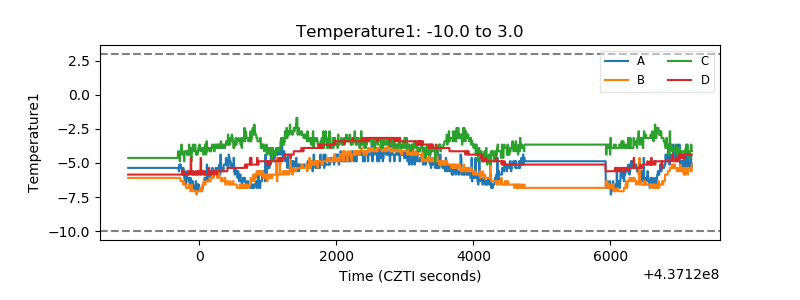 |
| Veto HV Monitor | 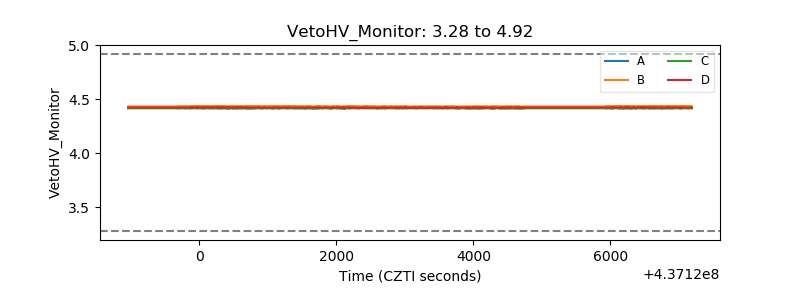 |
| Veto LLD | 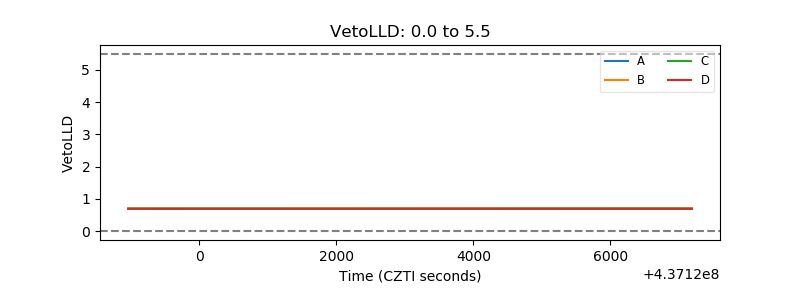 |
| Alpha Counter | 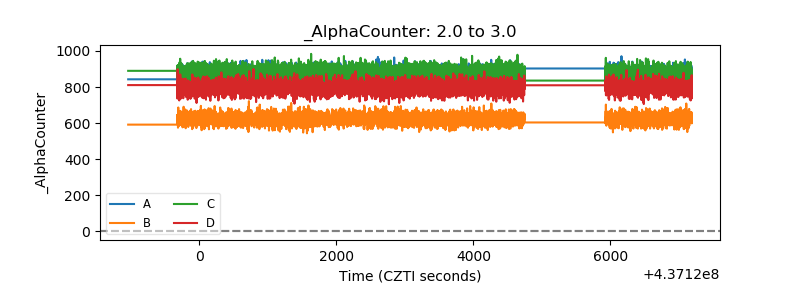 |
| _CPM_Rate | 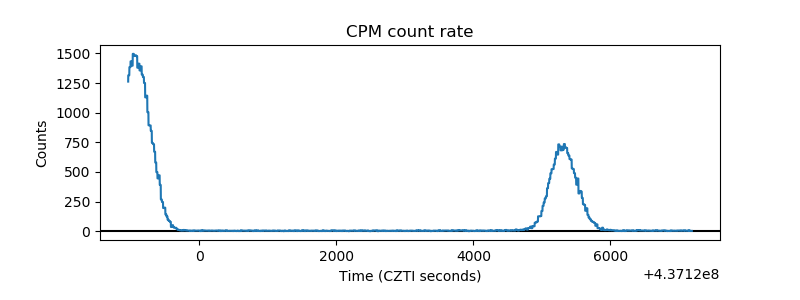 |
| CZT Counter | 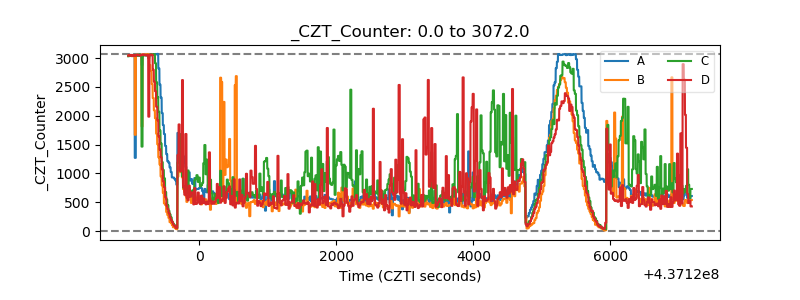 |
| +2.5 Volts monitor | 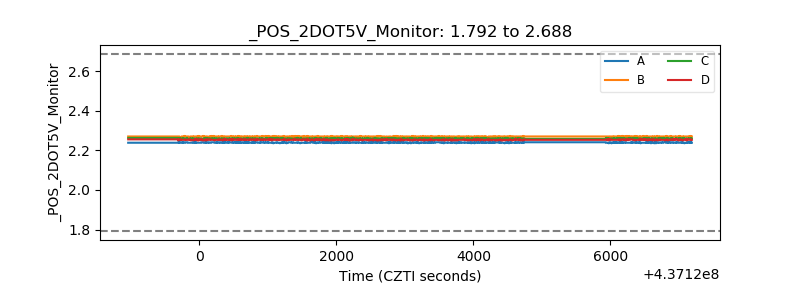 |
| +5 Volts monitor | 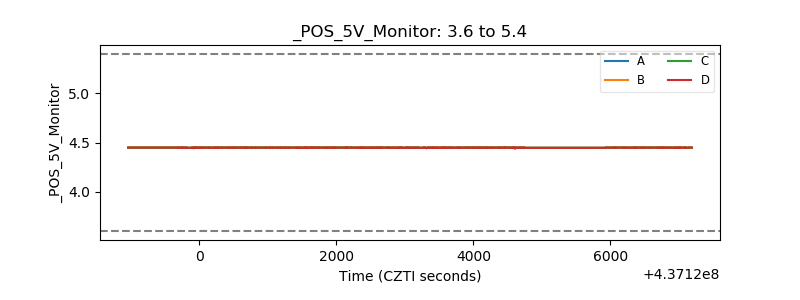 |
| _ROLL_ROT | 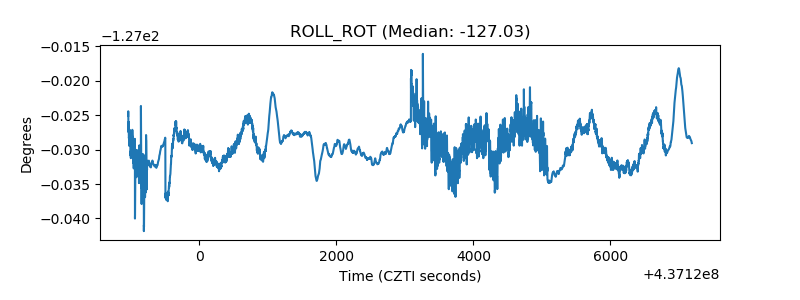 |
| _Roll_DEC | 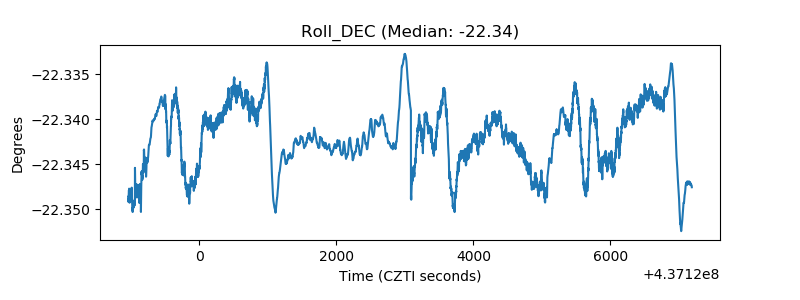 |
| _Roll_RA | 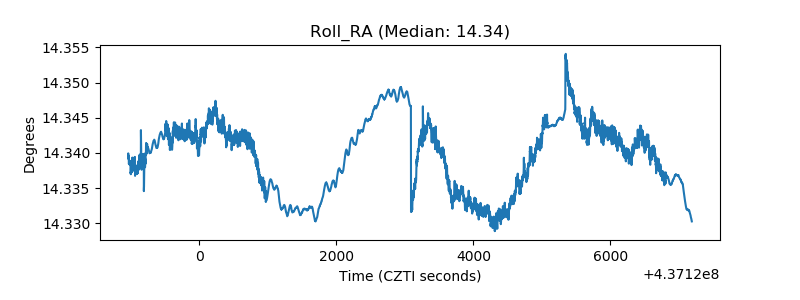 |
| Veto Counter | 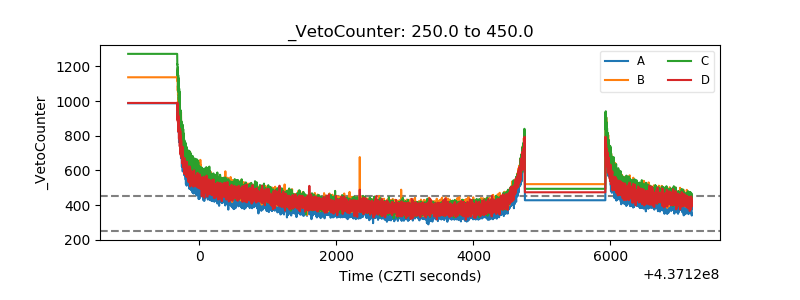 |