| Param | Original file | Final file |
|---|---|---|
| Filename | modeM0/AS1A13_087T01_9000005908_43867cztM0_level2.fits | modeM0/AS1A13_087T01_9000005908_43867cztM0_level2_quad_clean.evt |
| Size (bytes) | 537,877,440 | 112,155,840 |
| Size | 513.0 MB | 107.0 MB |
| Events in quadrant A | 4,260,863 | 757,751 |
| Events in quadrant B | 3,801,296 | 785,635 |
| Events in quadrant C | 5,724,047 | 735,264 |
| Events in quadrant D | 5,606,637 | 652,254 |
| Mode M9 | |||
|---|---|---|---|
| Quadrant | BADHDUFLAG | Total packets | Discarded packets |
| A | 0 | 15 | 0 |
| B | 0 | 16 | 0 |
| C | 0 | 16 | 0 |
| D | 0 | 16 | 0 |
| Mode M0 | |||
|---|---|---|---|
| Quadrant | BADHDUFLAG | Total packets | Discarded packets |
| A | 0 | 16902 | 2 |
| B | 0 | 15553 | 2 |
| C | 0 | 21769 | 2 |
| D | 0 | 21168 | 2 |
| Mode SS | |||
|---|---|---|---|
| Quadrant | BADHDUFLAG | Total packets | Discarded packets |
| A | 0 | 136 | 0 |
| B | 0 | 136 | 0 |
| C | 0 | 136 | 0 |
| D | 0 | 136 | 0 |
| Quadrant | Total seconds | Saturated seconds | Saturation percentage |
|---|---|---|---|
| A | 6674 | 255 | 3.820797% |
| B | 6674 | 291 | 4.360204% |
| C | 6674 | 429 | 6.427929% |
| D | 6674 | 687 | 10.293677% |
Noise dominated data is calculated using 1-second bins in cleaned event files. If a bin has >2000 counts, and if more than 50% of those come from <1% of pixels, then it is considered to be noise-dominated and hence unusable.
| Quadrant | # 1 sec bins | Bins with >0 counts | Bins with >2000 counts | High rate bins dominated by noise | Noise dominated (total time) | Noise dominated (detector-on time) | Marked lightcurve |
|---|---|---|---|---|---|---|---|
| A | 7654 | 6674 | 4 | 4 | 0.05% | 0.06% | 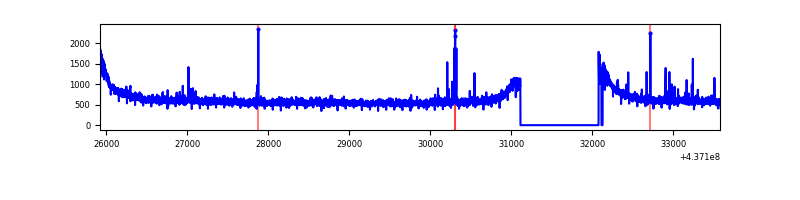 |
| B | 7654 | 6674 | 57 | 57 | 0.74% | 0.85% | 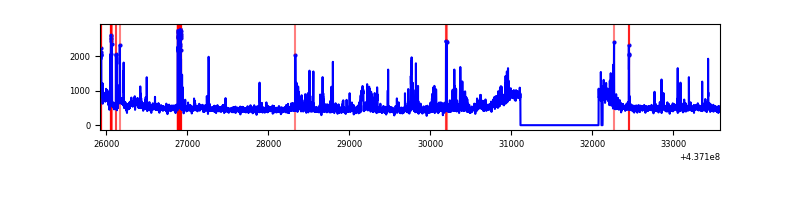 |
| C | 7654 | 6674 | 161 | 161 | 2.10% | 2.41% | 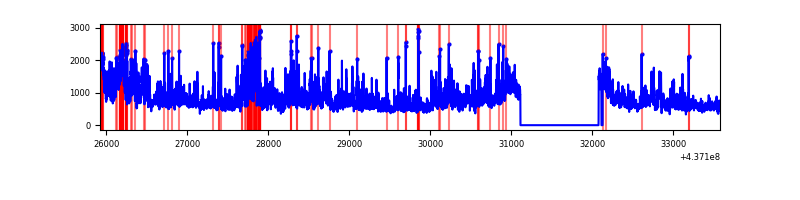 |
| D | 7653 | 6673 | 512 | 512 | 6.69% | 7.67% | 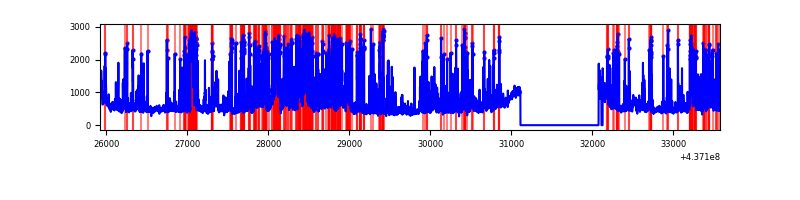 |
Top three noisy pixels from each quadrant. If the there are fewer than three noisy pixels in the level2.evt file, extra rows are filled as -1
| Pixel properties | Quadrant properties | ||||||
|---|---|---|---|---|---|---|---|
| Quadrant | DetID | PixID | Counts | Sigma | Mean | Median | Sigma |
| A | 10 | 83 | 1038182 | 6211.91 | 807 | 790 | 167.0 |
| A | 15 | 223 | 56975 | 336.44 | 807 | 790 | 167.0 |
| A | 2 | 79 | 25212 | 146.24 | 807 | 790 | 167.0 |
| B | 5 | 235 | 267688 | 1679.99 | 802 | 777 | 158.9 |
| B | 0 | 183 | 149337 | 935.07 | 802 | 777 | 158.9 |
| B | 4 | 170 | 116221 | 726.63 | 802 | 777 | 158.9 |
| C | 3 | 233 | 2371845 | 12809.45 | 786 | 790 | 185.1 |
| C | 14 | 254 | 123304 | 661.87 | 786 | 790 | 185.1 |
| C | 12 | 249 | 57953 | 308.82 | 786 | 790 | 185.1 |
| D | 7 | 80 | 956103 | 4941.43 | 775 | 754 | 193.3 |
| D | 13 | 249 | 588855 | 3041.88 | 775 | 754 | 193.3 |
| D | 5 | 235 | 308926 | 1593.98 | 775 | 754 | 193.3 |
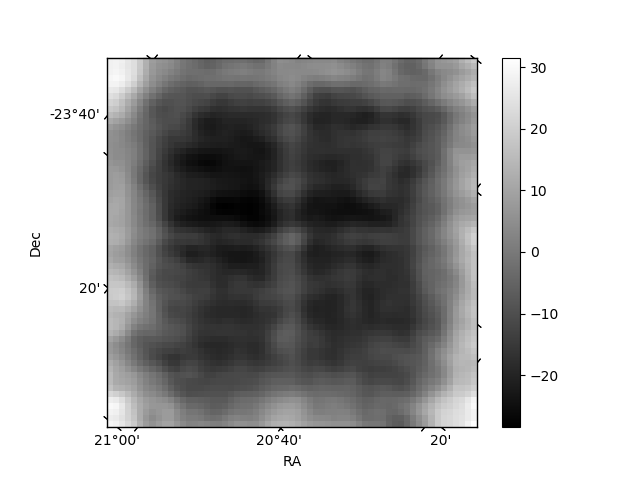
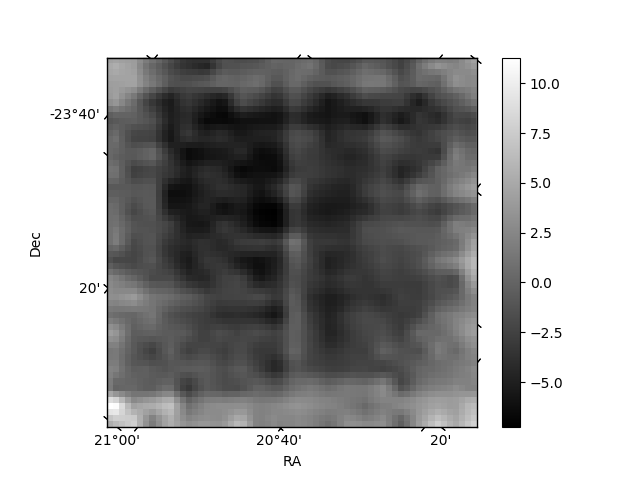
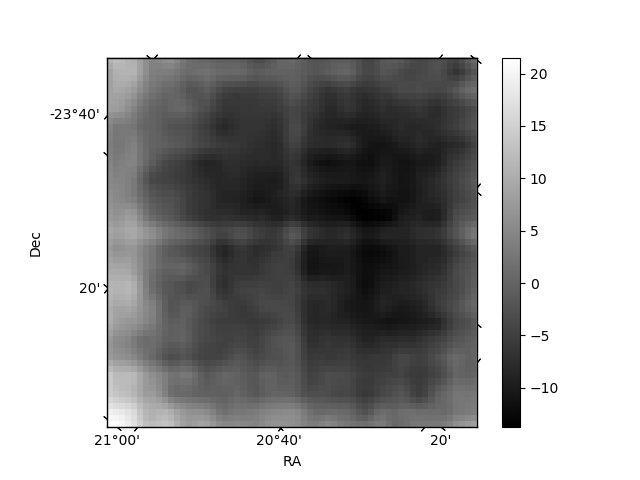
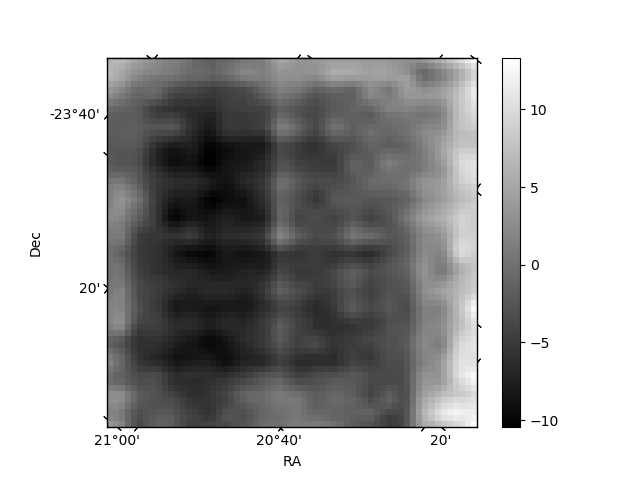
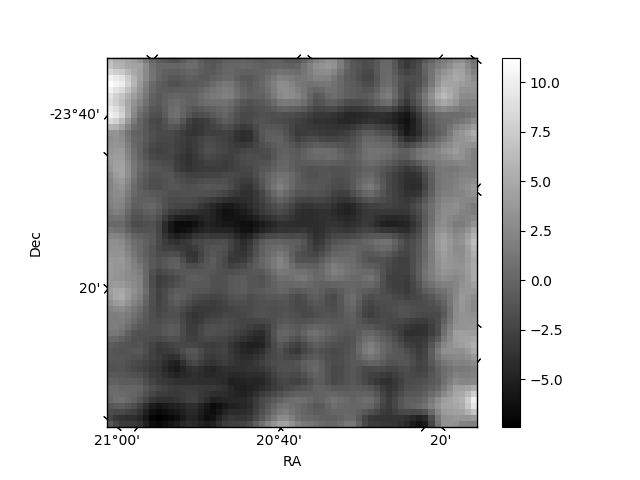
Histogram calculated using DETX and DETY for each event in the final _common_clean file
| Quadrant A | 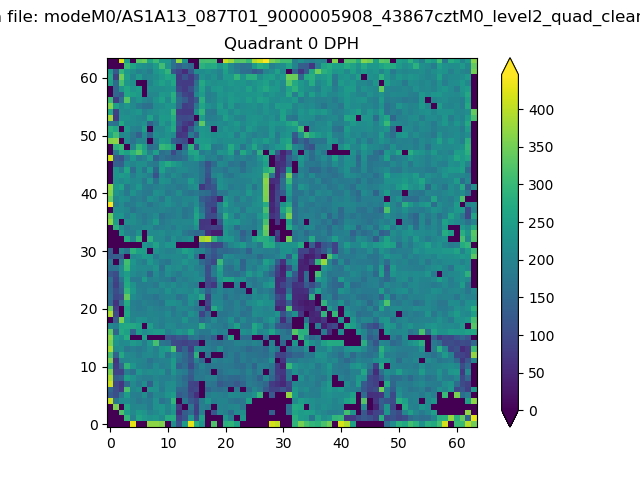 |
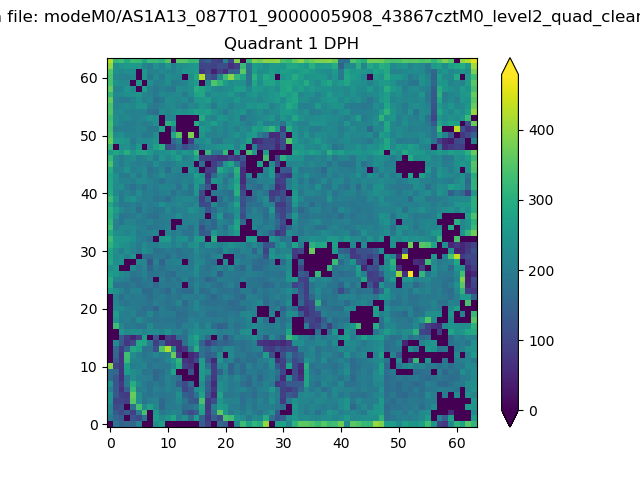 |
Quadrant B |
|---|---|---|---|
| Quadrant D | 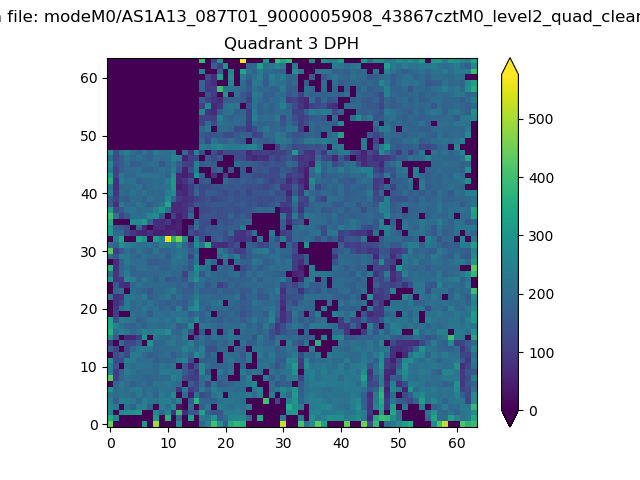 |
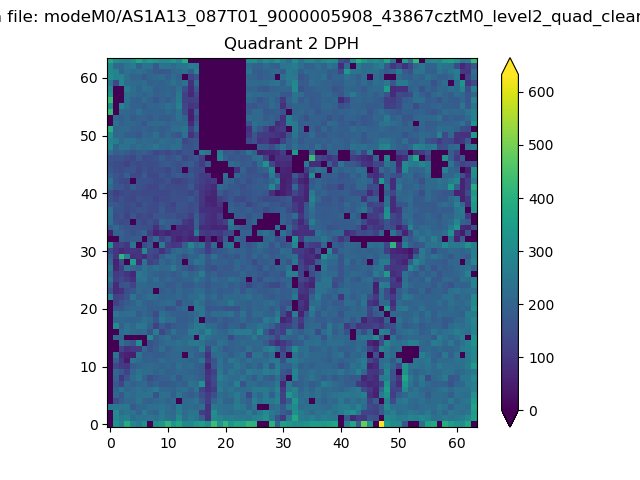 |
Quadrant C |
| Plot type | Count rate plots | Images |
|---|---|---|
| Comparison with Poisson distribution Blue bars denote a histogram of data divided into 1 sec bins. Red curve is a Poisson curve with rate = median count rate of data. |
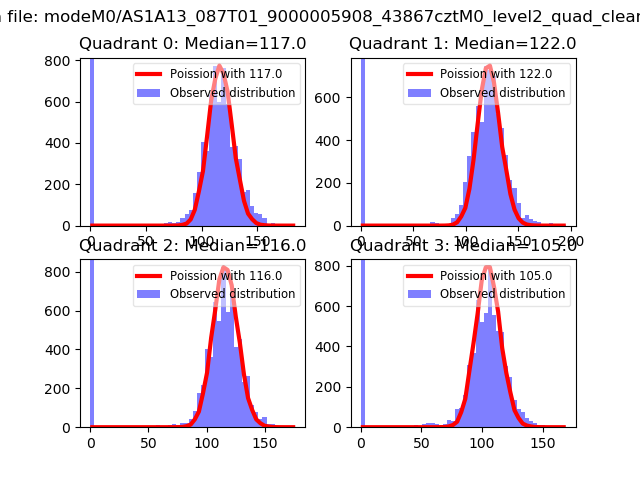 |
 |
| Quadrant-wise count rates Data is divided into 100 sec bins |
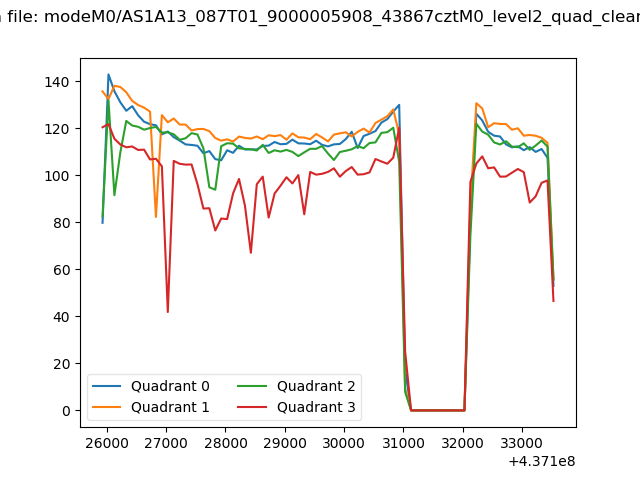 |
|
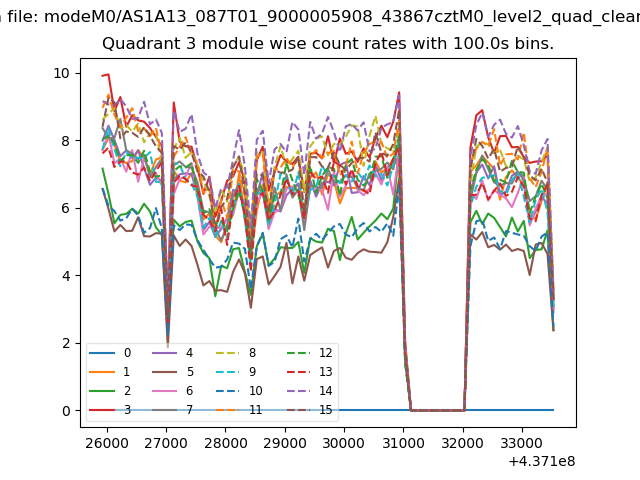
| Module-wise count rates for Quadrant A Data is divided into 100 sec bins |
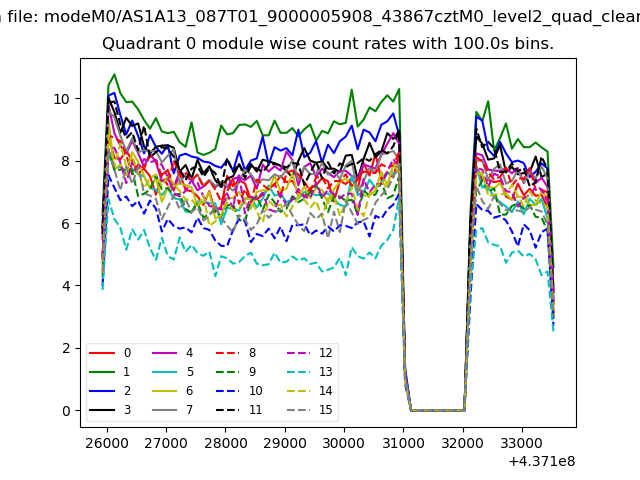 |
 |
| Module-wise count rates for Quadrant B Data is divided into 100 sec bins |
 |
 |
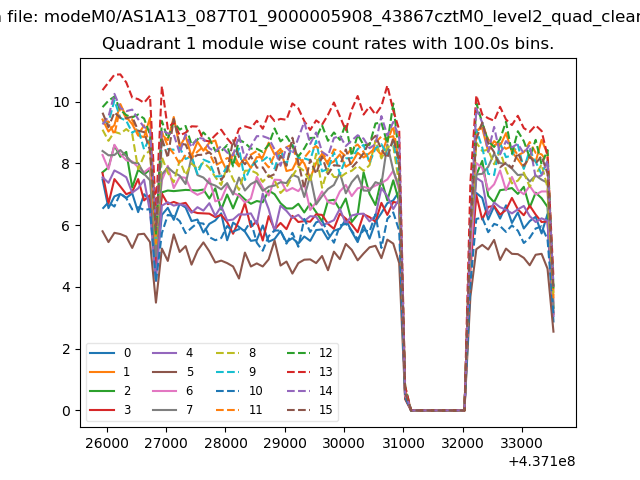
| Module-wise count rates for Quadrant C Data is divided into 100 sec bins |
 |
 |
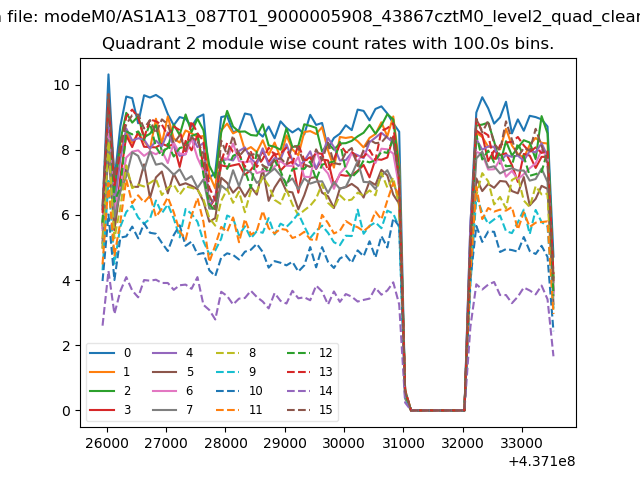
| Module-wise count rates for Quadrant D Data is divided into 100 sec bins |
 |
 |
| Parameter | Plot |
|---|---|
| CZT HV Monitor | 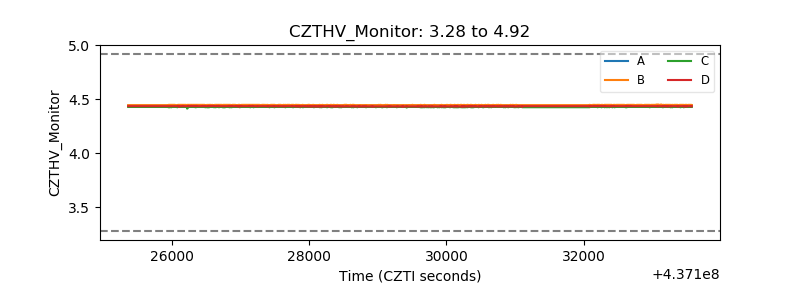 |
| D_VDD | 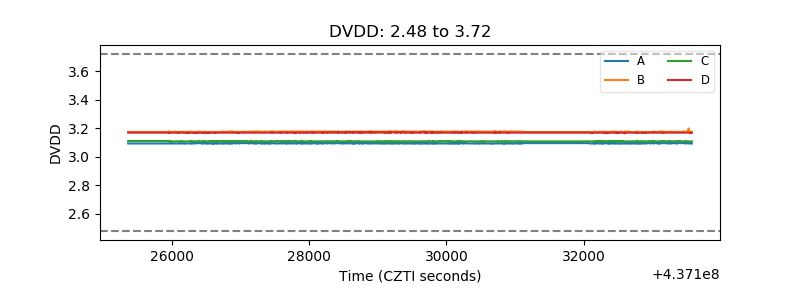 |
| Temperature 1 | 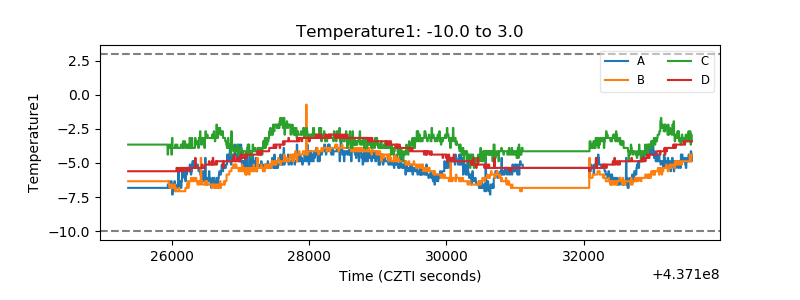 |
| Veto HV Monitor |  |
| Veto LLD | 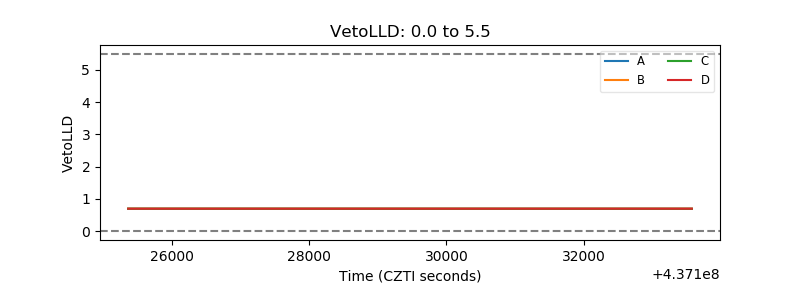 |
| Alpha Counter | 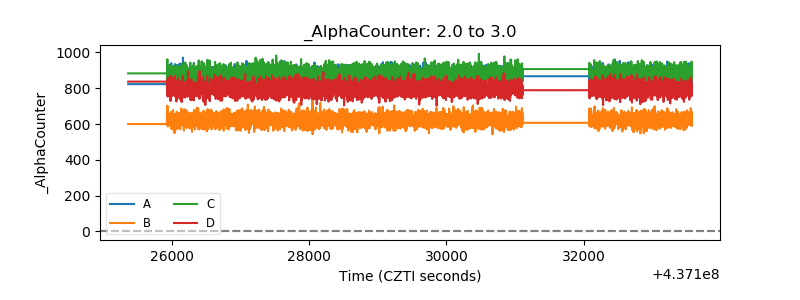 |
| _CPM_Rate | 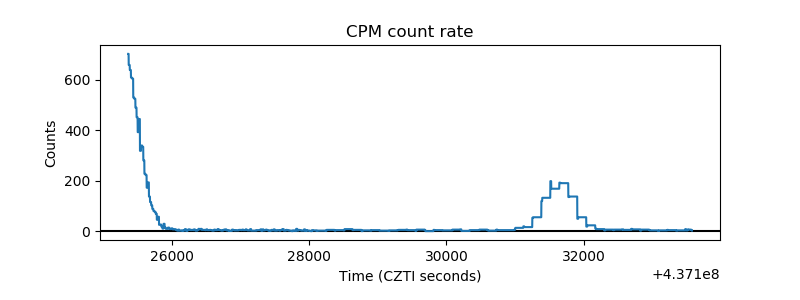 |
| CZT Counter | 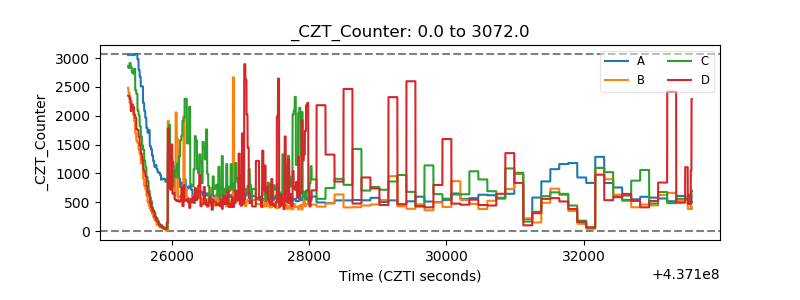 |
| +2.5 Volts monitor | 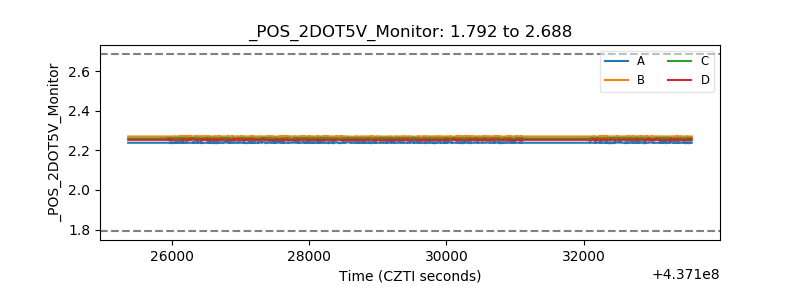 |
| +5 Volts monitor | 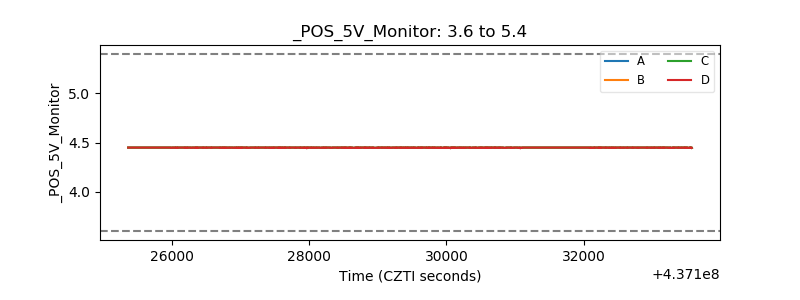 |
| _ROLL_ROT | 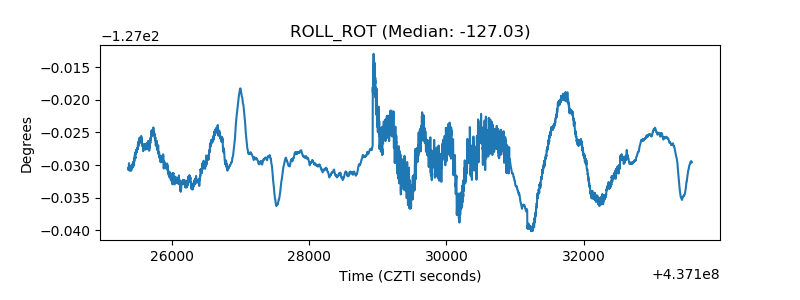 |
| _Roll_DEC | 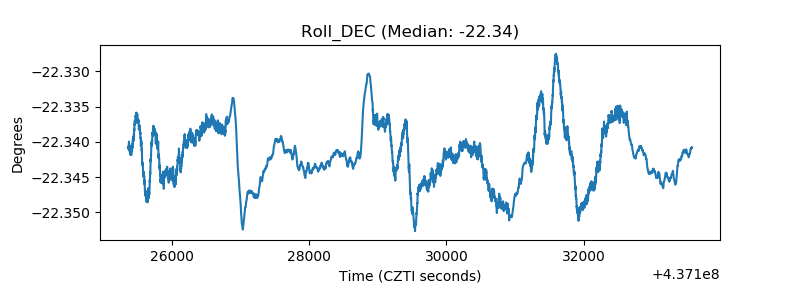 |
| _Roll_RA | 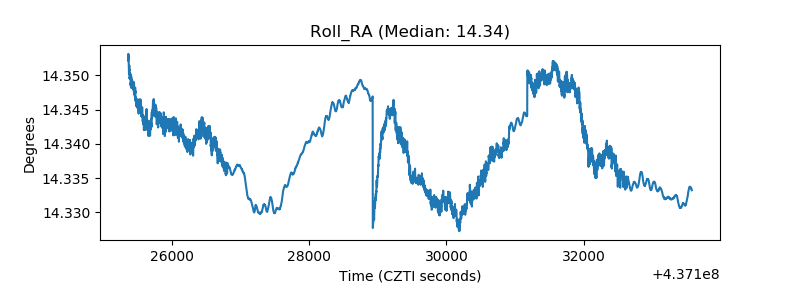 |
| Veto Counter | 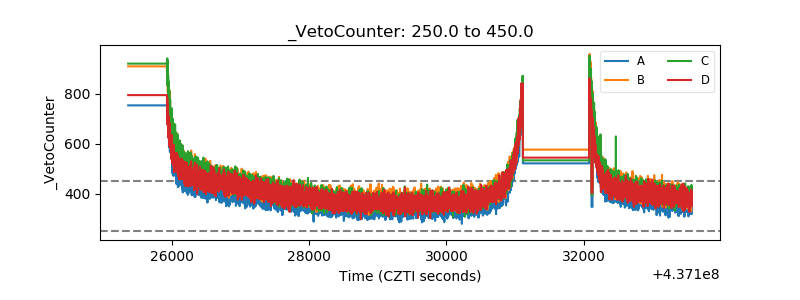 |