| Param | Original file | Final file |
|---|---|---|
| Filename | modeM0/AS1A13_087T01_9000005908_43868cztM0_level2.fits | modeM0/AS1A13_087T01_9000005908_43868cztM0_level2_quad_clean.evt |
| Size (bytes) | 616,291,200 | 112,435,200 |
| Size | 587.7 MB | 107.2 MB |
| Events in quadrant A | 4,592,872 | 769,719 |
| Events in quadrant B | 6,028,136 | 705,699 |
| Events in quadrant C | 5,303,259 | 759,833 |
| Events in quadrant D | 6,331,604 | 668,367 |
| Mode M9 | |||
|---|---|---|---|
| Quadrant | BADHDUFLAG | Total packets | Discarded packets |
| A | 0 | 8 | 0 |
| B | 0 | 9 | 0 |
| C | 0 | 9 | 0 |
| D | 0 | 9 | 0 |
| Mode M0 | |||
|---|---|---|---|
| Quadrant | BADHDUFLAG | Total packets | Discarded packets |
| A | 0 | 18129 | 3 |
| B | 0 | 22660 | 7 |
| C | 0 | 20730 | 3 |
| D | 0 | 23695 | 3 |
| Mode SS | |||
|---|---|---|---|
| Quadrant | BADHDUFLAG | Total packets | Discarded packets |
| A | 0 | 148 | 0 |
| B | 0 | 148 | 0 |
| C | 0 | 148 | 0 |
| D | 0 | 148 | 0 |
| Quadrant | Total seconds | Saturated seconds | Saturation percentage |
|---|---|---|---|
| A | 7187 | 358 | 4.981216% |
| B | 7186 | 1191 | 16.573894% |
| C | 7186 | 418 | 5.816866% |
| D | 7186 | 807 | 11.230170% |
Noise dominated data is calculated using 1-second bins in cleaned event files. If a bin has >2000 counts, and if more than 50% of those come from <1% of pixels, then it is considered to be noise-dominated and hence unusable.
| Quadrant | # 1 sec bins | Bins with >0 counts | Bins with >2000 counts | High rate bins dominated by noise | Noise dominated (total time) | Noise dominated (detector-on time) | Marked lightcurve |
|---|---|---|---|---|---|---|---|
| A | 7806 | 7186 | 21 | 21 | 0.27% | 0.29% | 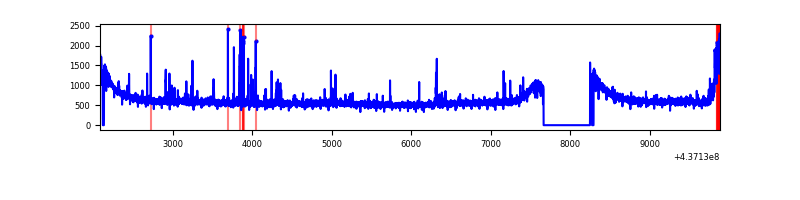 |
| B | 7805 | 7185 | 699 | 699 | 8.96% | 9.73% | 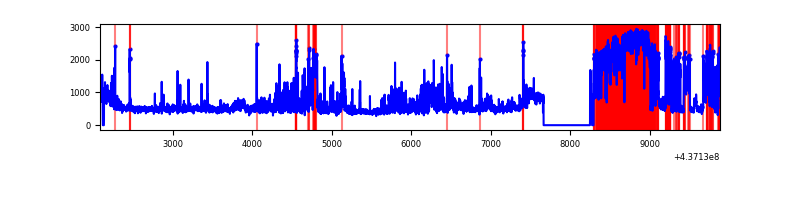 |
| C | 7805 | 7186 | 113 | 113 | 1.45% | 1.57% | 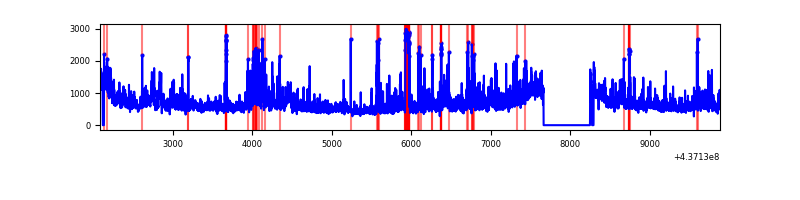 |
| D | 7805 | 7185 | 616 | 616 | 7.89% | 8.57% | 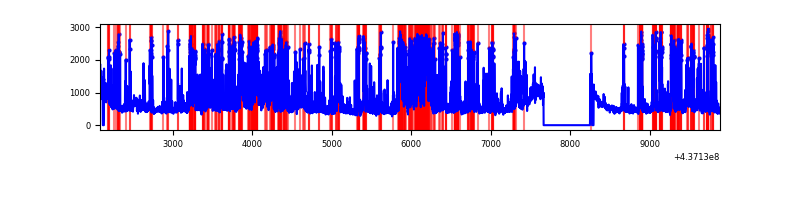 |
Top three noisy pixels from each quadrant. If the there are fewer than three noisy pixels in the level2.evt file, extra rows are filled as -1
| Pixel properties | Quadrant properties | ||||||
|---|---|---|---|---|---|---|---|
| Quadrant | DetID | PixID | Counts | Sigma | Mean | Median | Sigma |
| A | 10 | 83 | 1054059 | 6011.81 | 849 | 833 | 175.2 |
| A | 15 | 223 | 159466 | 905.47 | 849 | 833 | 175.2 |
| A | 2 | 79 | 78085 | 440.95 | 849 | 833 | 175.2 |
| B | 5 | 235 | 2303083 | 14543.41 | 793 | 768 | 158.3 |
| B | 0 | 200 | 410533 | 2588.43 | 793 | 768 | 158.3 |
| B | 0 | 183 | 73563 | 459.84 | 793 | 768 | 158.3 |
| C | 3 | 233 | 1707914 | 8647.37 | 829 | 834 | 197.4 |
| C | 1 | 16 | 127315 | 640.7 | 829 | 834 | 197.4 |
| C | 14 | 254 | 98316 | 493.8 | 829 | 834 | 197.4 |
| D | 13 | 249 | 687745 | 3375.18 | 817 | 792 | 203.5 |
| D | 12 | 233 | 662602 | 3251.65 | 817 | 792 | 203.5 |
| D | 5 | 235 | 603009 | 2958.85 | 817 | 792 | 203.5 |
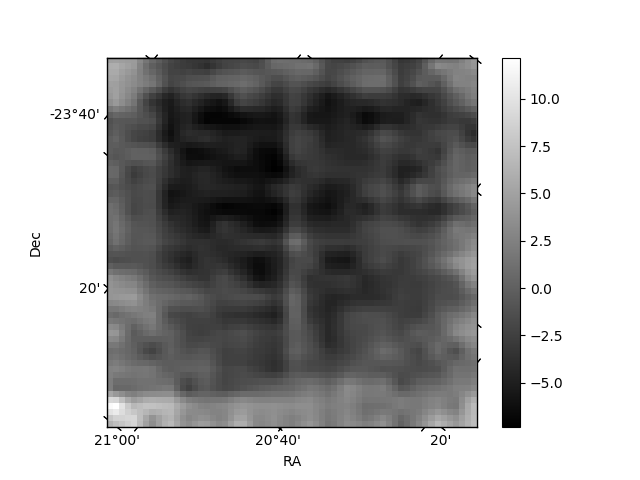
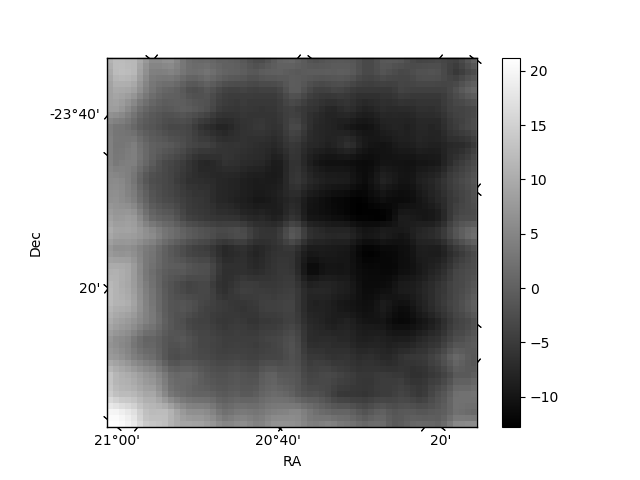
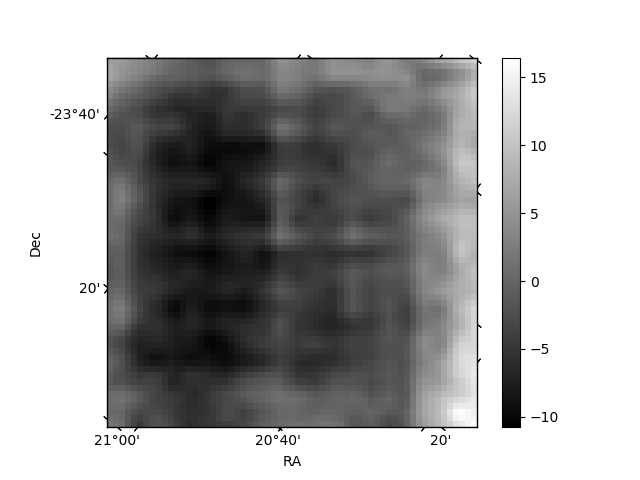
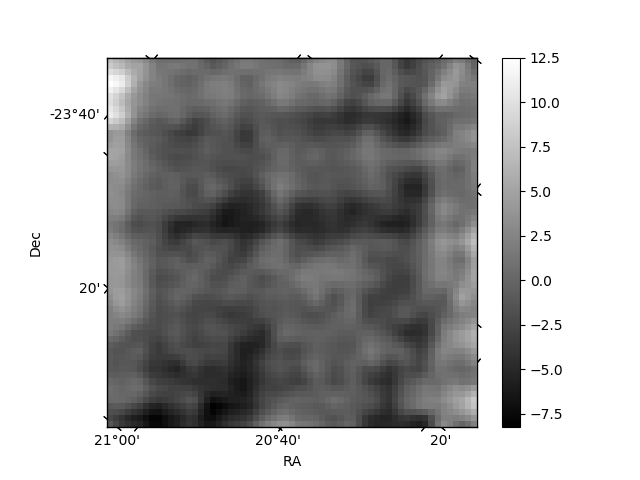
Histogram calculated using DETX and DETY for each event in the final _common_clean file
| Quadrant A | 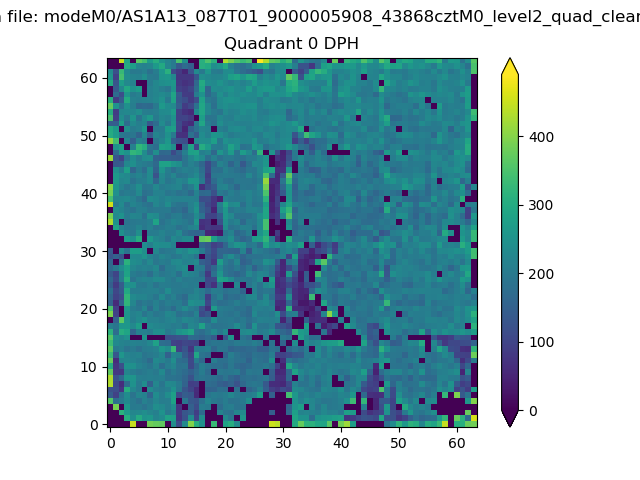 |
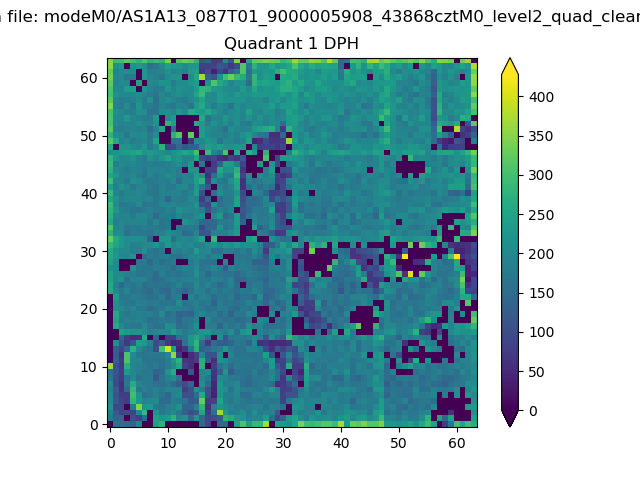 |
Quadrant B |
|---|---|---|---|
| Quadrant D | 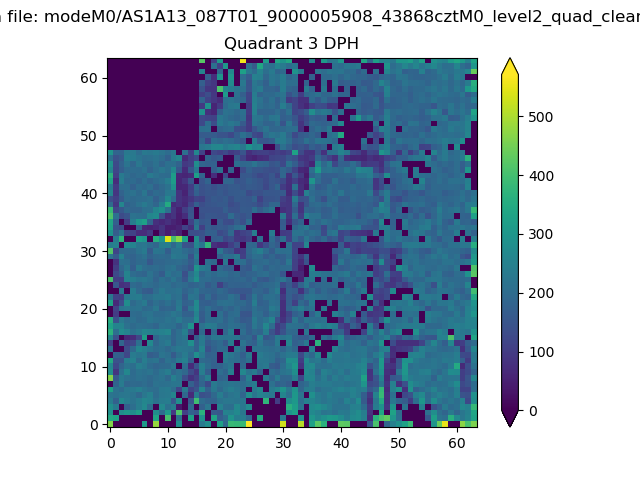 |
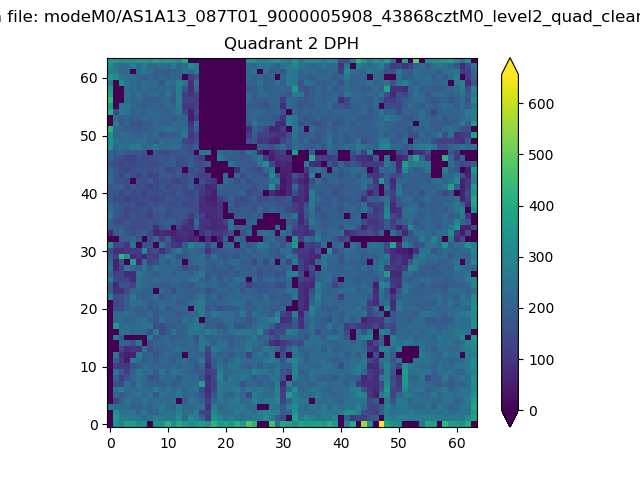 |
Quadrant C |
| Plot type | Count rate plots | Images |
|---|---|---|
| Comparison with Poisson distribution Blue bars denote a histogram of data divided into 1 sec bins. Red curve is a Poisson curve with rate = median count rate of data. |
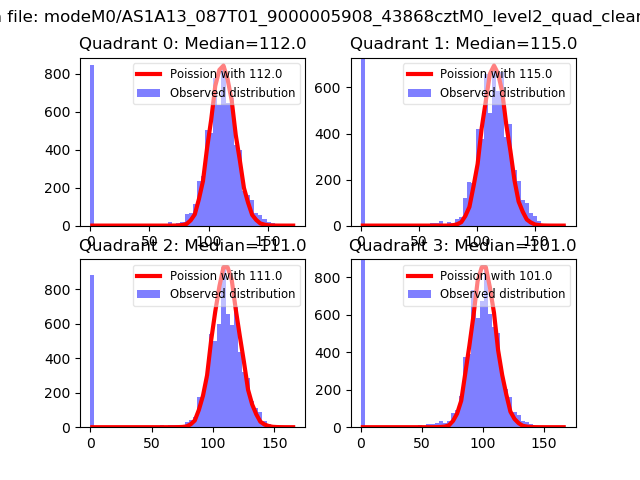 |
 |
| Quadrant-wise count rates Data is divided into 100 sec bins |
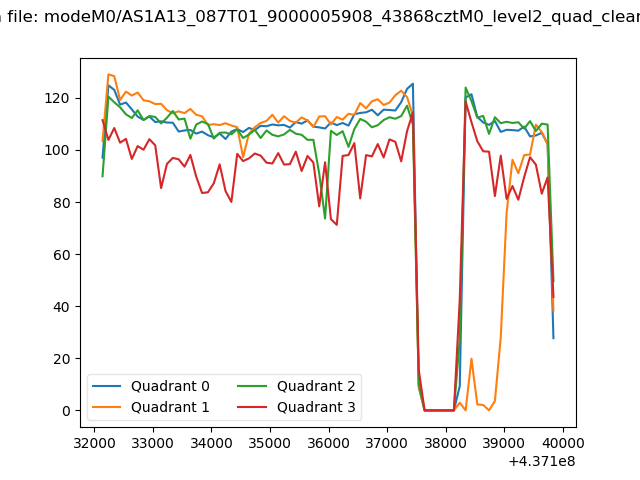 |
|
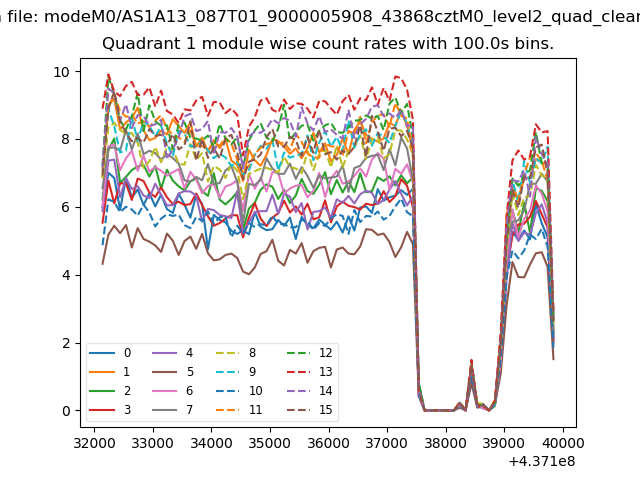
| Module-wise count rates for Quadrant A Data is divided into 100 sec bins |
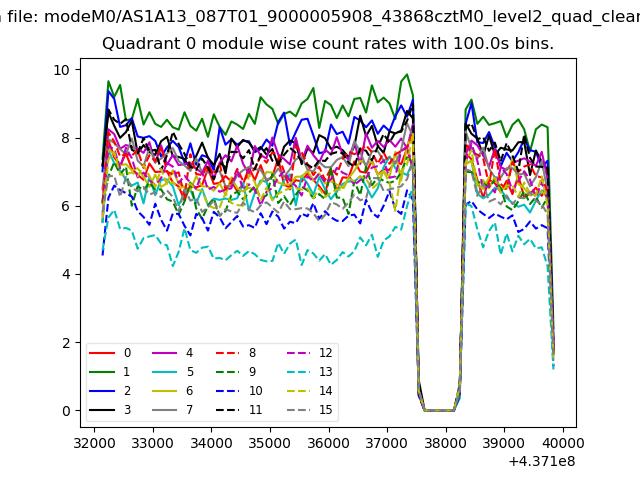 |
 |
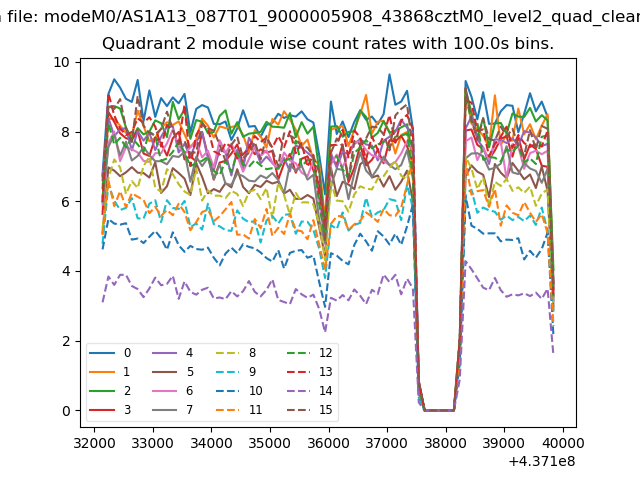
| Module-wise count rates for Quadrant B Data is divided into 100 sec bins |
 |
 |
| Module-wise count rates for Quadrant C Data is divided into 100 sec bins |
 |
 |
| Module-wise count rates for Quadrant D Data is divided into 100 sec bins |
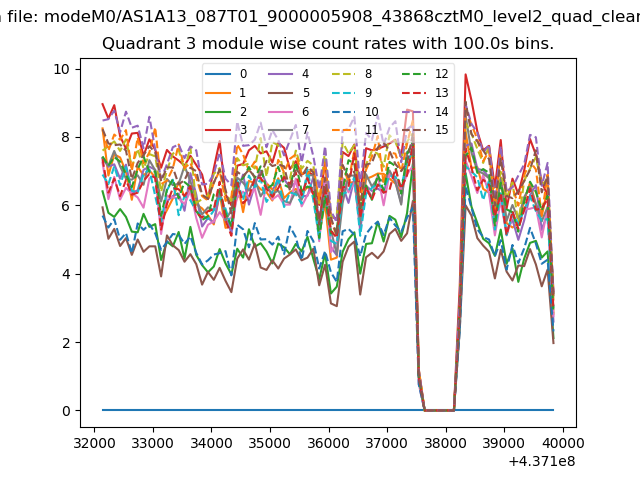 |
 |
| Parameter | Plot |
|---|---|
| CZT HV Monitor | 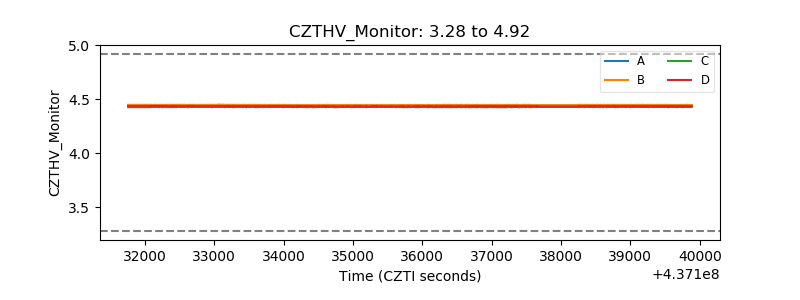 |
| D_VDD | 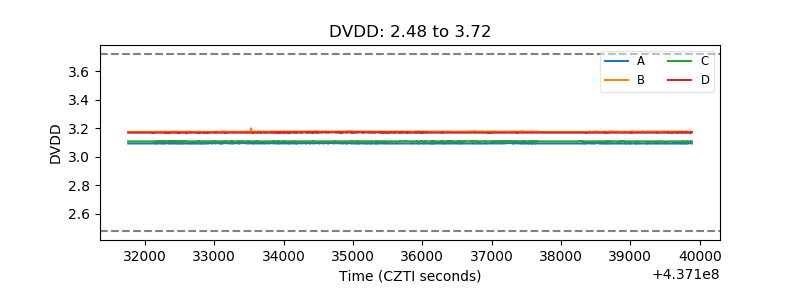 |
| Temperature 1 | 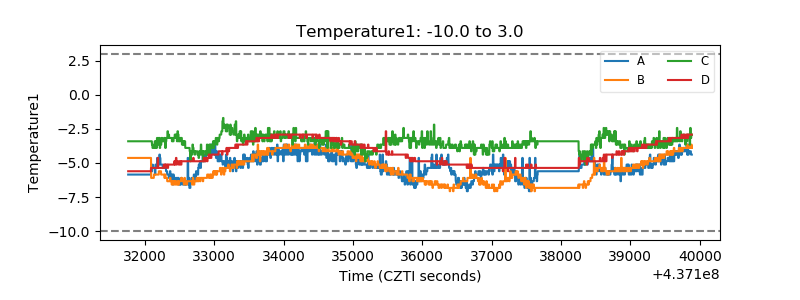 |
| Veto HV Monitor | 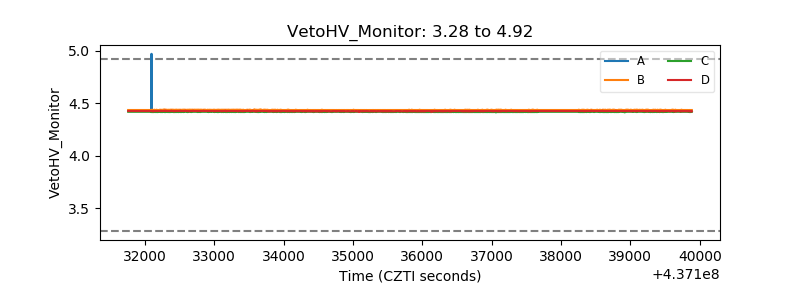 |
| Veto LLD | 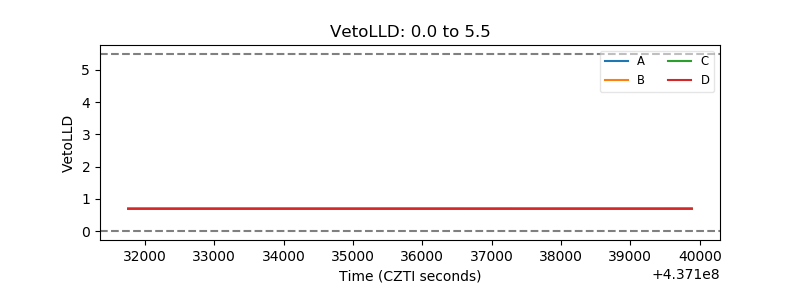 |
| Alpha Counter | 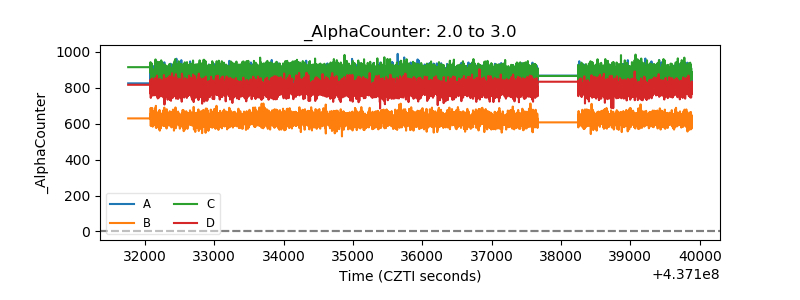 |
| _CPM_Rate | 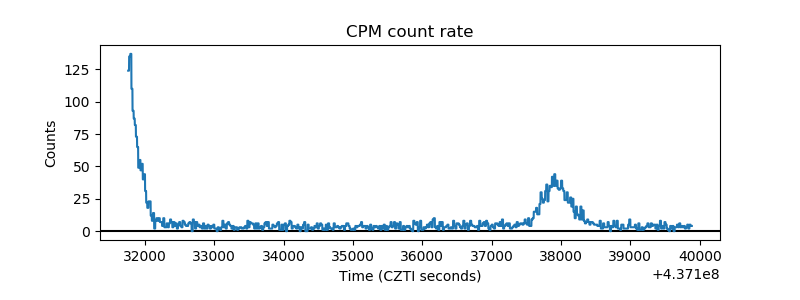 |
| CZT Counter | 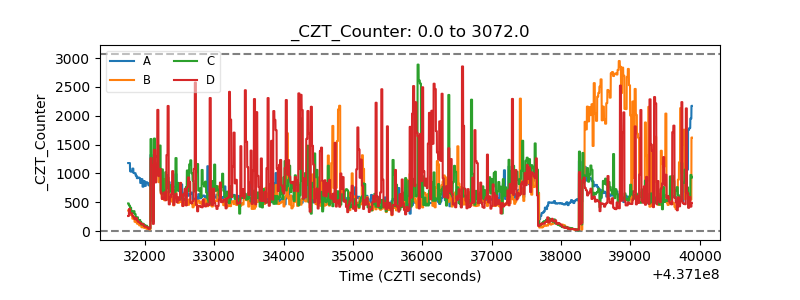 |
| +2.5 Volts monitor | 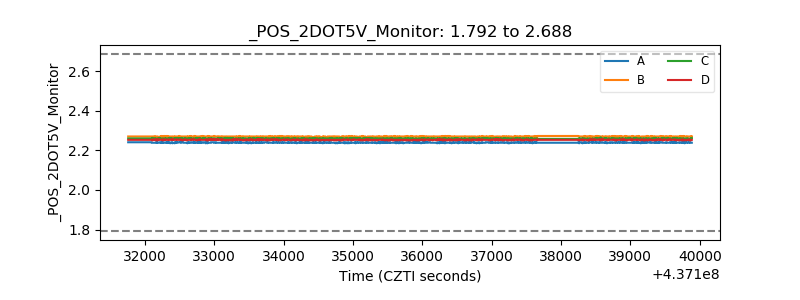 |
| +5 Volts monitor | 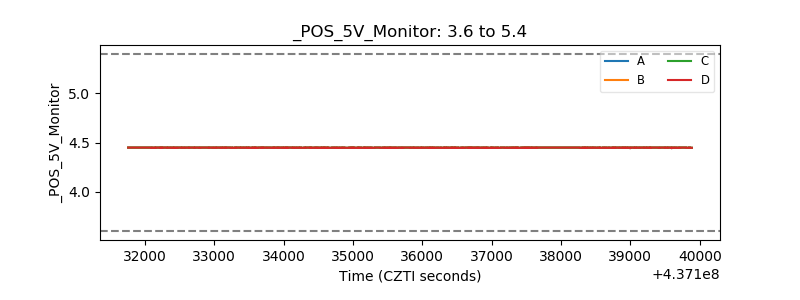 |
| _ROLL_ROT | 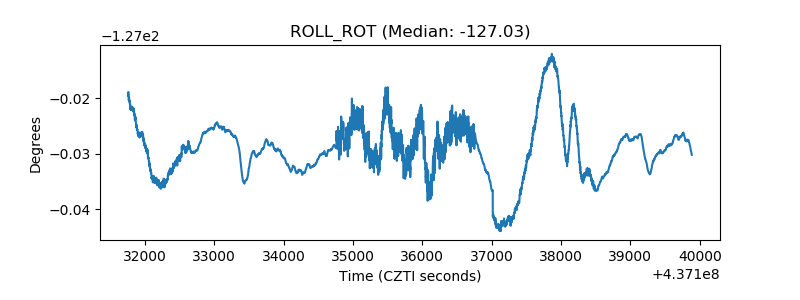 |
| _Roll_DEC | 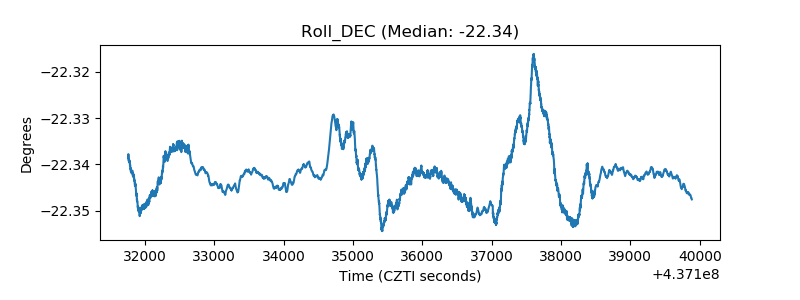 |
| _Roll_RA | 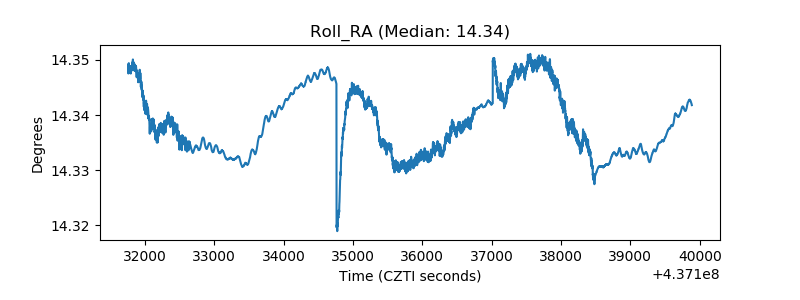 |
| Veto Counter | 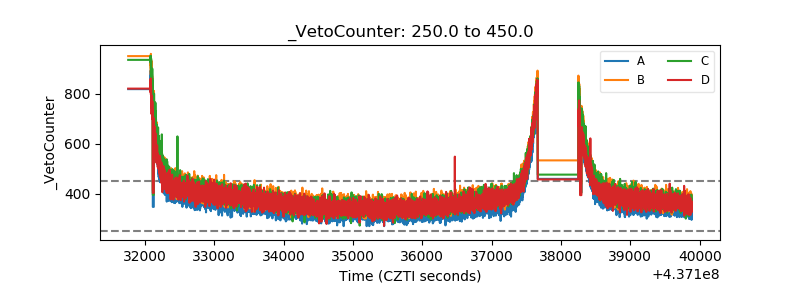 |