| Param | Original file | Final file |
|---|---|---|
| Filename | modeM0/AS1A13_065T06_9000005914_43874cztM0_level2.fits | modeM0/AS1A13_065T06_9000005914_43874cztM0_level2_quad_clean.evt |
| Size (bytes) | 807,615,360 | 147,343,680 |
| Size | 770.2 MB | 140.5 MB |
| Events in quadrant A | 8,993,354 | 885,842 |
| Events in quadrant B | 6,055,889 | 1,030,829 |
| Events in quadrant C | 6,780,051 | 976,999 |
| Events in quadrant D | 7,311,003 | 891,114 |
Noise dominated data is calculated using 1-second bins in cleaned event files. If a bin has >2000 counts, and if more than 50% of those come from <1% of pixels, then it is considered to be noise-dominated and hence unusable.
| Quadrant | # 1 sec bins | Bins with >0 counts | Bins with >2000 counts | High rate bins dominated by noise | Noise dominated (total time) | Noise dominated (detector-on time) | Marked lightcurve |
|---|---|---|---|---|---|---|---|
| A | 11025 | 9752 | 914 | 914 | 8.29% | 9.37% | 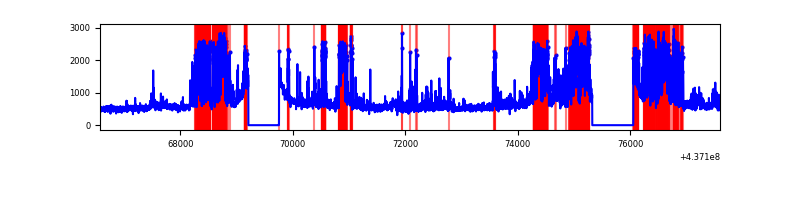 |
| B | 11025 | 9750 | 269 | 269 | 2.44% | 2.76% | 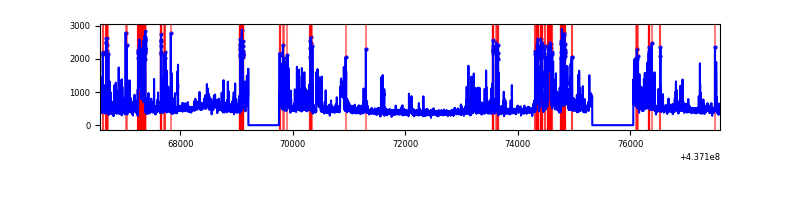 |
| C | 11024 | 9749 | 282 | 282 | 2.56% | 2.89% | 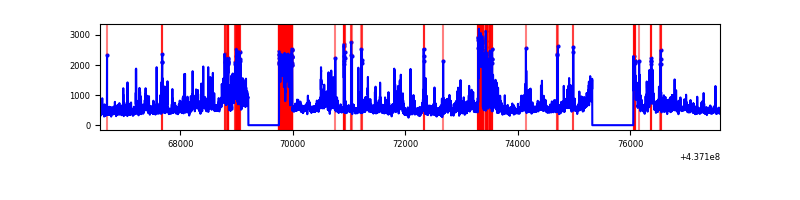 |
| D | 11024 | 9749 | 563 | 563 | 5.11% | 5.77% | 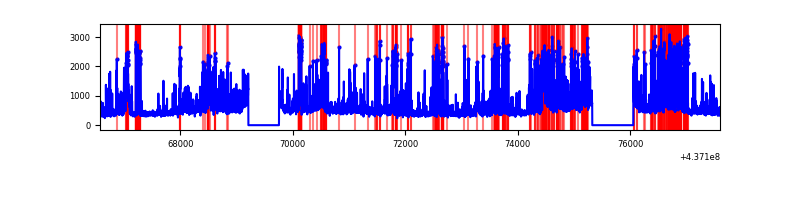 |
Top three noisy pixels from each quadrant. If the there are fewer than three noisy pixels in the level2.evt file, extra rows are filled as -1
| Pixel properties | Quadrant properties | ||||||
|---|---|---|---|---|---|---|---|
| Quadrant | DetID | PixID | Counts | Sigma | Mean | Median | Sigma |
| A | 15 | 223 | 3667875 | 17782.08 | 992 | 971 | 206.2 |
| A | 10 | 83 | 1316265 | 6378.31 | 992 | 971 | 206.2 |
| A | 7 | 16 | 71711 | 343.04 | 992 | 971 | 206.2 |
| B | 5 | 235 | 1306910 | 6351.54 | 1055 | 1025 | 205.6 |
| B | 4 | 170 | 222292 | 1076.19 | 1055 | 1025 | 205.6 |
| B | 5 | 172 | 127489 | 615.09 | 1055 | 1025 | 205.6 |
| C | 3 | 233 | 2100391 | 8644.18 | 1034 | 1036 | 242.9 |
| C | 12 | 16 | 331432 | 1360.42 | 1034 | 1036 | 242.9 |
| C | 14 | 254 | 158933 | 650.15 | 1034 | 1036 | 242.9 |
| D | 7 | 80 | 672845 | 2605.69 | 1025 | 993 | 257.8 |
| D | 5 | 235 | 559442 | 2165.87 | 1025 | 993 | 257.8 |
| D | 12 | 17 | 397964 | 1539.6 | 1025 | 993 | 257.8 |
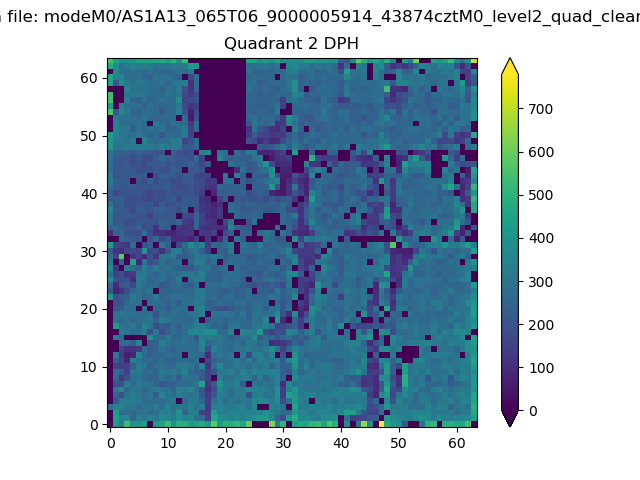
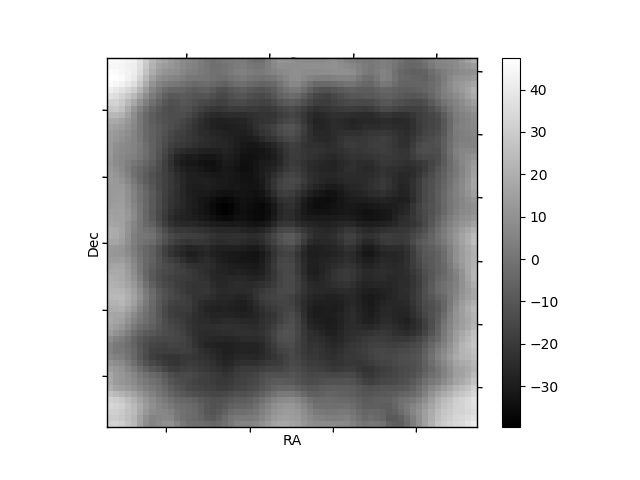
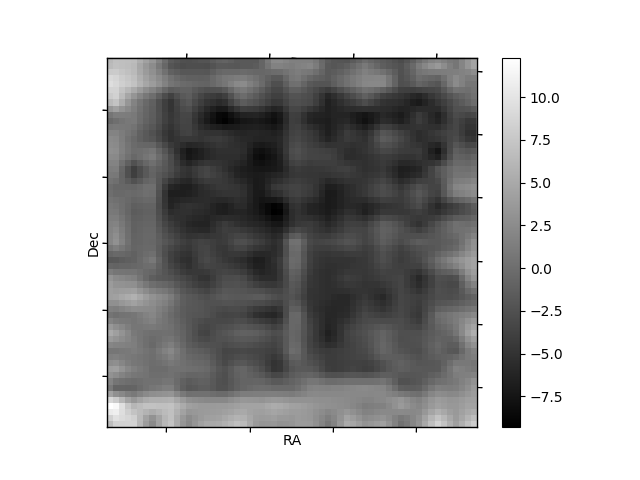
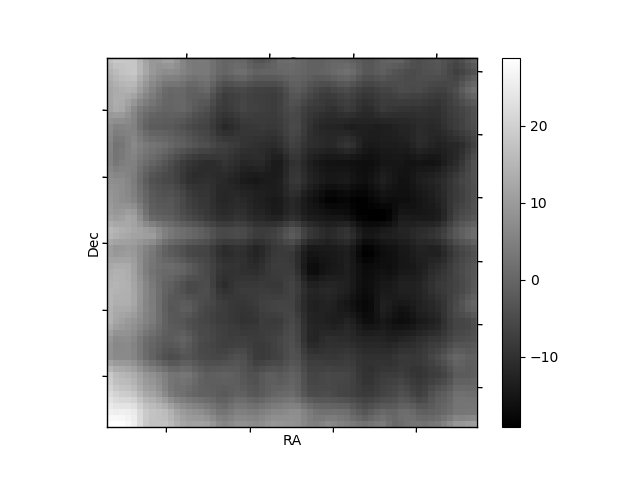
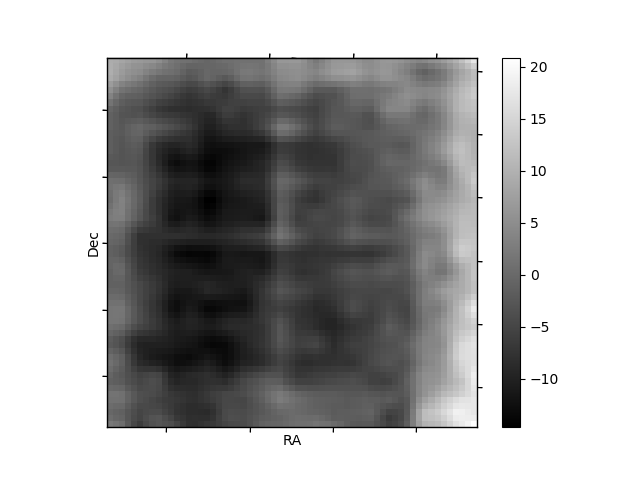
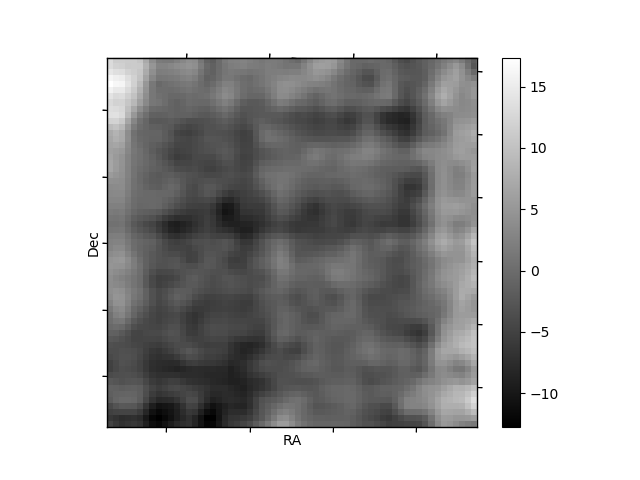
Histogram calculated using DETX and DETY for each event in the final _common_clean file
| Quadrant A | 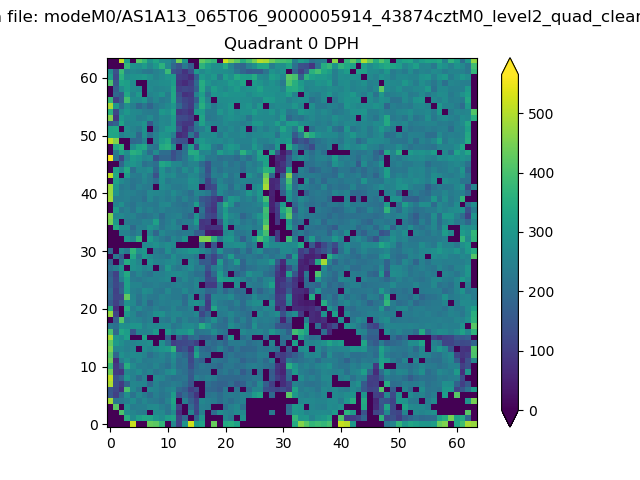 |
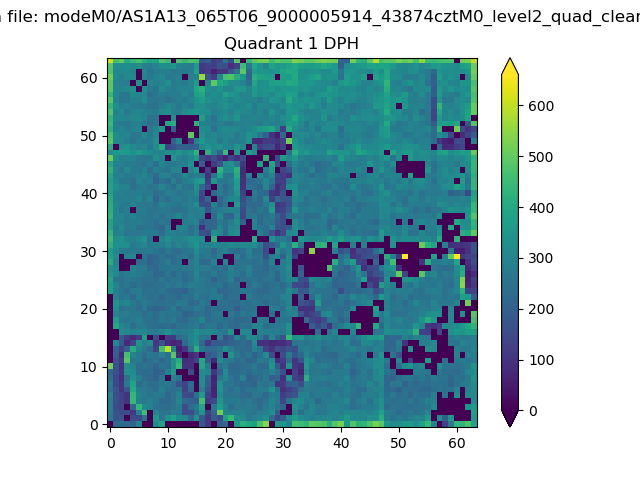 |
Quadrant B |
|---|---|---|---|
| Quadrant D | 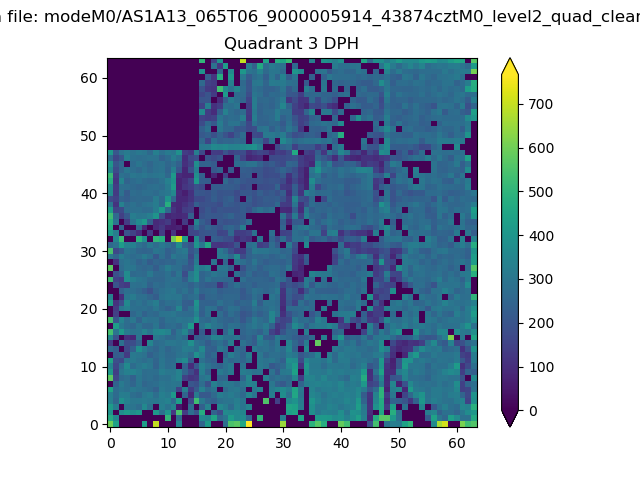 |
 |
Quadrant C |
| Plot type | Count rate plots | Images |
|---|---|---|
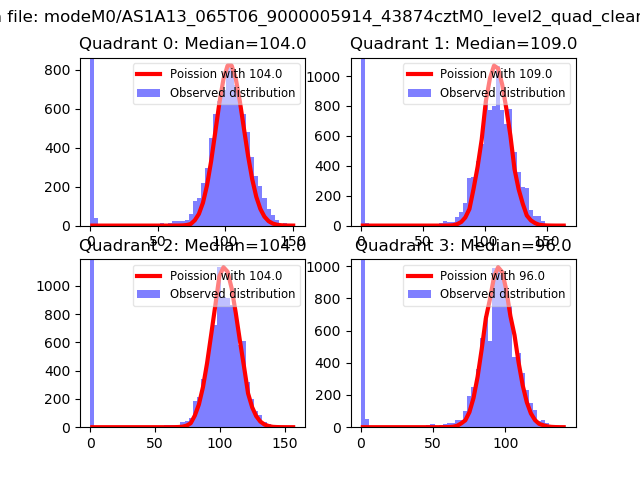
| Comparison with Poisson distribution Blue bars denote a histogram of data divided into 1 sec bins. Red curve is a Poisson curve with rate = median count rate of data. |
 |
 |
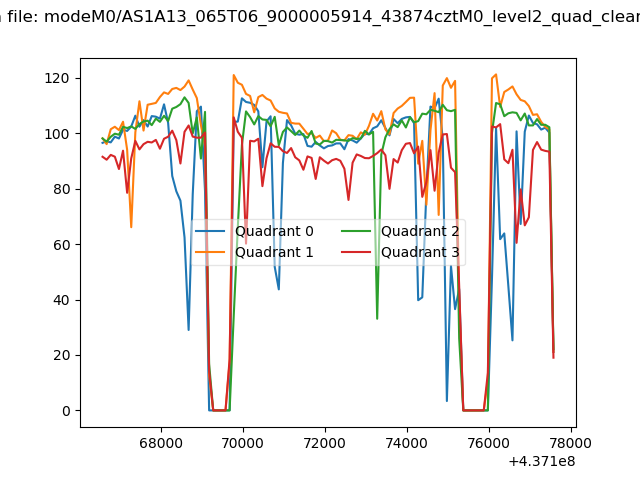
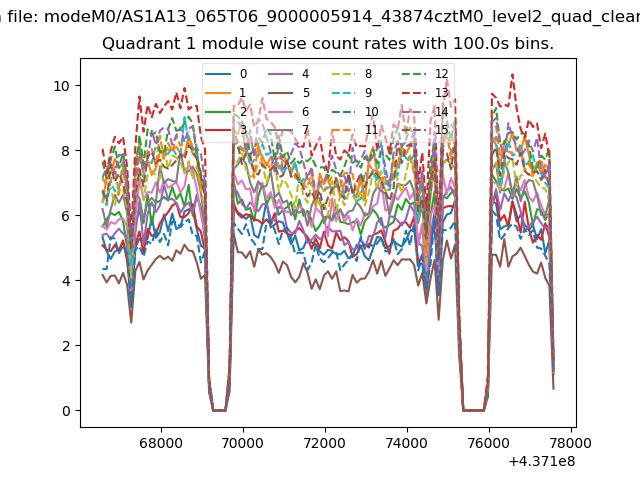
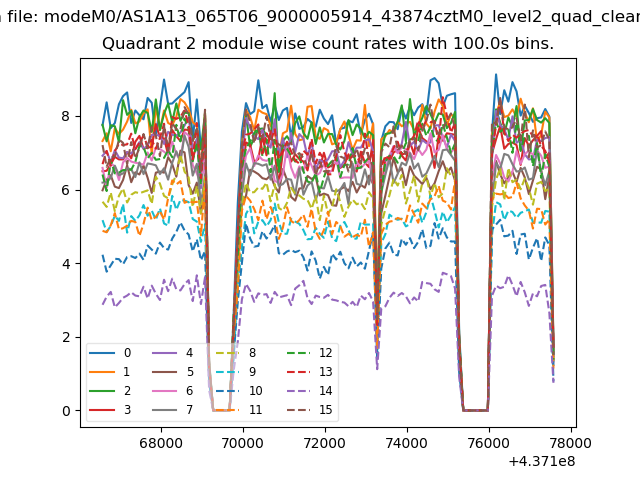
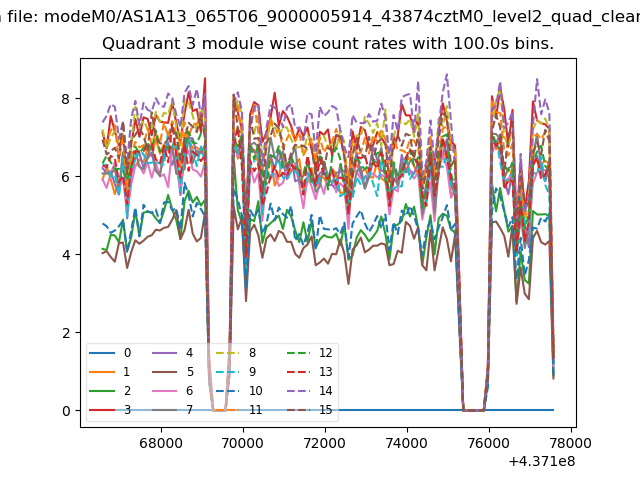
| Quadrant-wise count rates Data is divided into 100 sec bins |
 |
|
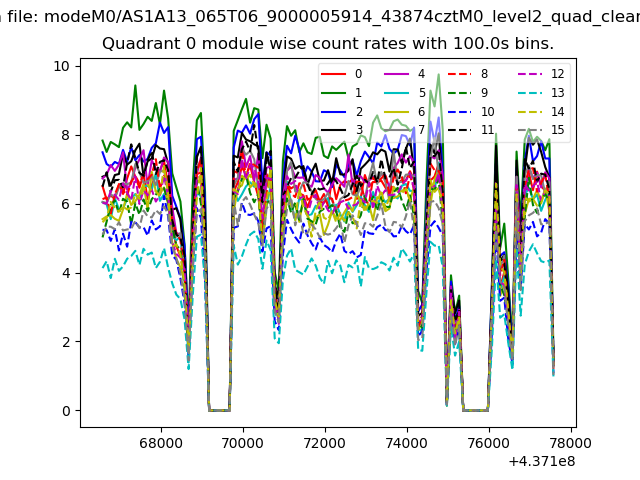
| Module-wise count rates for Quadrant A Data is divided into 100 sec bins |
 |
 |
| Module-wise count rates for Quadrant B Data is divided into 100 sec bins |
 |
 |
| Module-wise count rates for Quadrant C Data is divided into 100 sec bins |
 |
 |
| Module-wise count rates for Quadrant D Data is divided into 100 sec bins |
 |
 |
| Parameter | Plot |
|---|---|
| CZT HV Monitor | 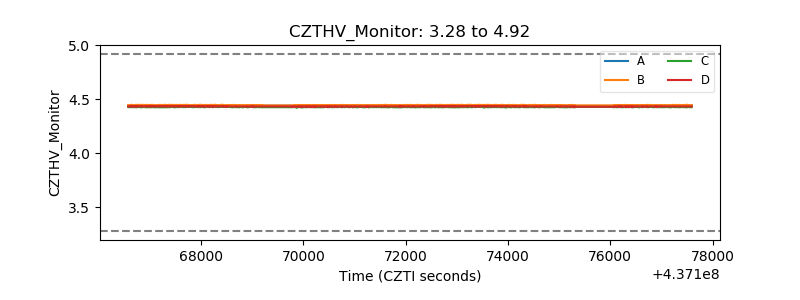 |
| D_VDD | 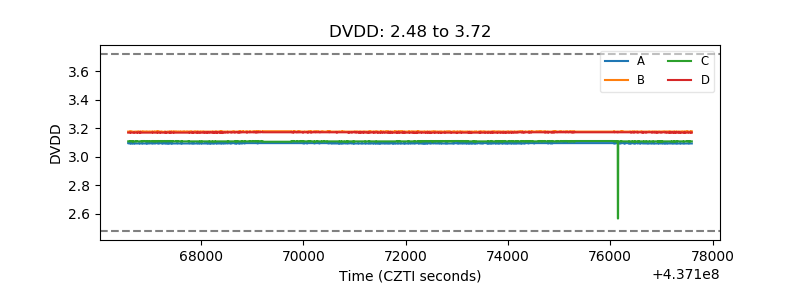 |
| Temperature 1 | 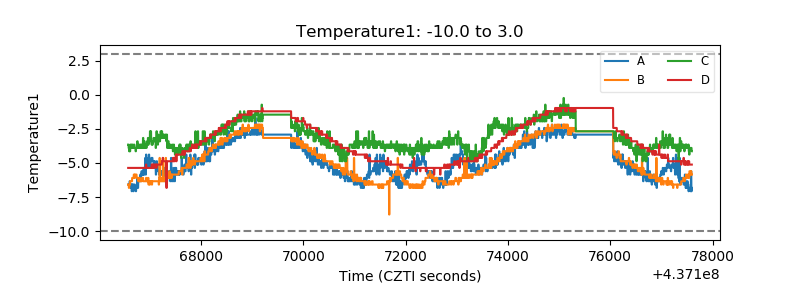 |
| Veto HV Monitor | 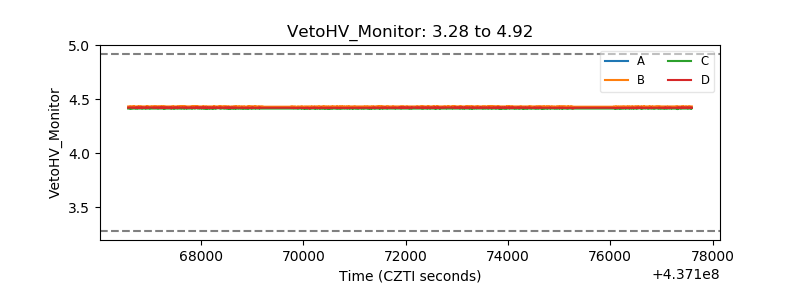 |
| Veto LLD | 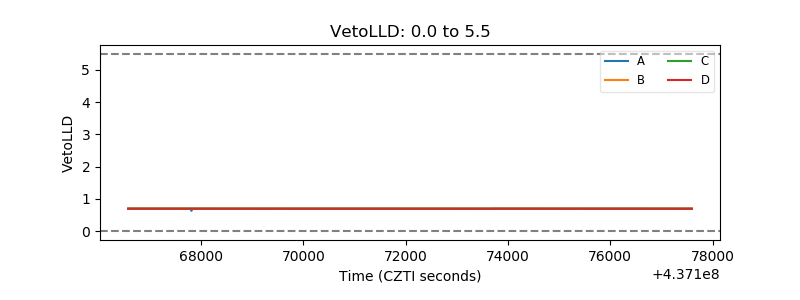 |
| Alpha Counter | 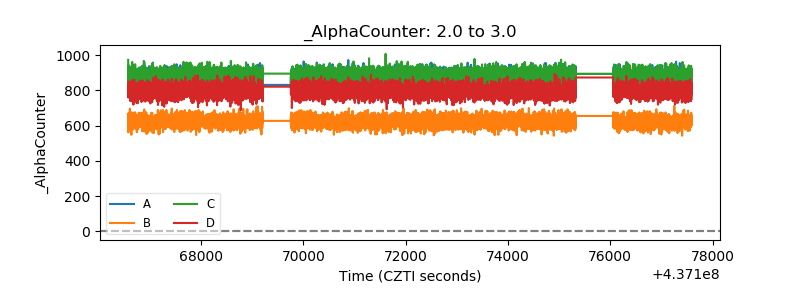 |
| _CPM_Rate | 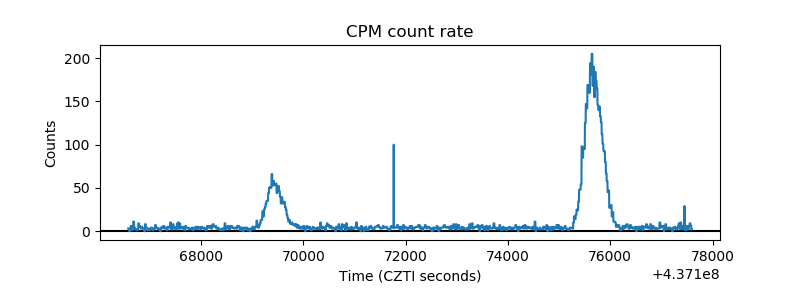 |
| CZT Counter | 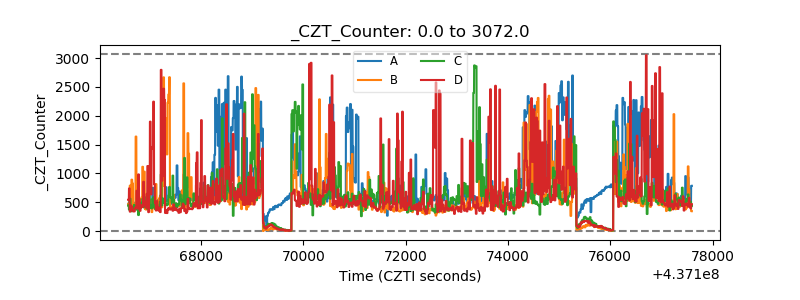 |
| +2.5 Volts monitor | 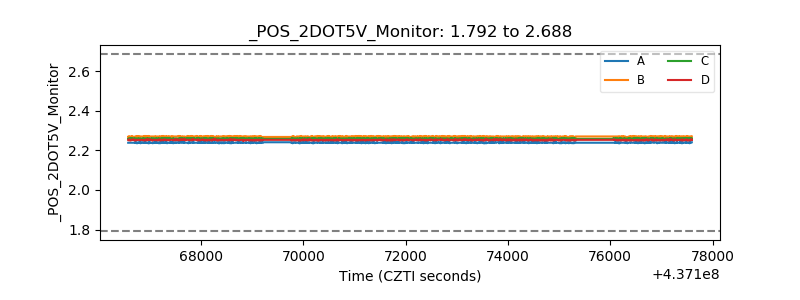 |
| +5 Volts monitor | 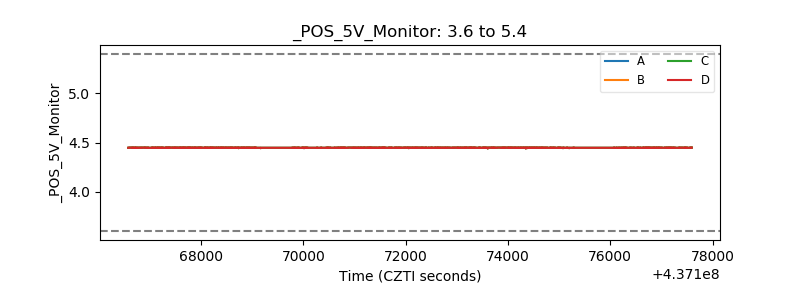 |
| _ROLL_ROT | 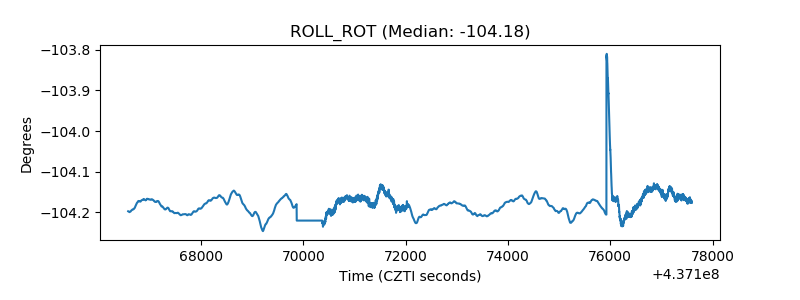 |
| _Roll_DEC | 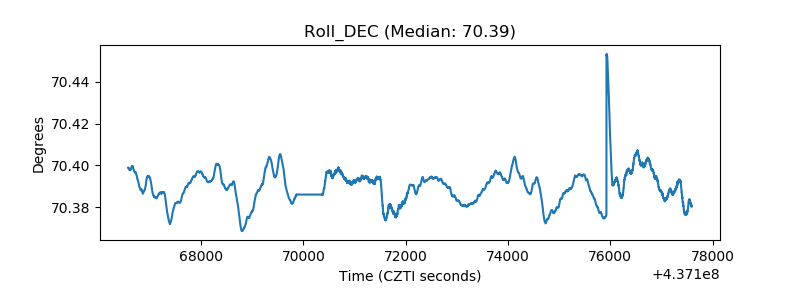 |
| _Roll_RA | 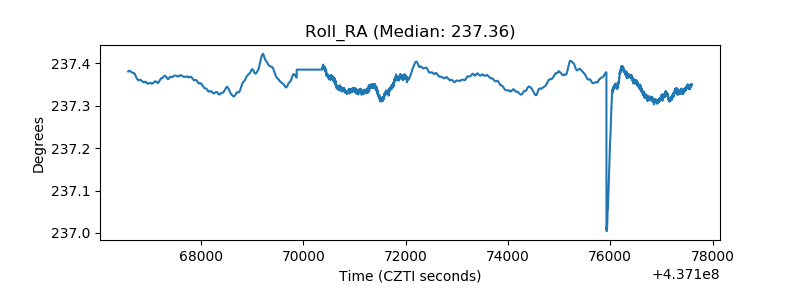 |
| Veto Counter | 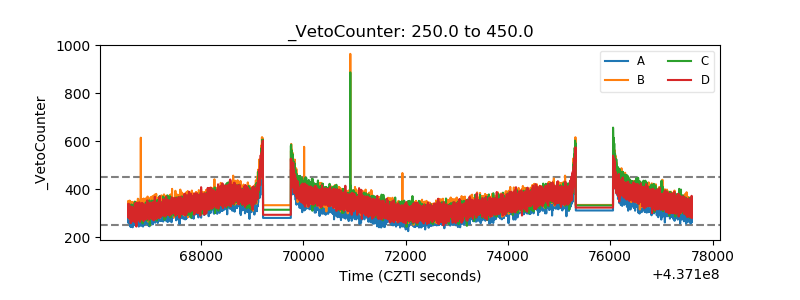 |