| Param | Original file | Final file |
|---|---|---|
| Filename | modeM0/AS1A13_065T06_9000005914_43877cztM0_level2.fits | modeM0/AS1A13_065T06_9000005914_43877cztM0_level2_quad_clean.evt |
| Size (bytes) | 443,963,520 | 99,699,840 |
| Size | 423.4 MB | 95.1 MB |
| Events in quadrant A | 4,132,260 | 664,312 |
| Events in quadrant B | 2,811,091 | 697,785 |
| Events in quadrant C | 3,668,655 | 663,957 |
| Events in quadrant D | 5,339,833 | 559,304 |
| Mode M0 | |||
|---|---|---|---|
| Quadrant | BADHDUFLAG | Total packets | Discarded packets |
| A | 0 | 16401 | 1 |
| B | 0 | 12847 | 1 |
| C | 0 | 15154 | 1 |
| D | 0 | 20181 | 1 |
| Mode M9 | |||
|---|---|---|---|
| Quadrant | BADHDUFLAG | Total packets | Discarded packets |
| A | 0 | 11 | 0 |
| B | 0 | 11 | 0 |
| C | 0 | 11 | 0 |
| D | 0 | 11 | 0 |
| Mode SS | |||
|---|---|---|---|
| Quadrant | BADHDUFLAG | Total packets | Discarded packets |
| A | 0 | 126 | 0 |
| B | 0 | 126 | 0 |
| C | 0 | 126 | 0 |
| D | 0 | 126 | 0 |
| Quadrant | Total seconds | Saturated seconds | Saturation percentage |
|---|---|---|---|
| A | 6210 | 110 | 1.771337% |
| B | 6210 | 14 | 0.225443% |
| C | 6211 | 46 | 0.740621% |
| D | 6211 | 625 | 10.062792% |
Noise dominated data is calculated using 1-second bins in cleaned event files. If a bin has >2000 counts, and if more than 50% of those come from <1% of pixels, then it is considered to be noise-dominated and hence unusable.
| Quadrant | # 1 sec bins | Bins with >0 counts | Bins with >2000 counts | High rate bins dominated by noise | Noise dominated (total time) | Noise dominated (detector-on time) | Marked lightcurve |
|---|---|---|---|---|---|---|---|
| A | 7315 | 6211 | 69 | 69 | 0.94% | 1.11% | 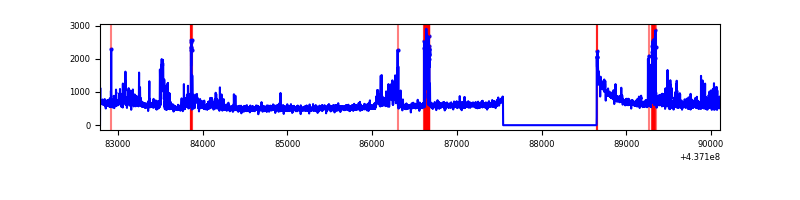 |
| B | 7315 | 6211 | 4 | 4 | 0.05% | 0.06% | 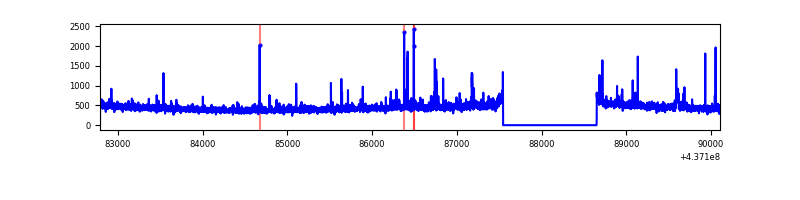 |
| C | 7316 | 6212 | 38 | 38 | 0.52% | 0.61% | 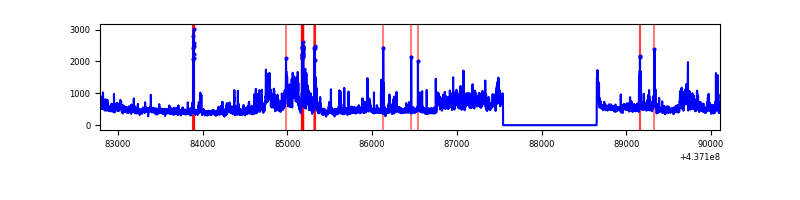 |
| D | 7316 | 6212 | 642 | 642 | 8.78% | 10.33% | 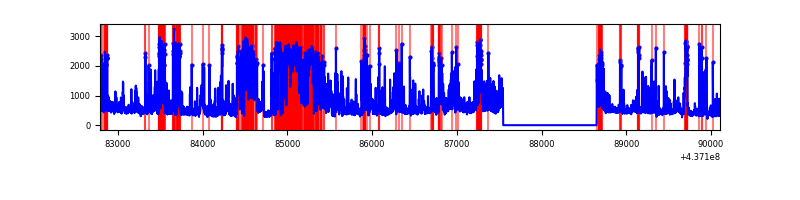 |
Top three noisy pixels from each quadrant. If the there are fewer than three noisy pixels in the level2.evt file, extra rows are filled as -1
| Pixel properties | Quadrant properties | ||||||
|---|---|---|---|---|---|---|---|
| Quadrant | DetID | PixID | Counts | Sigma | Mean | Median | Sigma |
| A | 10 | 83 | 928778 | 6776.26 | 667 | 654 | 137.0 |
| A | 15 | 223 | 601608 | 4387.58 | 667 | 654 | 137.0 |
| A | 13 | 6 | 10634 | 72.86 | 667 | 654 | 137.0 |
| B | 5 | 235 | 44511 | 334.1 | 675 | 655 | 131.3 |
| B | 4 | 170 | 28377 | 211.19 | 675 | 655 | 131.3 |
| B | 7 | 205 | 19260 | 141.73 | 675 | 655 | 131.3 |
| C | 3 | 233 | 937019 | 6093.22 | 656 | 660 | 153.7 |
| C | 14 | 254 | 81252 | 524.44 | 656 | 660 | 153.7 |
| C | 15 | 158 | 27174 | 172.54 | 656 | 660 | 153.7 |
| D | 7 | 80 | 1559221 | 9732.12 | 629 | 609 | 160.2 |
| D | 5 | 235 | 402348 | 2508.5 | 629 | 609 | 160.2 |
| D | 13 | 138 | 174003 | 1082.69 | 629 | 609 | 160.2 |
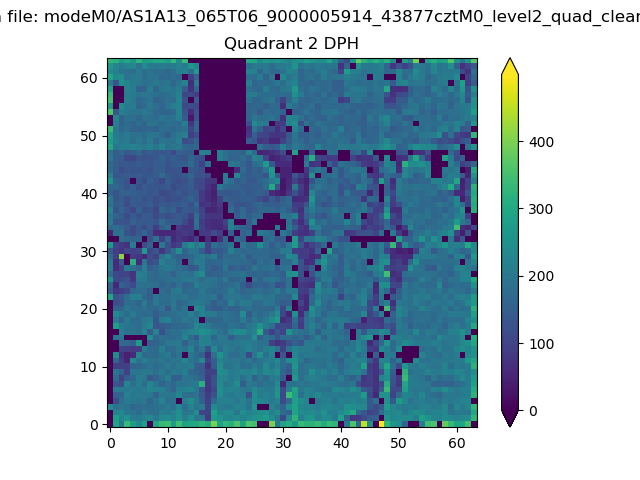
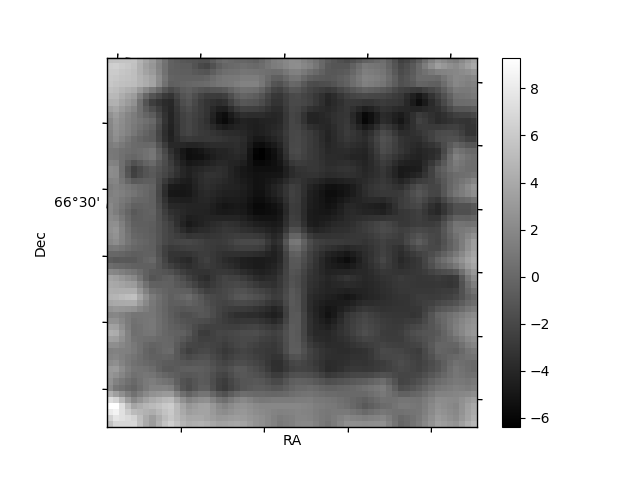
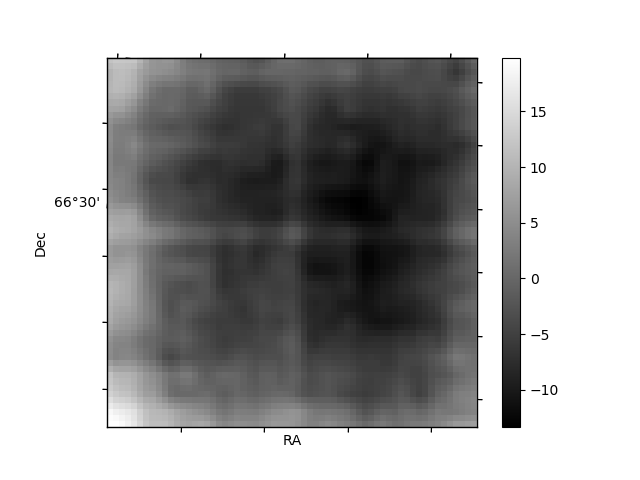
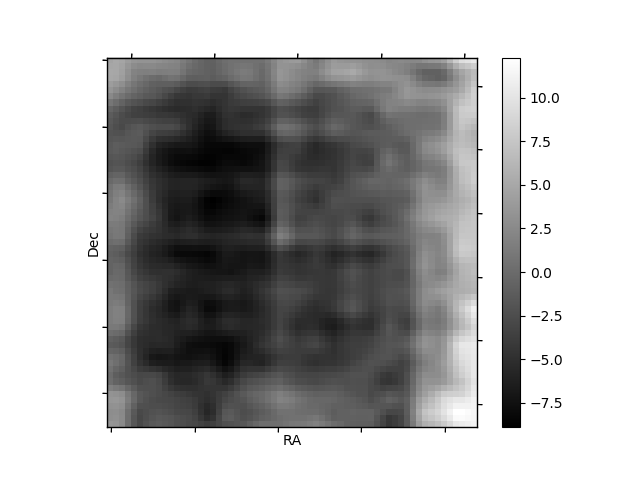
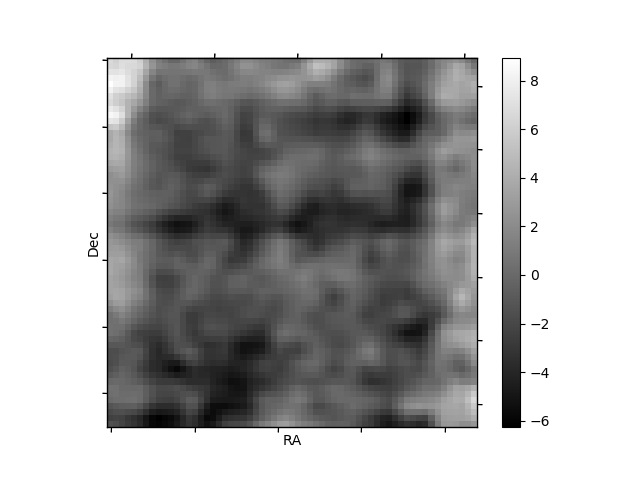
Histogram calculated using DETX and DETY for each event in the final _common_clean file
| Quadrant A | 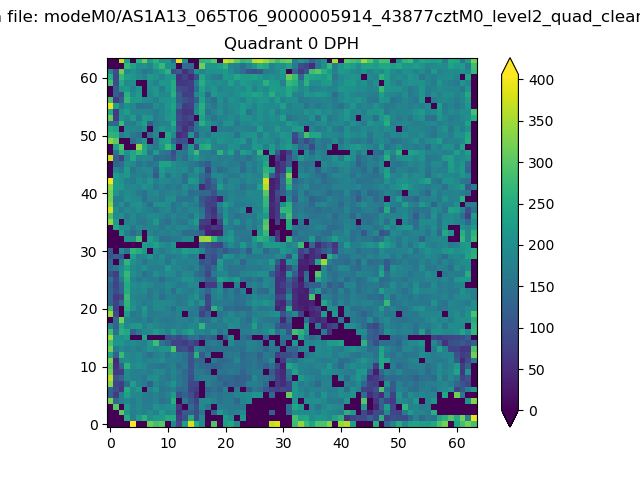 |
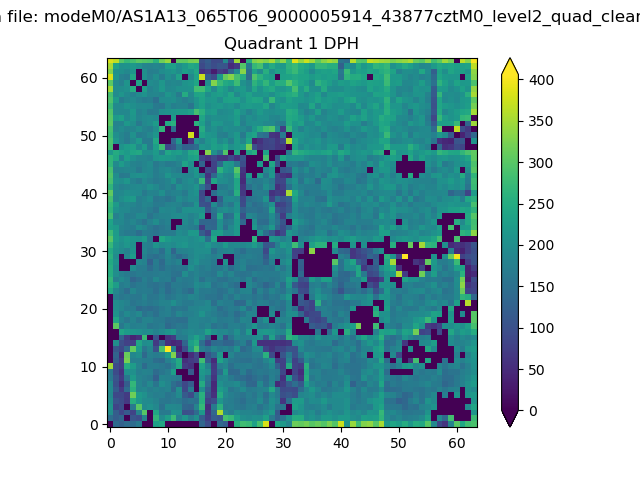 |
Quadrant B |
|---|---|---|---|
| Quadrant D | 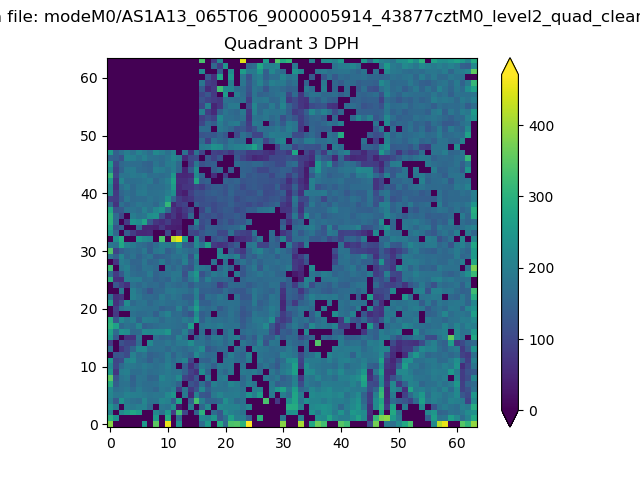 |
 |
Quadrant C |
| Plot type | Count rate plots | Images |
|---|---|---|
| Comparison with Poisson distribution Blue bars denote a histogram of data divided into 1 sec bins. Red curve is a Poisson curve with rate = median count rate of data. |
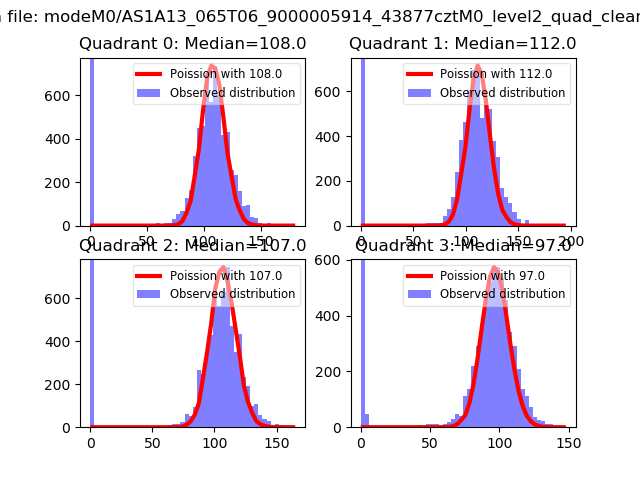 |
 |
| Quadrant-wise count rates Data is divided into 100 sec bins |
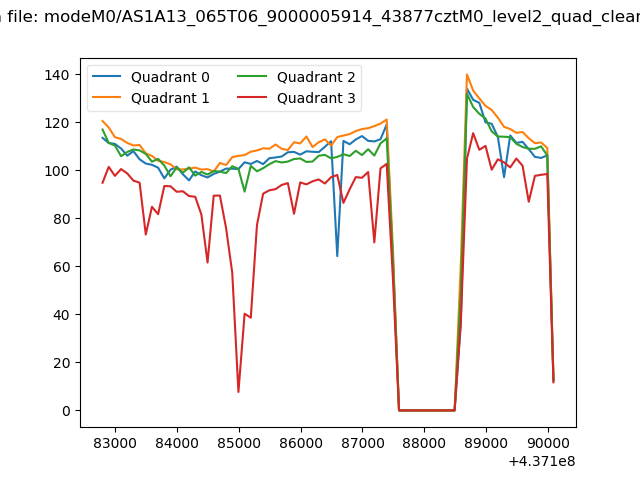 |
|
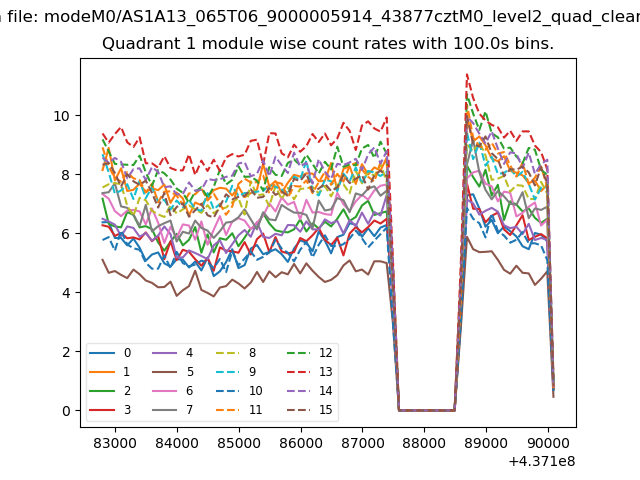
| Module-wise count rates for Quadrant A Data is divided into 100 sec bins |
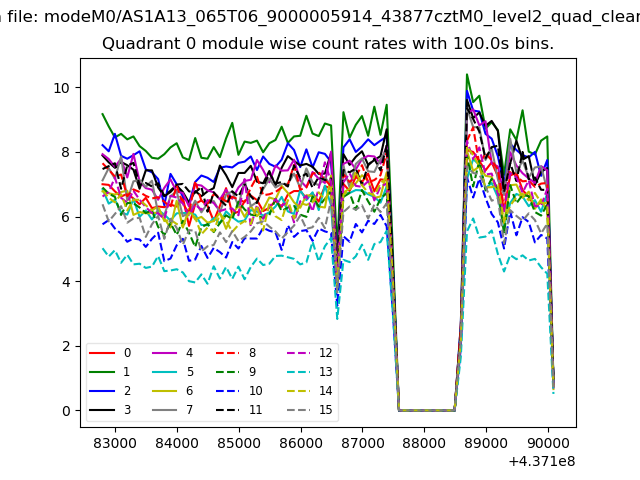 |
 |
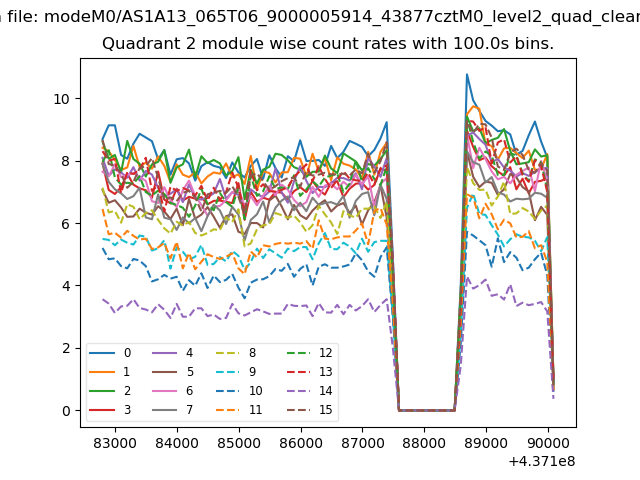
| Module-wise count rates for Quadrant B Data is divided into 100 sec bins |
 |
 |
| Module-wise count rates for Quadrant C Data is divided into 100 sec bins |
 |
 |
| Module-wise count rates for Quadrant D Data is divided into 100 sec bins |
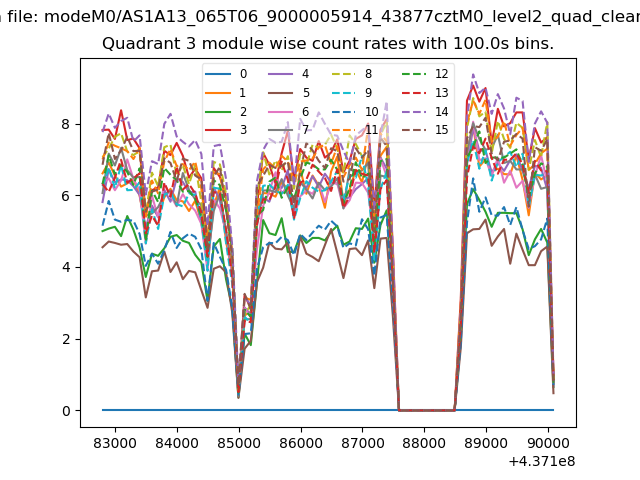 |
 |
| Parameter | Plot |
|---|---|
| CZT HV Monitor | 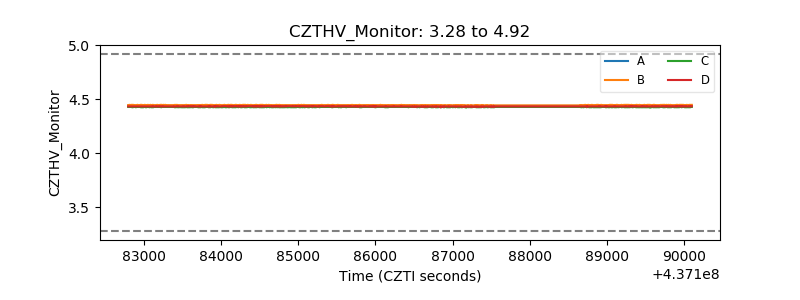 |
| D_VDD | 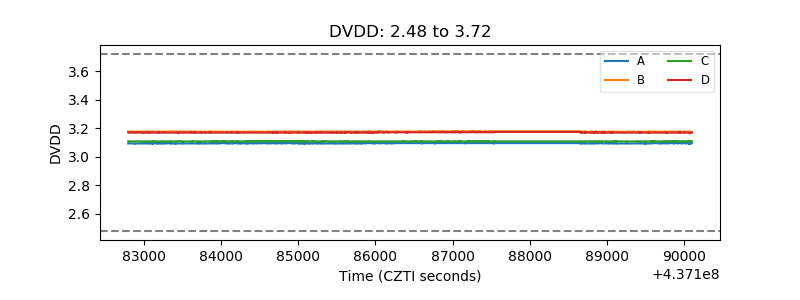 |
| Temperature 1 | 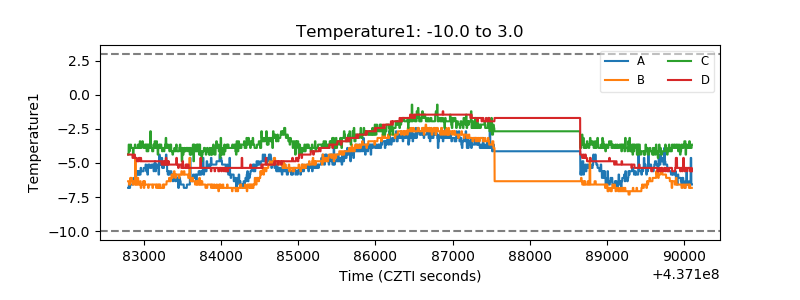 |
| Veto HV Monitor |  |
| Veto LLD | 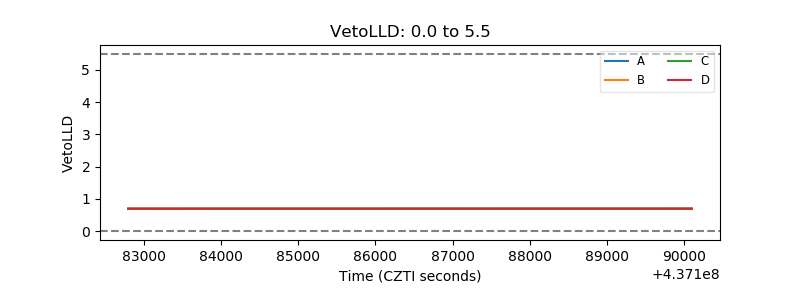 |
| Alpha Counter | 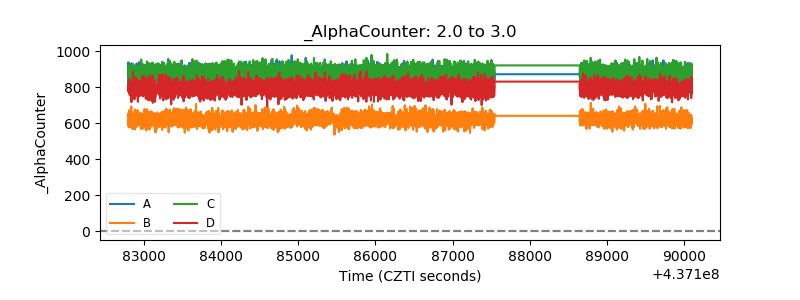 |
| _CPM_Rate | 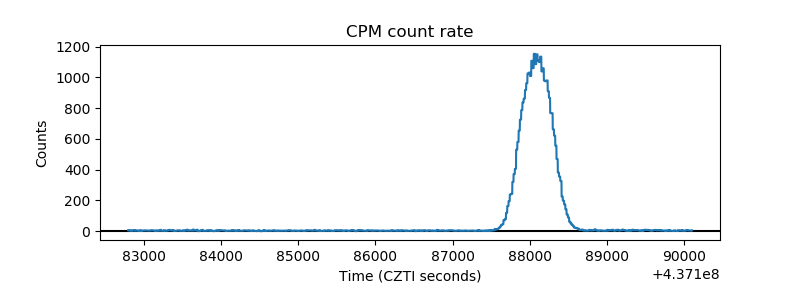 |
| CZT Counter | 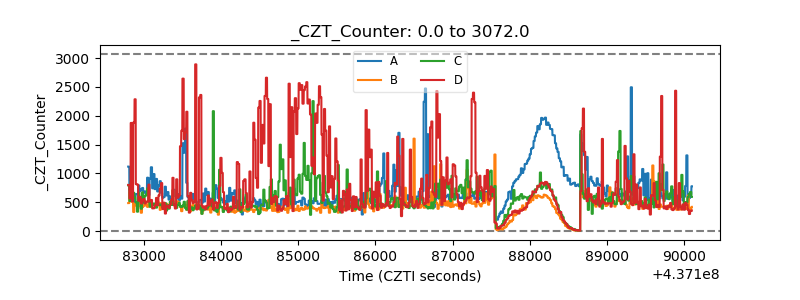 |
| +2.5 Volts monitor | 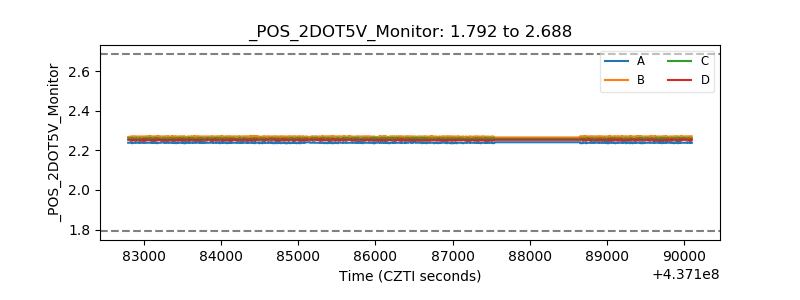 |
| +5 Volts monitor | 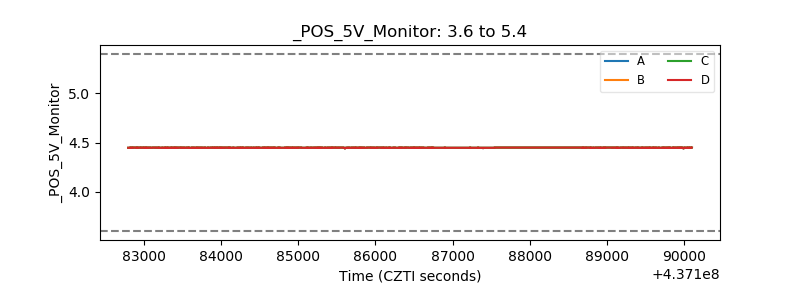 |
| _ROLL_ROT | 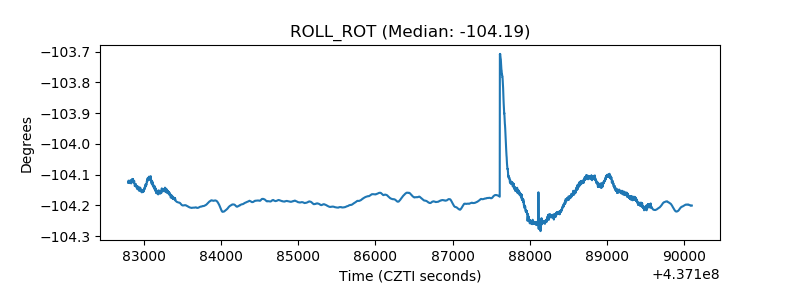 |
| _Roll_DEC | 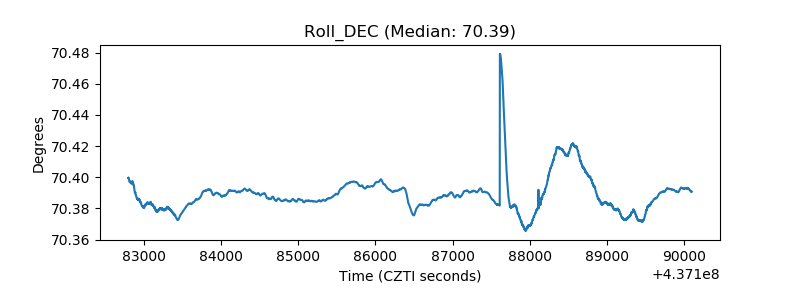 |
| _Roll_RA | 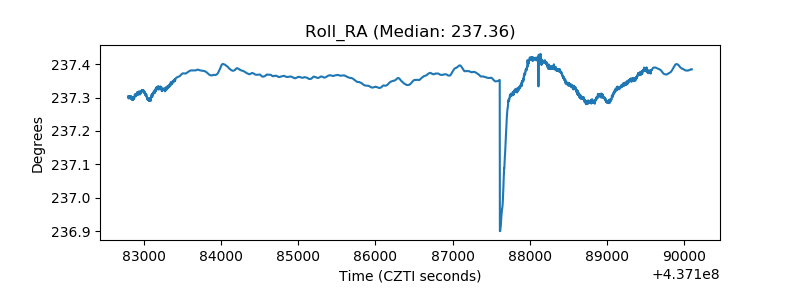 |
| Veto Counter | 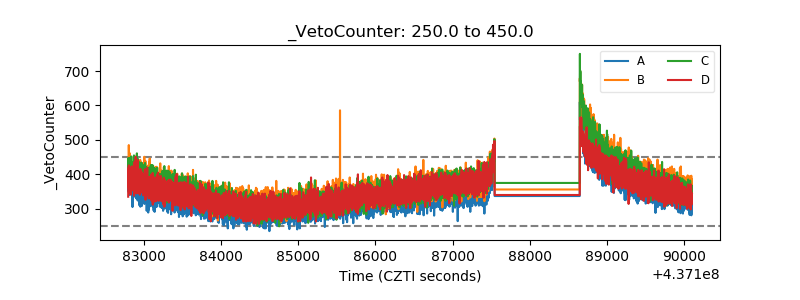 |