| Param | Original file | Final file |
|---|---|---|
| Filename | modeM0/AS1A13_065T06_9000005914_43880cztM0_level2.fits | modeM0/AS1A13_065T06_9000005914_43880cztM0_level2_quad_clean.evt |
| Size (bytes) | 458,127,360 | 111,654,720 |
| Size | 436.9 MB | 106.5 MB |
| Events in quadrant A | 5,073,562 | 729,965 |
| Events in quadrant B | 3,527,074 | 793,251 |
| Events in quadrant C | 3,356,243 | 742,678 |
| Events in quadrant D | 4,494,461 | 660,241 |
Noise dominated data is calculated using 1-second bins in cleaned event files. If a bin has >2000 counts, and if more than 50% of those come from <1% of pixels, then it is considered to be noise-dominated and hence unusable.
| Quadrant | # 1 sec bins | Bins with >0 counts | Bins with >2000 counts | High rate bins dominated by noise | Noise dominated (total time) | Noise dominated (detector-on time) | Marked lightcurve |
|---|---|---|---|---|---|---|---|
| A | 7723 | 6524 | 332 | 332 | 4.30% | 5.09% | 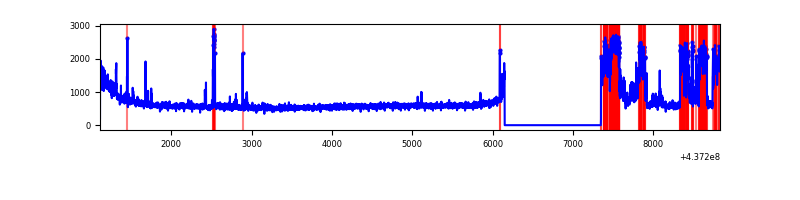 |
| B | 7722 | 6523 | 97 | 97 | 1.26% | 1.49% | 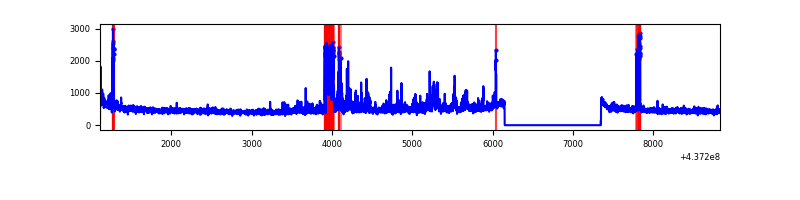 |
| C | 7722 | 6523 | 22 | 22 | 0.28% | 0.34% | 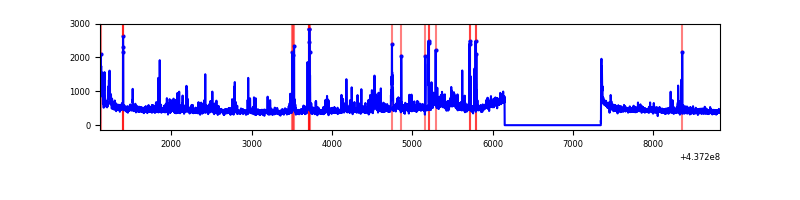 |
| D | 7722 | 6523 | 306 | 306 | 3.96% | 4.69% | 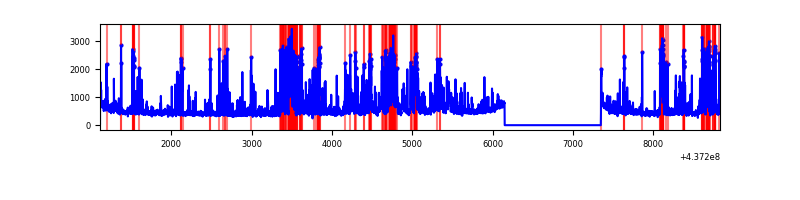 |
Top three noisy pixels from each quadrant. If the there are fewer than three noisy pixels in the level2.evt file, extra rows are filled as -1
| Pixel properties | Quadrant properties | ||||||
|---|---|---|---|---|---|---|---|
| Quadrant | DetID | PixID | Counts | Sigma | Mean | Median | Sigma |
| A | 10 | 83 | 1058600 | 7057.16 | 735 | 721 | 149.9 |
| A | 15 | 223 | 1050772 | 7004.94 | 735 | 721 | 149.9 |
| A | 15 | 174 | 65692 | 433.42 | 735 | 721 | 149.9 |
| B | 4 | 170 | 308444 | 2159.4 | 744 | 721 | 142.5 |
| B | 0 | 200 | 159350 | 1113.16 | 744 | 721 | 142.5 |
| B | 0 | 183 | 47128 | 325.65 | 744 | 721 | 142.5 |
| C | 3 | 233 | 358679 | 2138.62 | 718 | 722 | 167.4 |
| C | 14 | 254 | 86981 | 515.36 | 718 | 722 | 167.4 |
| C | 15 | 173 | 32185 | 187.98 | 718 | 722 | 167.4 |
| D | 1 | 52 | 564706 | 3187.68 | 709 | 687 | 176.9 |
| D | 5 | 235 | 396351 | 2236.19 | 709 | 687 | 176.9 |
| D | 13 | 171 | 300539 | 1694.68 | 709 | 687 | 176.9 |
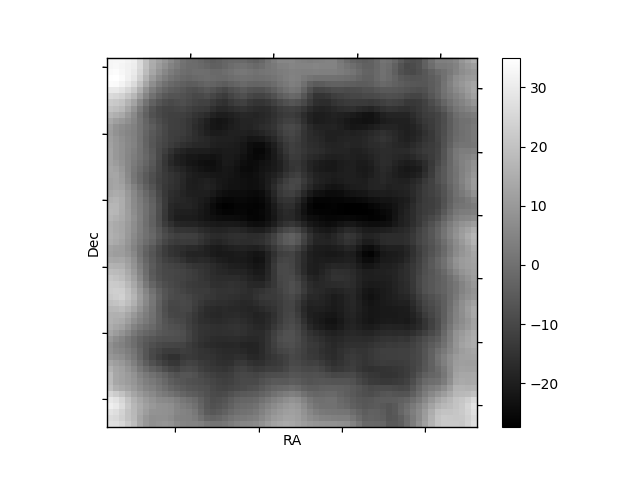
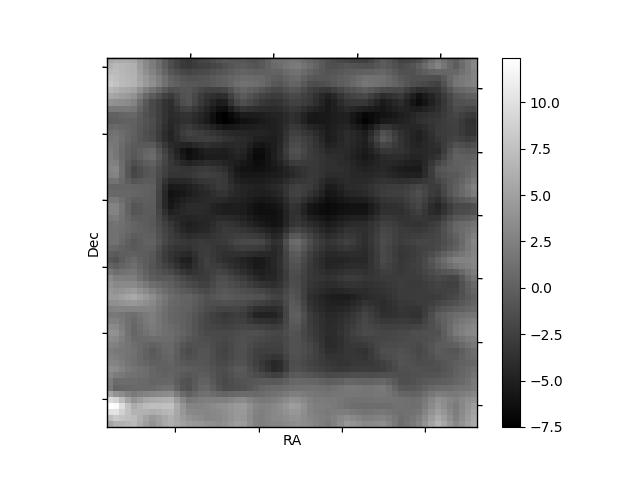
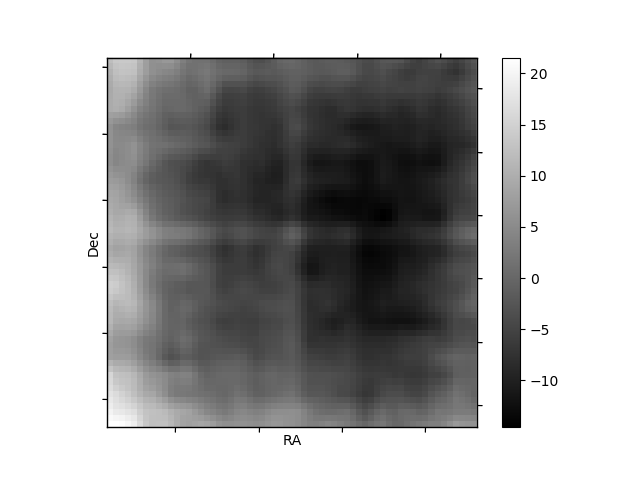
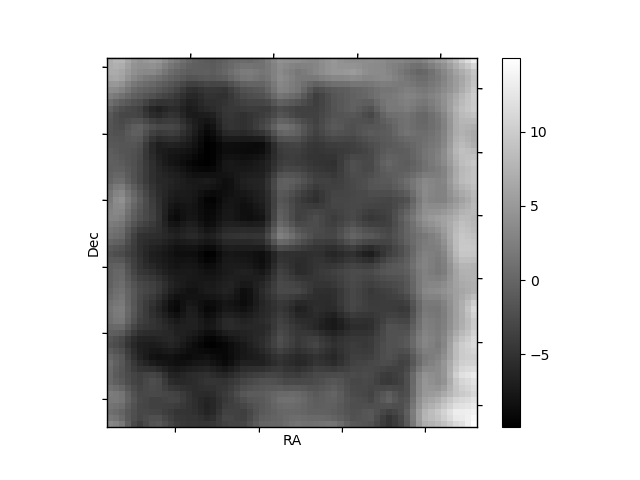
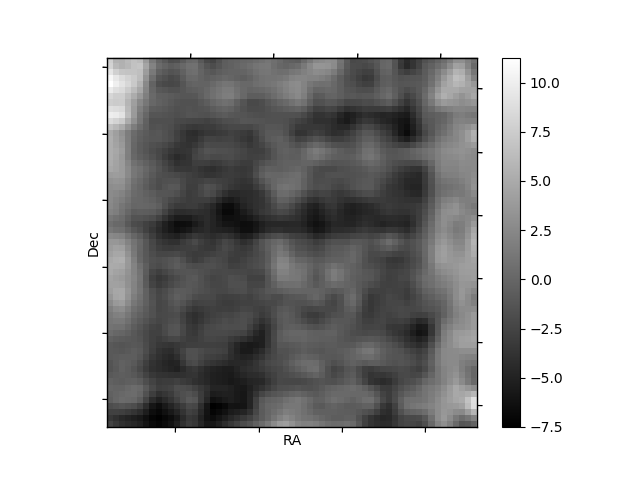
Histogram calculated using DETX and DETY for each event in the final _common_clean file
| Quadrant A | 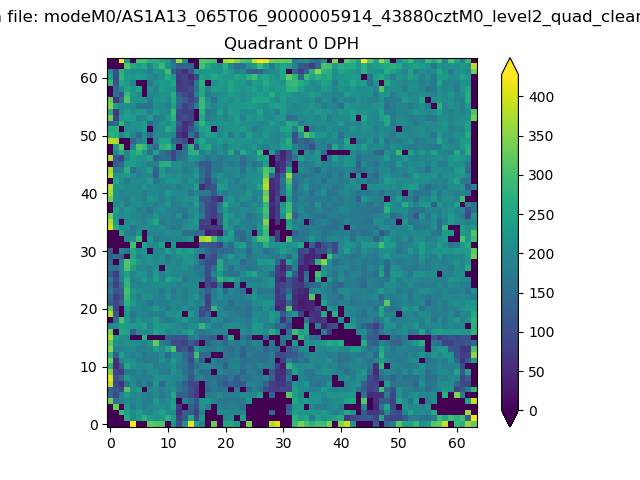 |
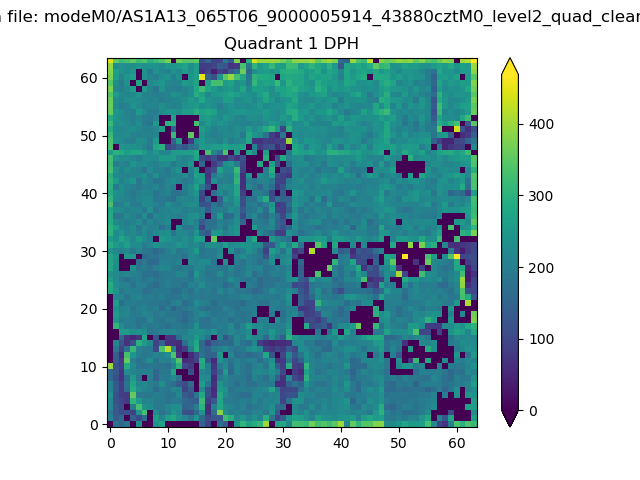 |
Quadrant B |
|---|---|---|---|
| Quadrant D | 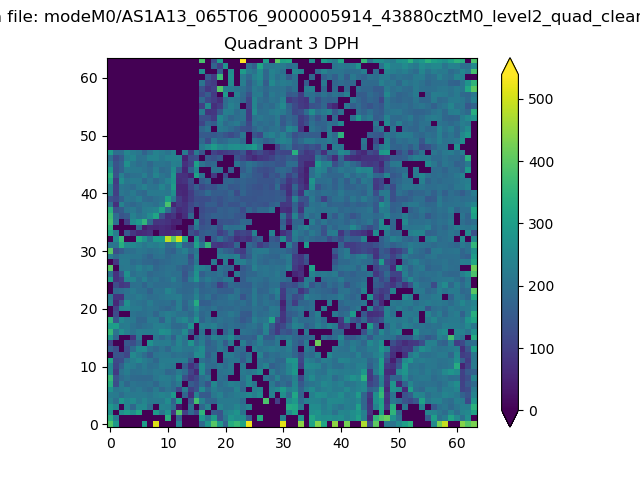 |
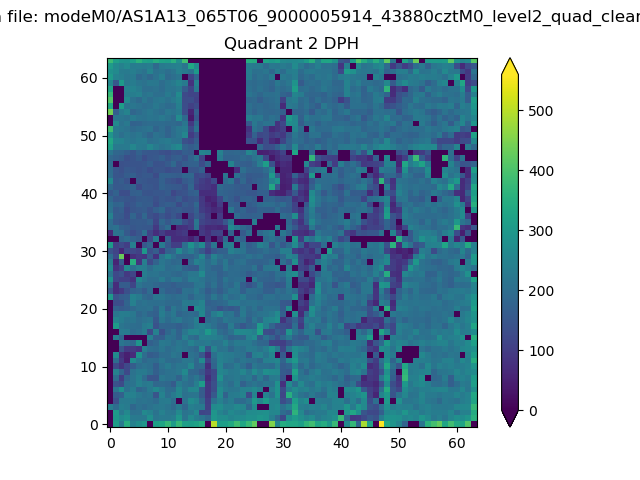 |
Quadrant C |
| Plot type | Count rate plots | Images |
|---|---|---|
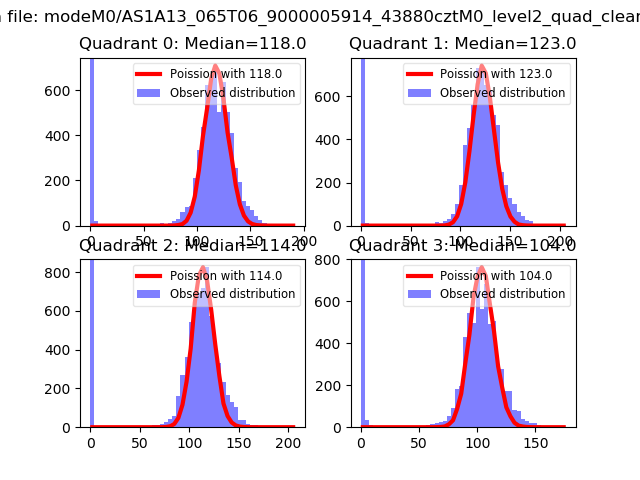
| Comparison with Poisson distribution Blue bars denote a histogram of data divided into 1 sec bins. Red curve is a Poisson curve with rate = median count rate of data. |
 |
 |
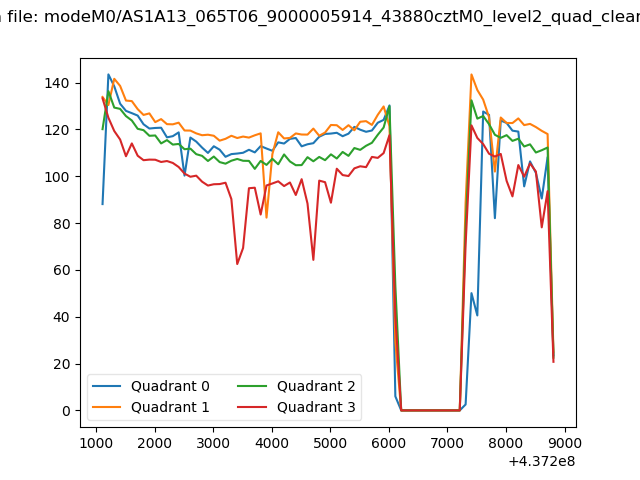
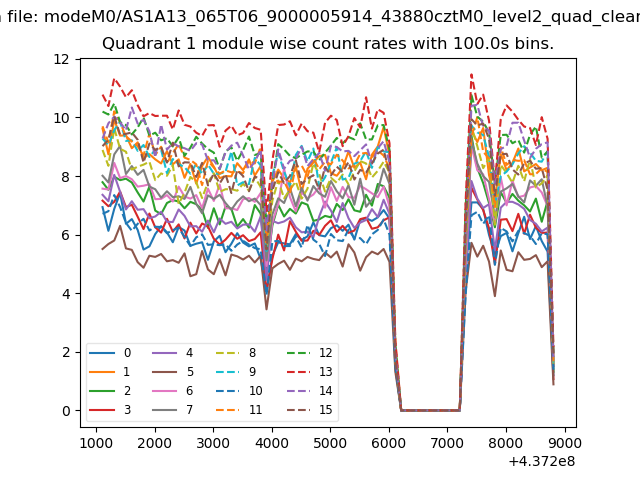
| Quadrant-wise count rates Data is divided into 100 sec bins |
 |
|
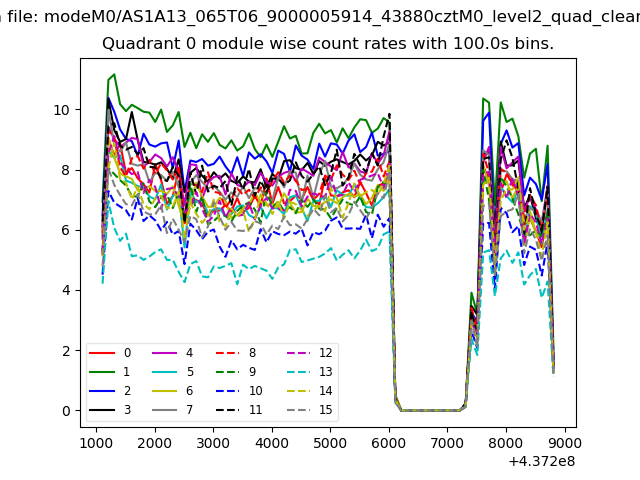
| Module-wise count rates for Quadrant A Data is divided into 100 sec bins |
 |
 |
| Module-wise count rates for Quadrant B Data is divided into 100 sec bins |
 |
 |
| Module-wise count rates for Quadrant C Data is divided into 100 sec bins |
 |
 |
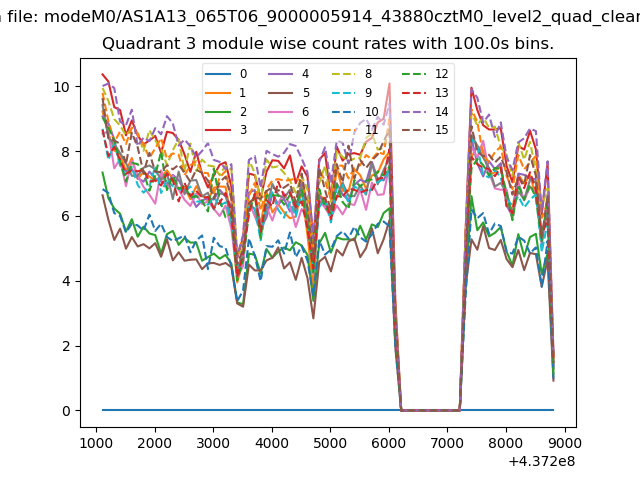
| Module-wise count rates for Quadrant D Data is divided into 100 sec bins |
 |
 |
| Parameter | Plot |
|---|---|
| CZT HV Monitor | 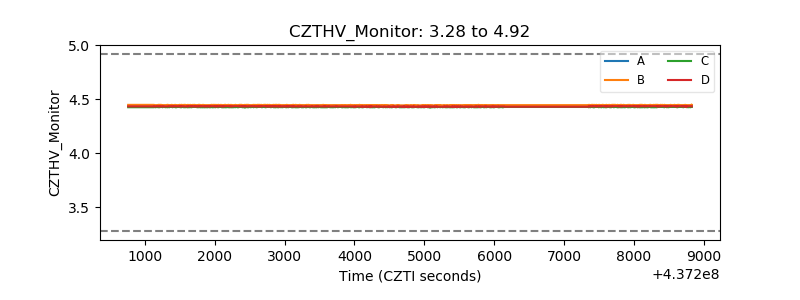 |
| D_VDD | 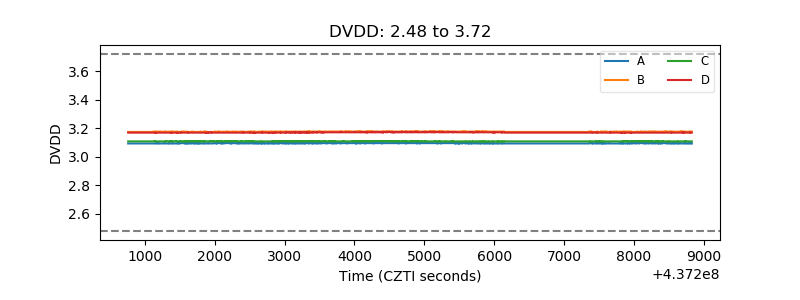 |
| Temperature 1 | 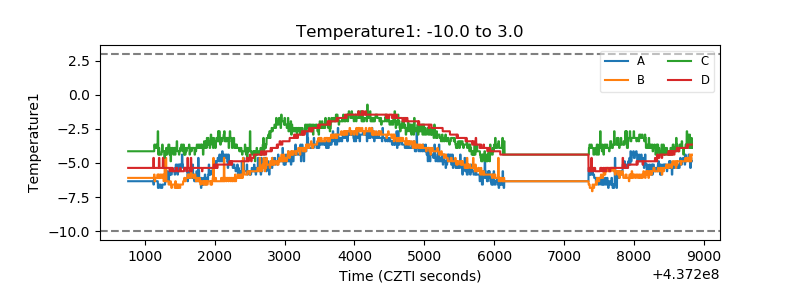 |
| Veto HV Monitor | 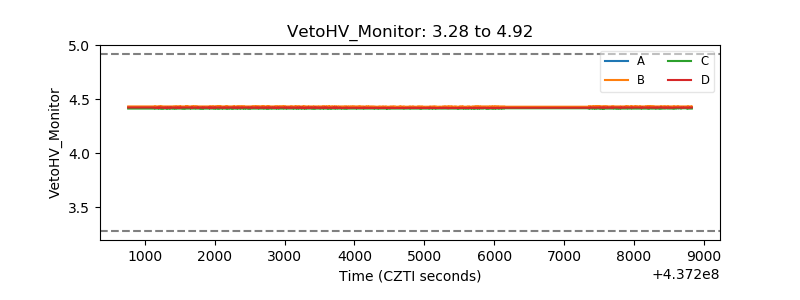 |
| Veto LLD | 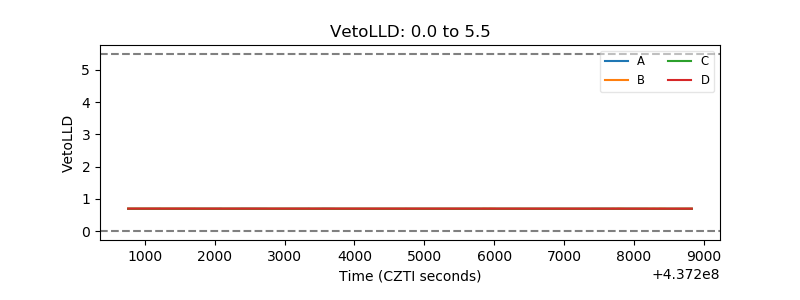 |
| Alpha Counter | 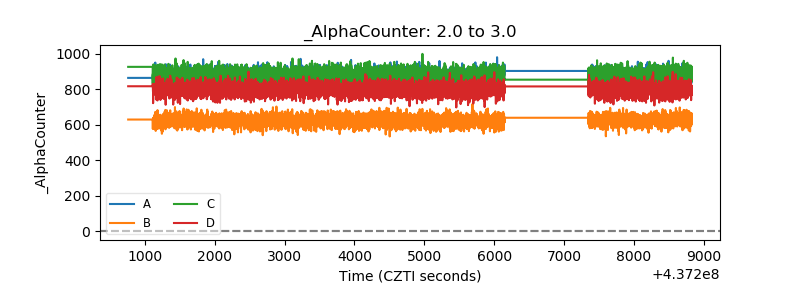 |
| _CPM_Rate | 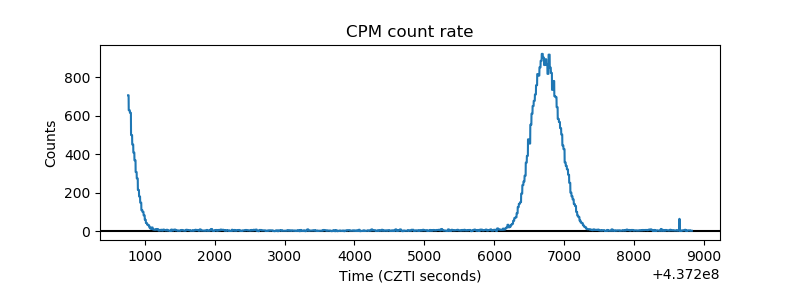 |
| CZT Counter | 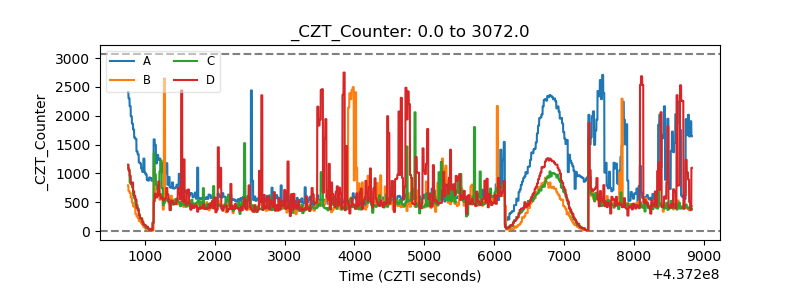 |
| +2.5 Volts monitor |  |
| +5 Volts monitor |  |
| _ROLL_ROT | 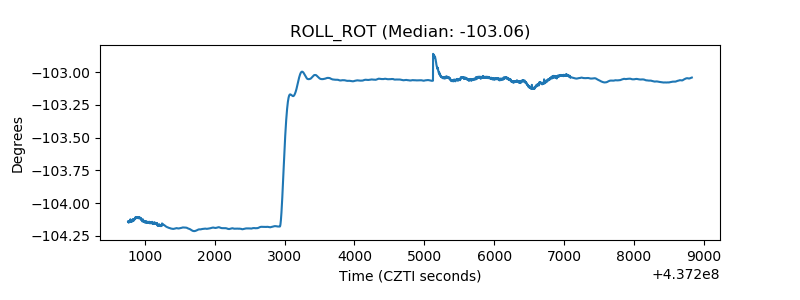 |
| _Roll_DEC | 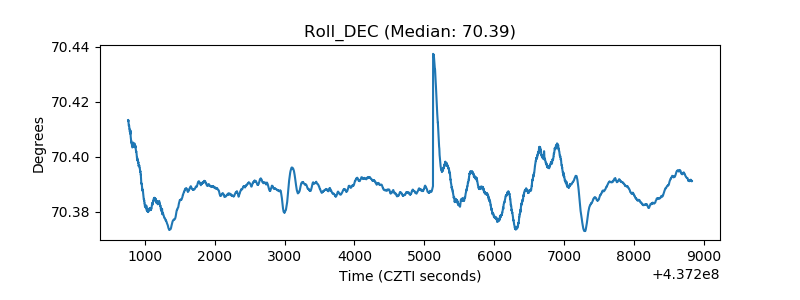 |
| _Roll_RA | 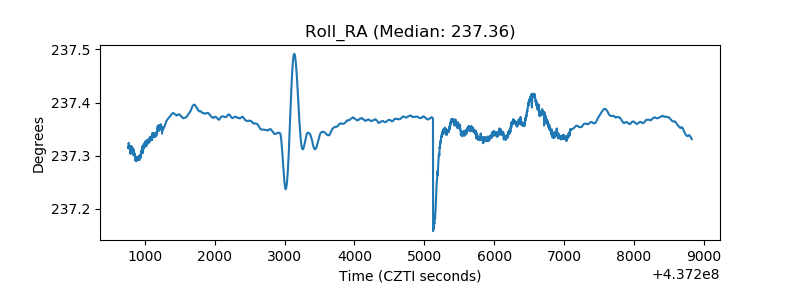 |
| Veto Counter | 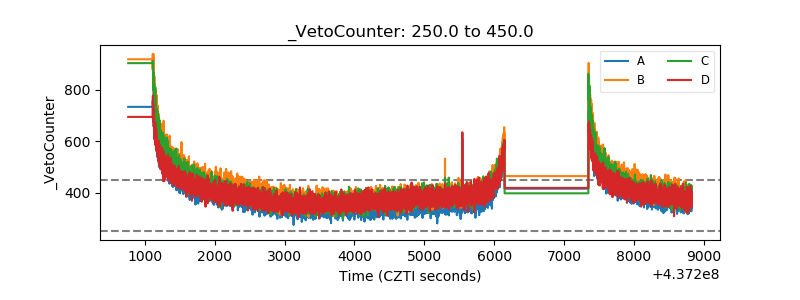 |