| Param | Original file | Final file |
|---|---|---|
| Filename | modeM0/AS1A13_073T04_9000005912_43889cztM0_level2.fits | modeM0/AS1A13_073T04_9000005912_43889cztM0_level2_quad_clean.evt |
| Size (bytes) | 251,357,760 | 48,752,640 |
| Size | 239.7 MB | 46.5 MB |
| Events in quadrant A | 2,442,827 | 333,559 |
| Events in quadrant B | 2,126,068 | 329,922 |
| Events in quadrant C | 1,467,526 | 332,579 |
| Events in quadrant D | 3,027,546 | 261,068 |
| Mode M0 | |||
|---|---|---|---|
| Quadrant | BADHDUFLAG | Total packets | Discarded packets |
| A | 0 | 9706 | 1 |
| B | 0 | 8404 | 1 |
| C | 0 | 6446 | 1 |
| D | 0 | 11142 | 1 |
| Mode M9 | |||
|---|---|---|---|
| Quadrant | BADHDUFLAG | Total packets | Discarded packets |
| A | 0 | 9 | 0 |
| B | 0 | 9 | 0 |
| C | 0 | 9 | 0 |
| D | 0 | 9 | 0 |
| Mode SS | |||
|---|---|---|---|
| Quadrant | BADHDUFLAG | Total packets | Discarded packets |
| A | 0 | 64 | 0 |
| B | 0 | 64 | 0 |
| C | 0 | 64 | 0 |
| D | 0 | 64 | 0 |
| Quadrant | Total seconds | Saturated seconds | Saturation percentage |
|---|---|---|---|
| A | 3074 | 91 | 2.960312% |
| B | 3074 | 198 | 6.441119% |
| C | 3074 | 12 | 0.390371% |
| D | 3074 | 489 | 15.907612% |
Noise dominated data is calculated using 1-second bins in cleaned event files. If a bin has >2000 counts, and if more than 50% of those come from <1% of pixels, then it is considered to be noise-dominated and hence unusable.
| Quadrant | # 1 sec bins | Bins with >0 counts | Bins with >2000 counts | High rate bins dominated by noise | Noise dominated (total time) | Noise dominated (detector-on time) | Marked lightcurve |
|---|---|---|---|---|---|---|---|
| A | 3974 | 3075 | 55 | 55 | 1.38% | 1.79% | 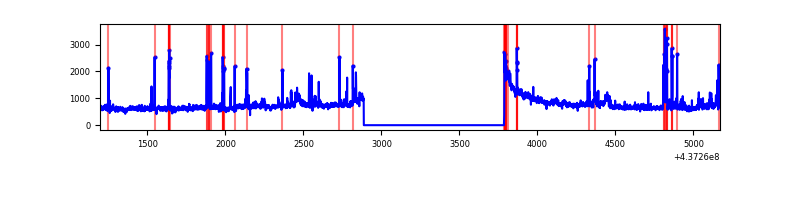 |
| B | 3974 | 3075 | 94 | 94 | 2.37% | 3.06% | 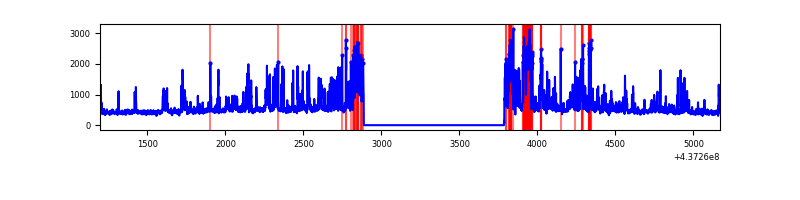 |
| C | 3974 | 3075 | 6 | 6 | 0.15% | 0.20% | 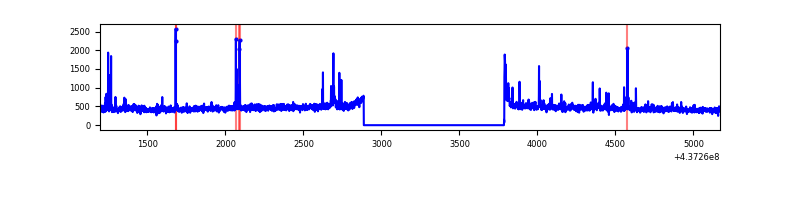 |
| D | 3974 | 3075 | 357 | 357 | 8.98% | 11.61% | 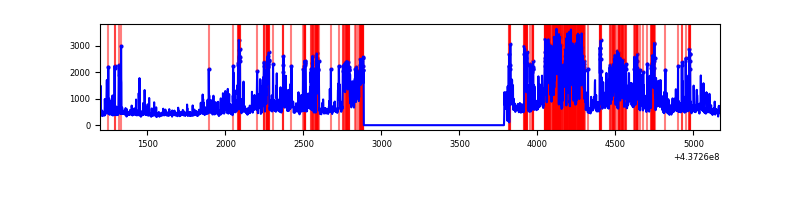 |
Top three noisy pixels from each quadrant. If the there are fewer than three noisy pixels in the level2.evt file, extra rows are filled as -1
| Pixel properties | Quadrant properties | ||||||
|---|---|---|---|---|---|---|---|
| Quadrant | DetID | PixID | Counts | Sigma | Mean | Median | Sigma |
| A | 10 | 83 | 562107 | 7548.78 | 352 | 345 | 74.4 |
| A | 15 | 222 | 314338 | 4219.34 | 352 | 345 | 74.4 |
| A | 15 | 223 | 123559 | 1655.71 | 352 | 345 | 74.4 |
| B | 7 | 205 | 274132 | 3975.51 | 343 | 333 | 68.9 |
| B | 5 | 172 | 153582 | 2225.15 | 343 | 333 | 68.9 |
| B | 4 | 171 | 130495 | 1889.93 | 343 | 333 | 68.9 |
| C | 3 | 233 | 41266 | 496.46 | 345 | 346 | 82.4 |
| C | 14 | 254 | 30185 | 362.02 | 345 | 346 | 82.4 |
| C | 15 | 158 | 20679 | 246.69 | 345 | 346 | 82.4 |
| D | 7 | 80 | 417267 | 5193.69 | 315 | 305 | 80.3 |
| D | 2 | 249 | 337077 | 4194.84 | 315 | 305 | 80.3 |
| D | 5 | 235 | 267783 | 3331.72 | 315 | 305 | 80.3 |
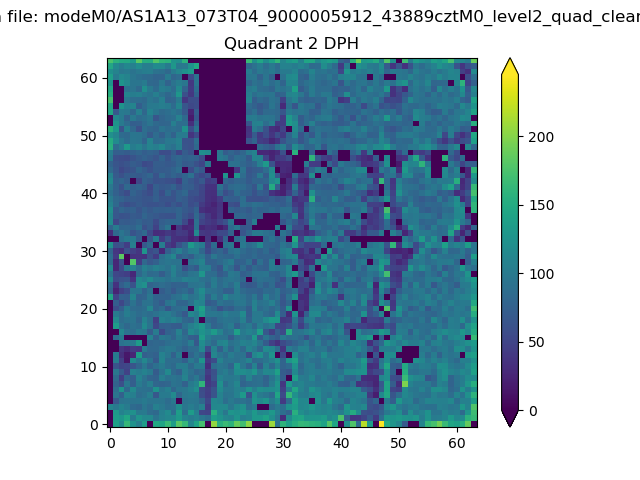
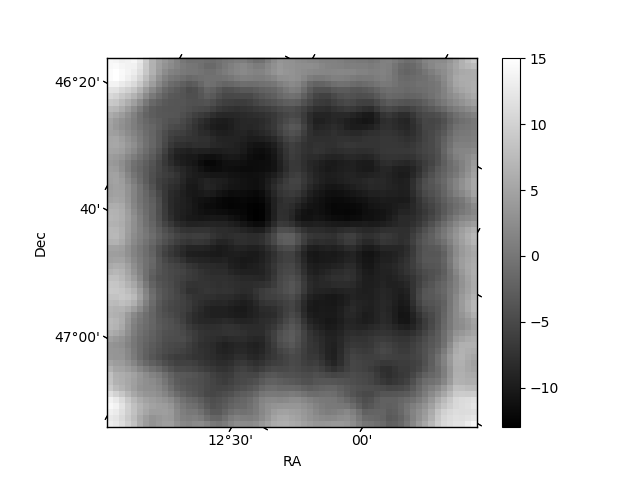
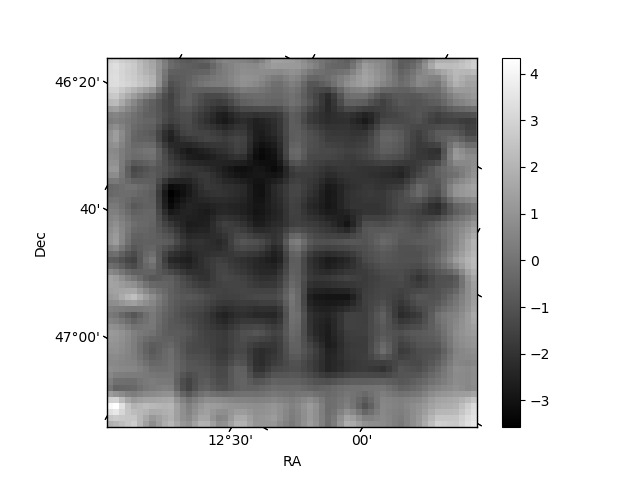
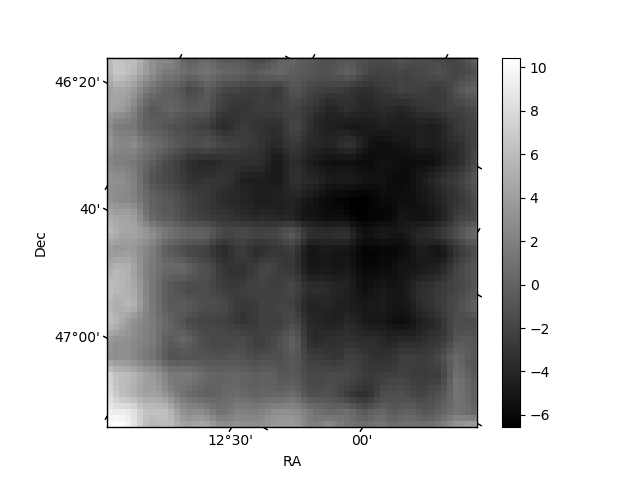
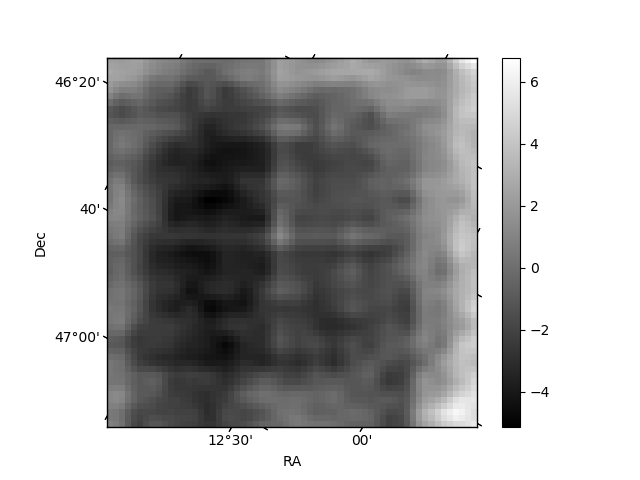
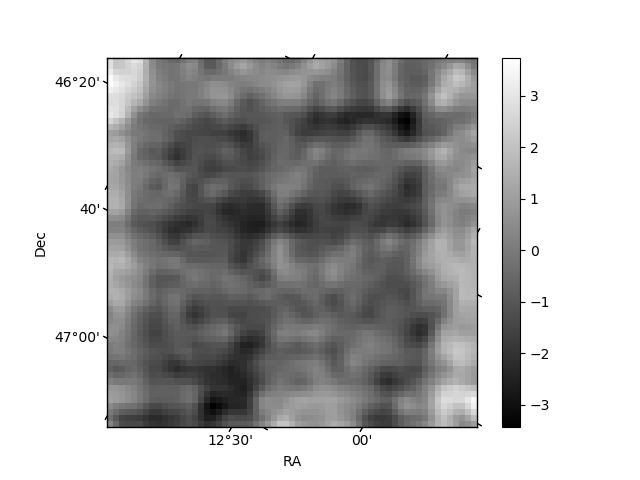
Histogram calculated using DETX and DETY for each event in the final _common_clean file
| Quadrant A | 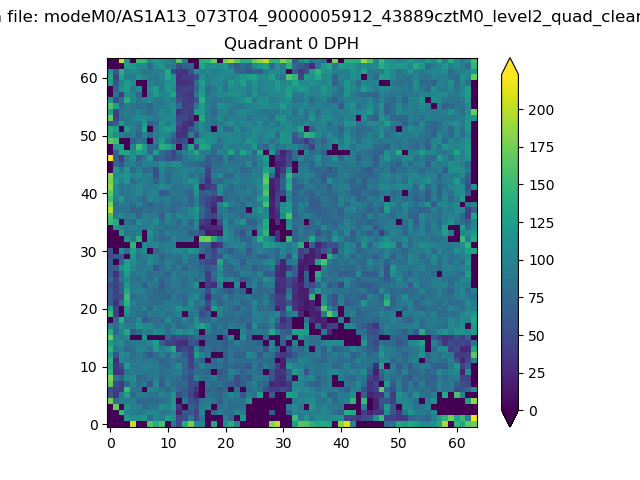 |
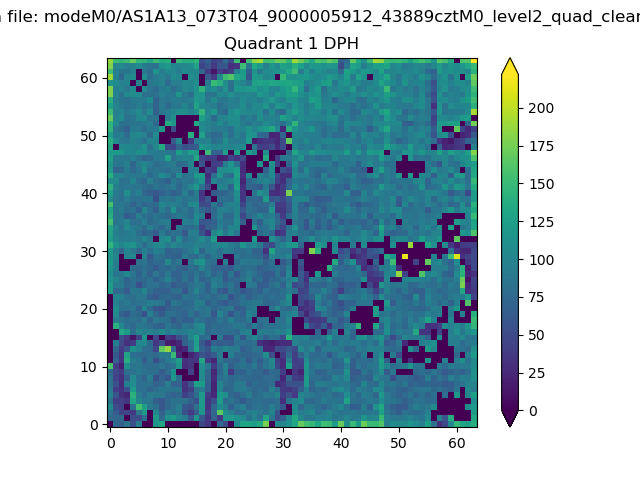 |
Quadrant B |
|---|---|---|---|
| Quadrant D | 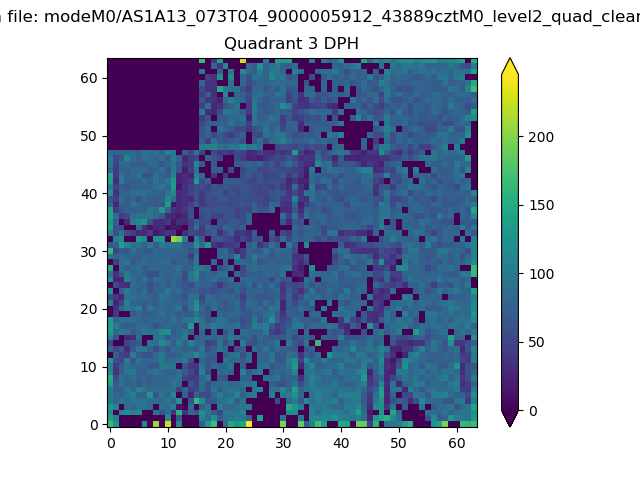 |
 |
Quadrant C |
| Plot type | Count rate plots | Images |
|---|---|---|
| Comparison with Poisson distribution Blue bars denote a histogram of data divided into 1 sec bins. Red curve is a Poisson curve with rate = median count rate of data. |
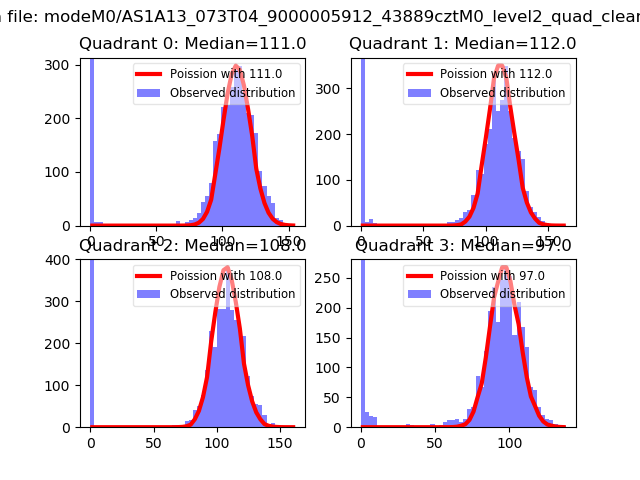 |
 |
| Quadrant-wise count rates Data is divided into 100 sec bins |
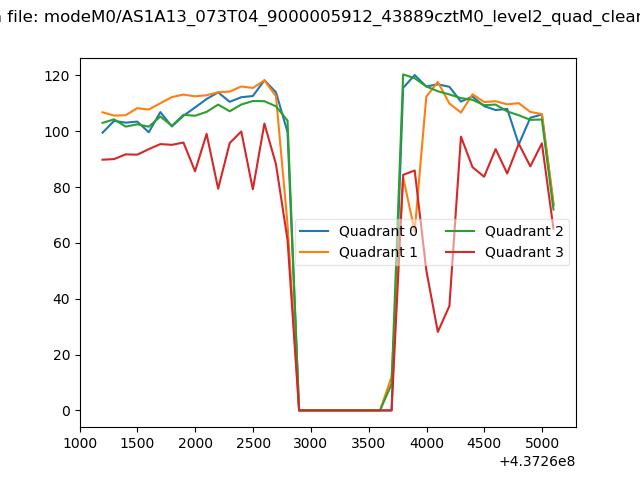 |
|
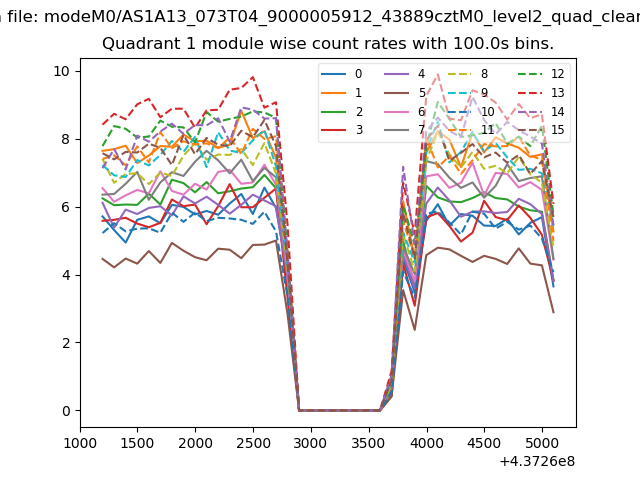
| Module-wise count rates for Quadrant A Data is divided into 100 sec bins |
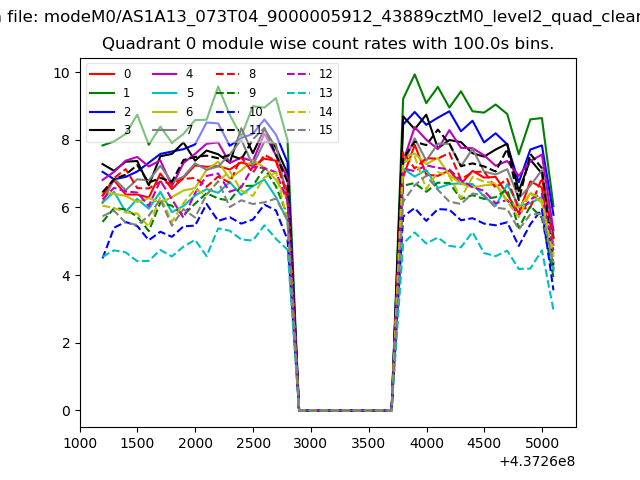 |
 |
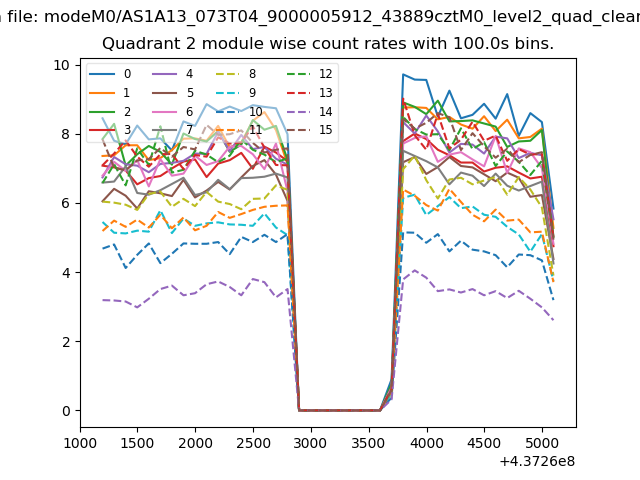
| Module-wise count rates for Quadrant B Data is divided into 100 sec bins |
 |
 |
| Module-wise count rates for Quadrant C Data is divided into 100 sec bins |
 |
 |
| Module-wise count rates for Quadrant D Data is divided into 100 sec bins |
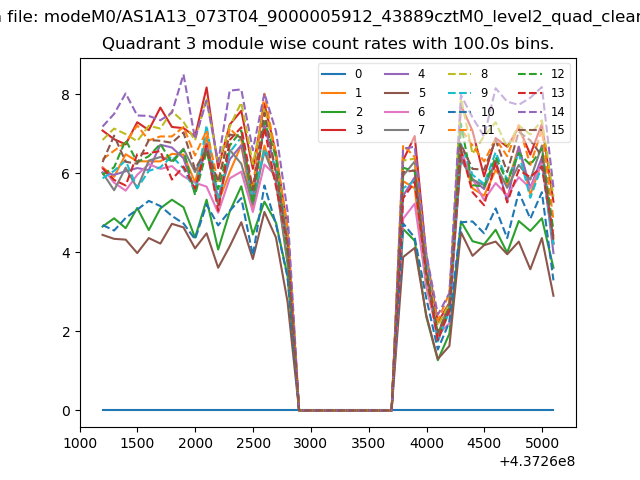 |
 |
| Parameter | Plot |
|---|---|
| CZT HV Monitor | 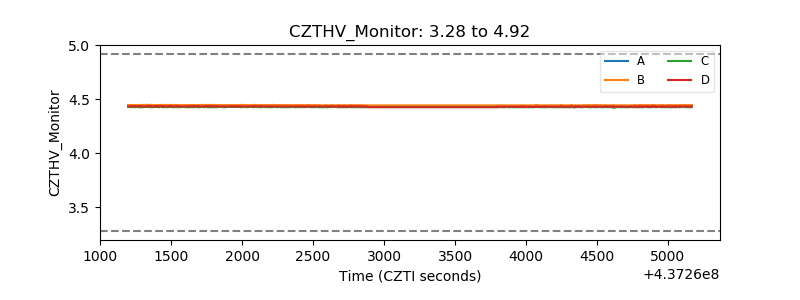 |
| D_VDD | 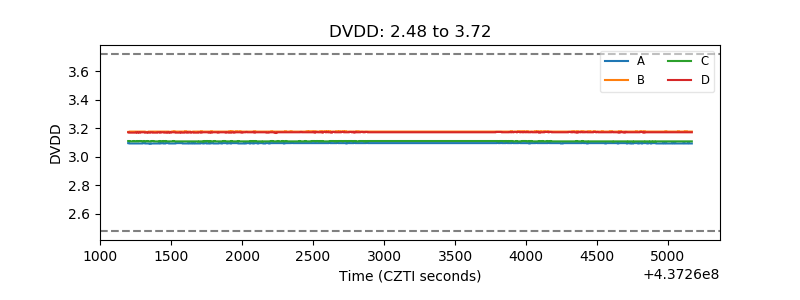 |
| Temperature 1 | 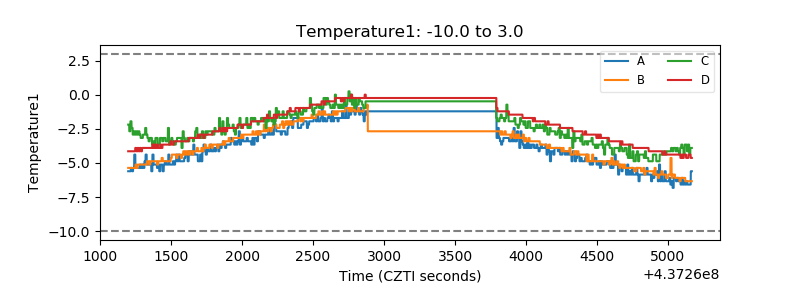 |
| Veto HV Monitor | 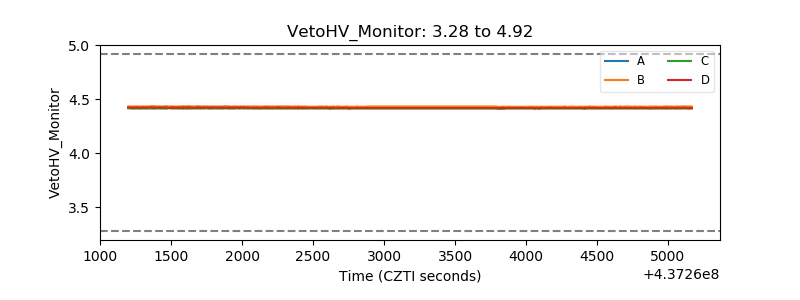 |
| Veto LLD | 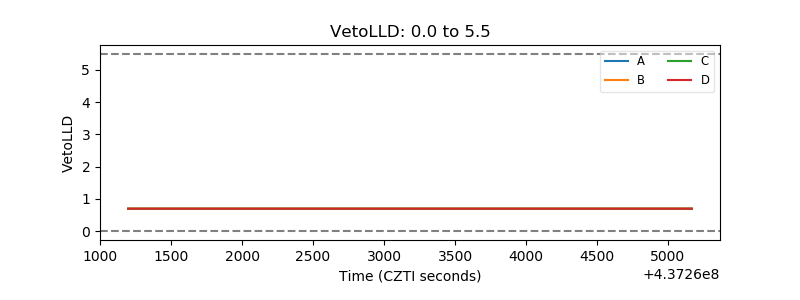 |
| Alpha Counter | 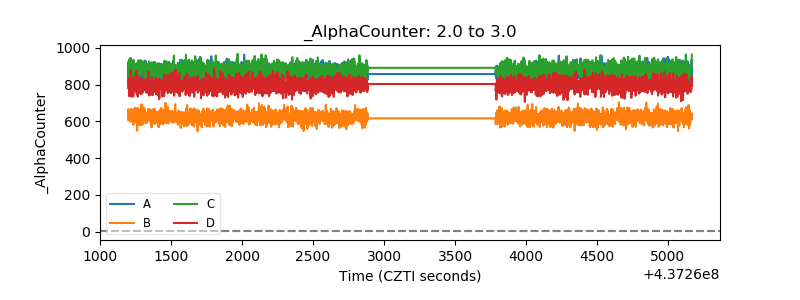 |
| _CPM_Rate | 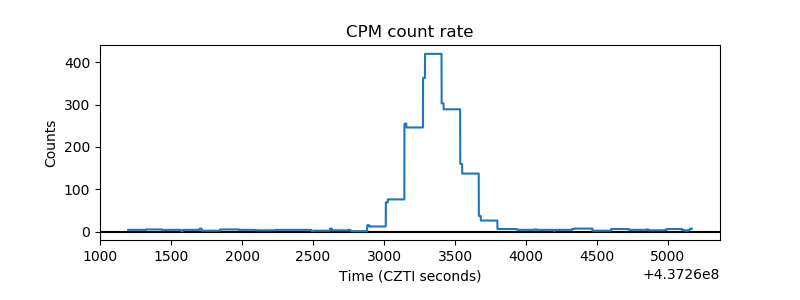 |
| CZT Counter | 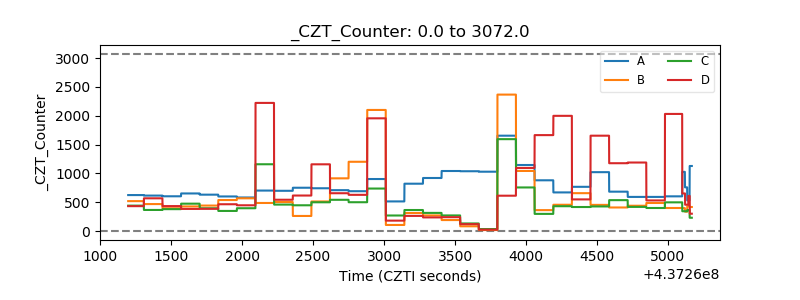 |
| +2.5 Volts monitor | 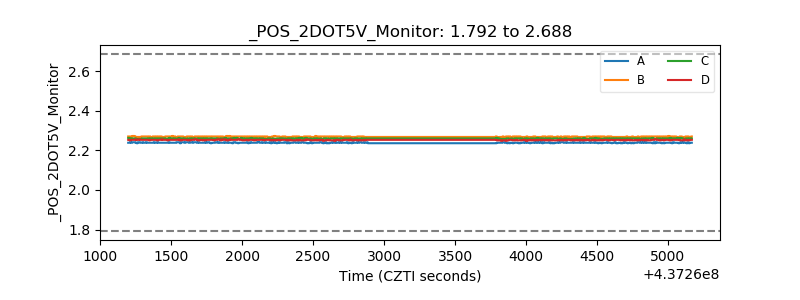 |
| +5 Volts monitor | 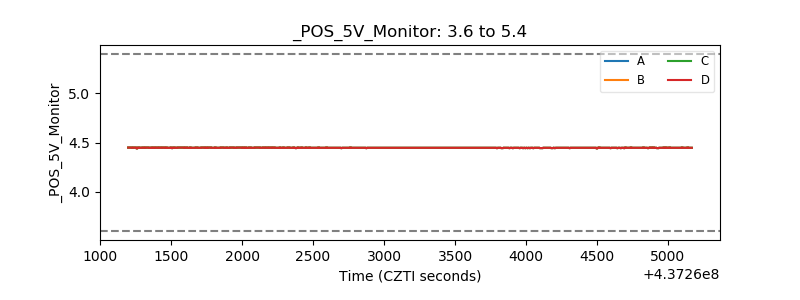 |
| _ROLL_ROT | 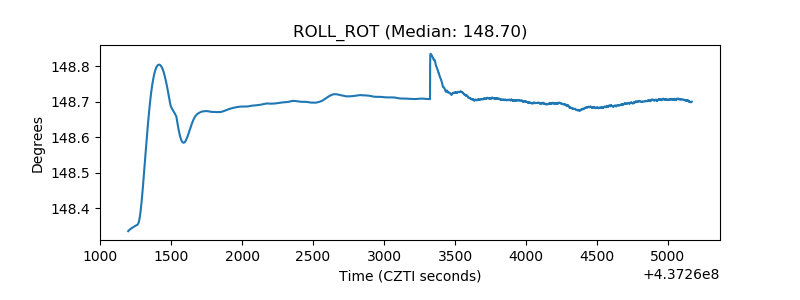 |
| _Roll_DEC | 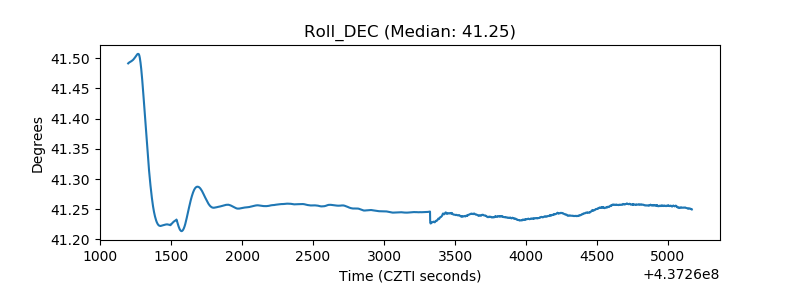 |
| _Roll_RA | 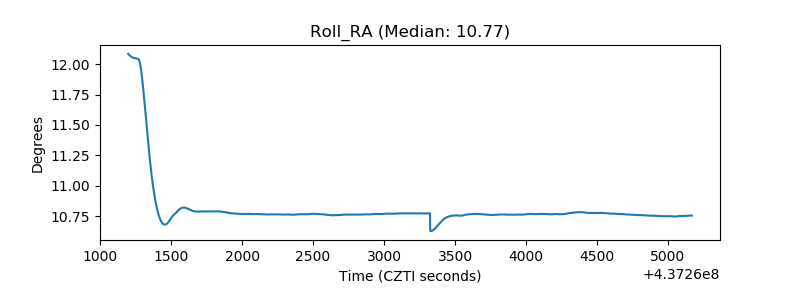 |
| Veto Counter | 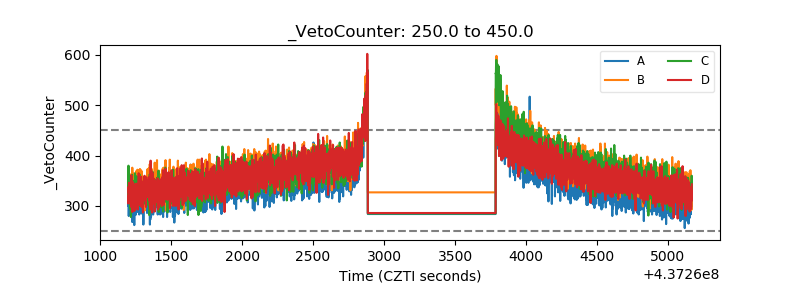 |