| Param | Original file | Final file |
|---|---|---|
| Filename | modeM0/AS1A13_073T04_9000005912_43890cztM0_level2.fits | modeM0/AS1A13_073T04_9000005912_43890cztM0_level2_quad_clean.evt |
| Size (bytes) | 509,878,080 | 102,968,640 |
| Size | 486.3 MB | 98.2 MB |
| Events in quadrant A | 6,303,956 | 647,868 |
| Events in quadrant B | 3,430,628 | 716,093 |
| Events in quadrant C | 3,035,176 | 704,837 |
| Events in quadrant D | 5,593,230 | 589,543 |
| Mode M0 | |||
|---|---|---|---|
| Quadrant | BADHDUFLAG | Total packets | Discarded packets |
| A | 0 | 23647 | 2 |
| B | 0 | 14878 | 2 |
| C | 0 | 13802 | 2 |
| D | 0 | 21306 | 2 |
| Mode M9 | |||
|---|---|---|---|
| Quadrant | BADHDUFLAG | Total packets | Discarded packets |
| A | 0 | 10 | 0 |
| B | 0 | 10 | 0 |
| C | 0 | 10 | 0 |
| D | 0 | 10 | 0 |
| Mode SS | |||
|---|---|---|---|
| Quadrant | BADHDUFLAG | Total packets | Discarded packets |
| A | 0 | 134 | 0 |
| B | 0 | 134 | 0 |
| C | 0 | 134 | 0 |
| D | 0 | 134 | 0 |
| Quadrant | Total seconds | Saturated seconds | Saturation percentage |
|---|---|---|---|
| A | 6581 | 686 | 10.423948% |
| B | 6581 | 137 | 2.081750% |
| C | 6581 | 36 | 0.547029% |
| D | 6582 | 645 | 9.799453% |
Noise dominated data is calculated using 1-second bins in cleaned event files. If a bin has >2000 counts, and if more than 50% of those come from <1% of pixels, then it is considered to be noise-dominated and hence unusable.
| Quadrant | # 1 sec bins | Bins with >0 counts | Bins with >2000 counts | High rate bins dominated by noise | Noise dominated (total time) | Noise dominated (detector-on time) | Marked lightcurve |
|---|---|---|---|---|---|---|---|
| A | 7571 | 6582 | 527 | 527 | 6.96% | 8.01% | 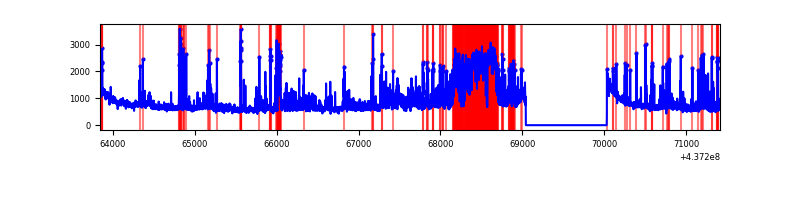 |
| B | 7571 | 6582 | 71 | 71 | 0.94% | 1.08% | 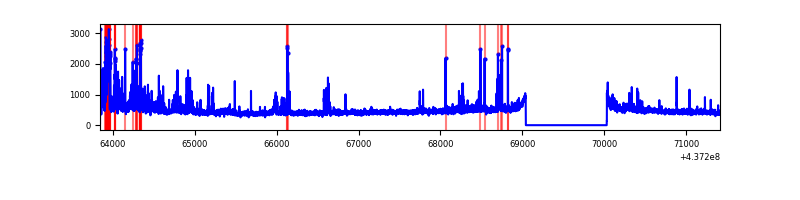 |
| C | 7571 | 6582 | 22 | 22 | 0.29% | 0.33% | 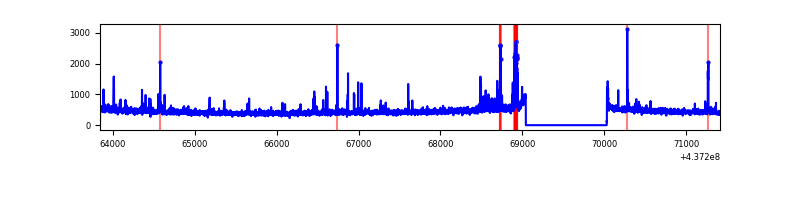 |
| D | 7572 | 6583 | 519 | 519 | 6.85% | 7.88% | 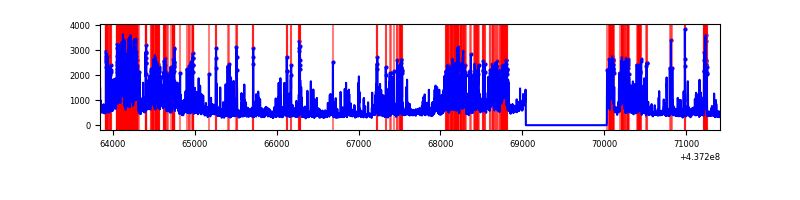 |
Top three noisy pixels from each quadrant. If the there are fewer than three noisy pixels in the level2.evt file, extra rows are filled as -1
| Pixel properties | Quadrant properties | ||||||
|---|---|---|---|---|---|---|---|
| Quadrant | DetID | PixID | Counts | Sigma | Mean | Median | Sigma |
| A | 15 | 223 | 1694610 | 11921.76 | 687 | 673 | 142.1 |
| A | 10 | 83 | 1089481 | 7662.92 | 687 | 673 | 142.1 |
| A | 15 | 222 | 577565 | 4060.11 | 687 | 673 | 142.1 |
| B | 5 | 172 | 151311 | 1071.77 | 712 | 690 | 140.5 |
| B | 4 | 171 | 150053 | 1062.82 | 712 | 690 | 140.5 |
| B | 7 | 205 | 65534 | 461.41 | 712 | 690 | 140.5 |
| C | 14 | 254 | 115520 | 687.84 | 708 | 713 | 166.9 |
| C | 3 | 233 | 77315 | 458.95 | 708 | 713 | 166.9 |
| C | 15 | 174 | 39830 | 234.36 | 708 | 713 | 166.9 |
| D | 2 | 153 | 561458 | 3286.21 | 669 | 648 | 170.7 |
| D | 5 | 235 | 544341 | 3185.91 | 669 | 648 | 170.7 |
| D | 7 | 80 | 405529 | 2372.5 | 669 | 648 | 170.7 |
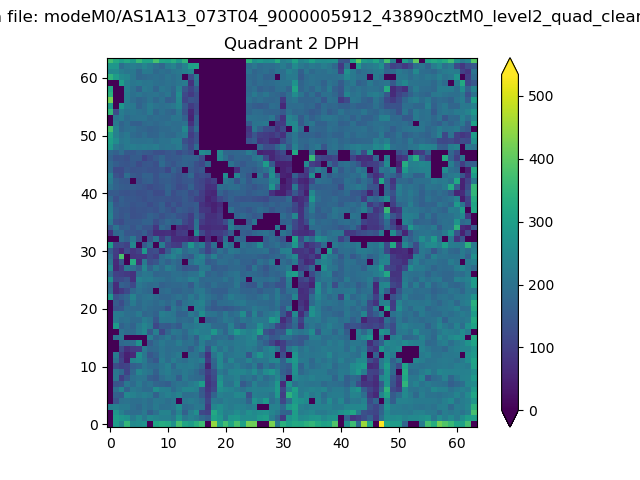
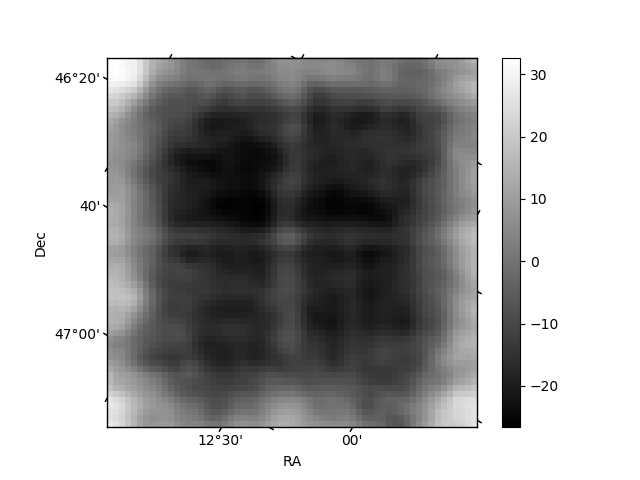
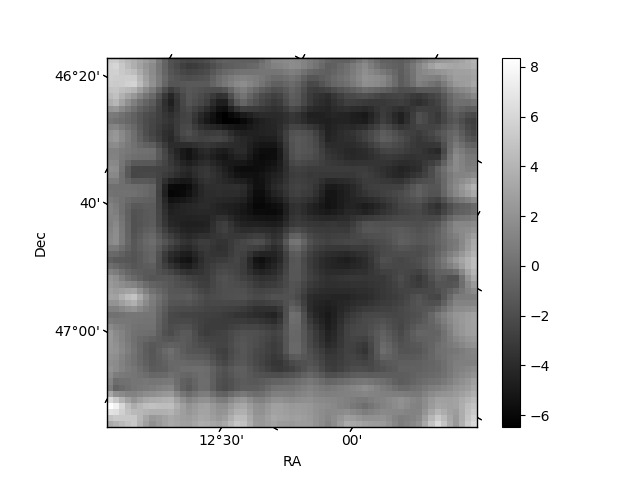
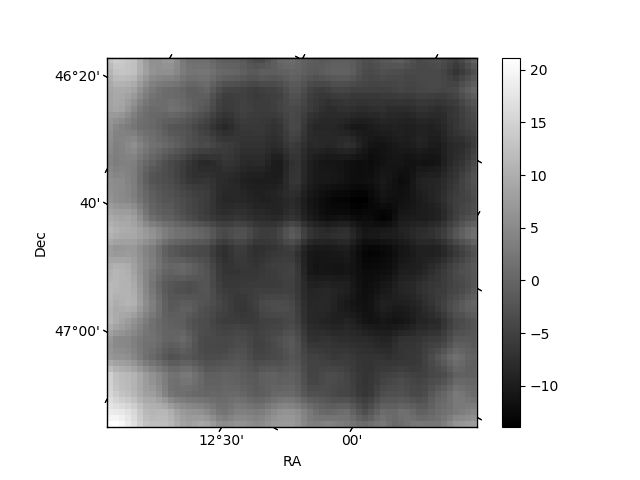
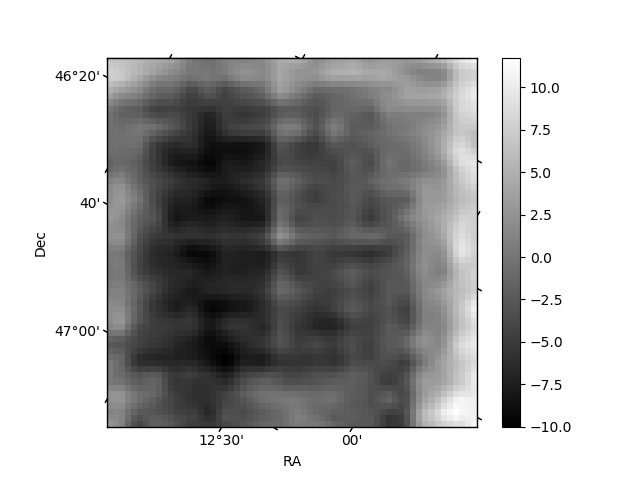
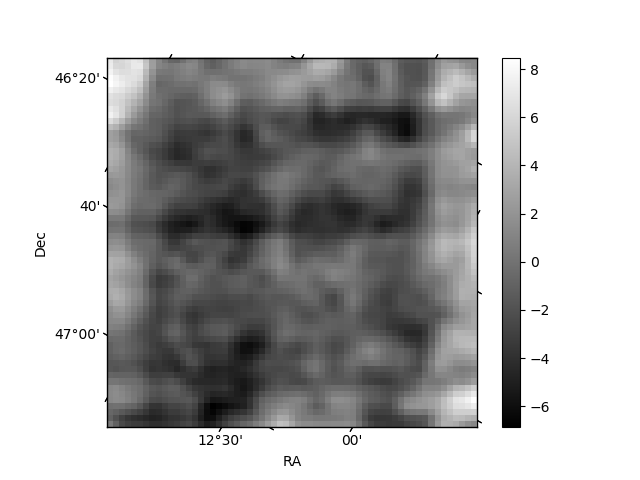
Histogram calculated using DETX and DETY for each event in the final _common_clean file
| Quadrant A | 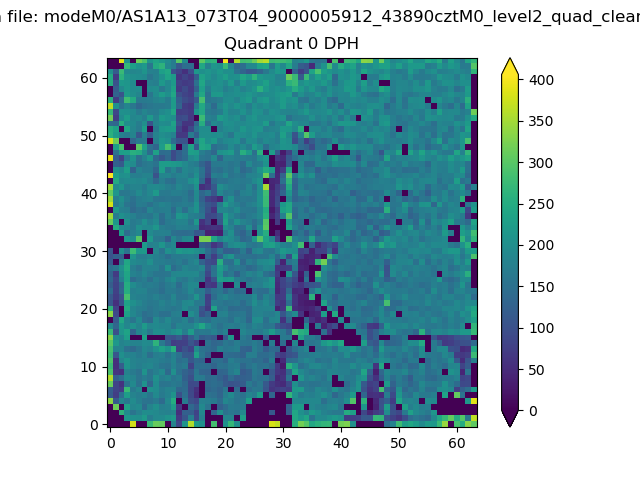 |
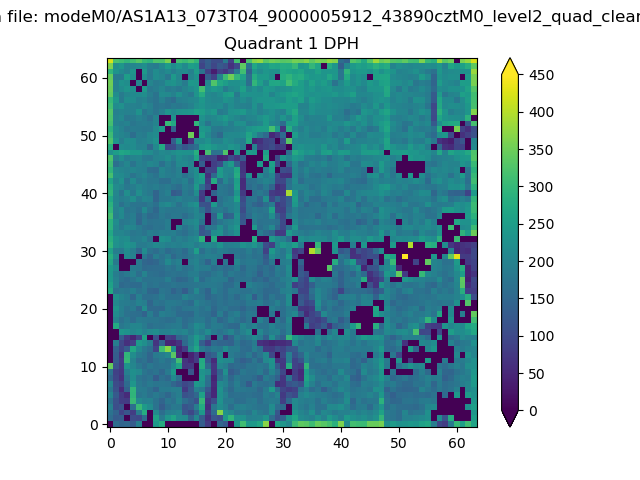 |
Quadrant B |
|---|---|---|---|
| Quadrant D | 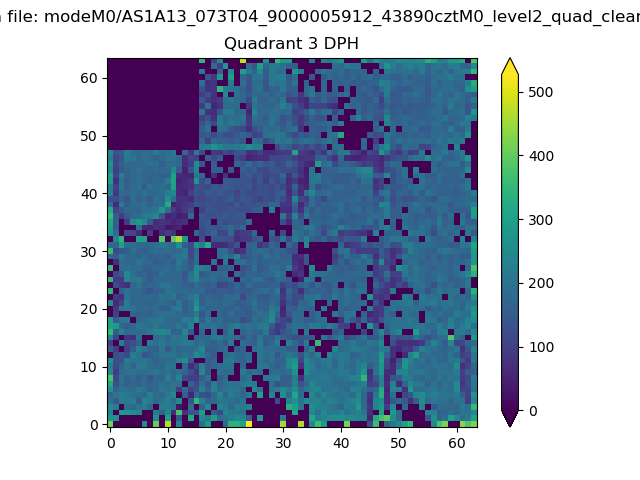 |
 |
Quadrant C |
| Plot type | Count rate plots | Images |
|---|---|---|
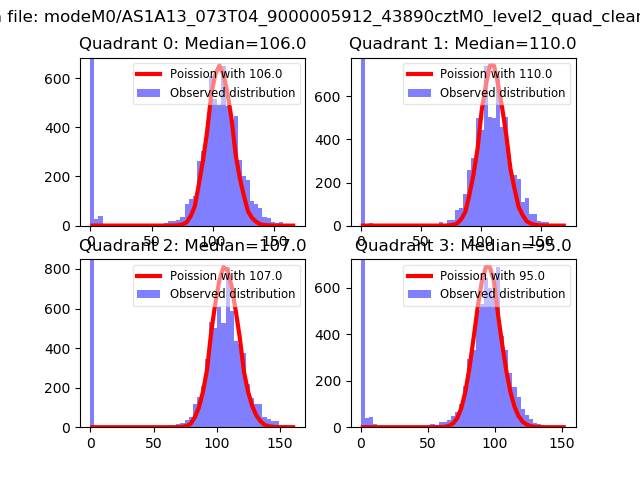
| Comparison with Poisson distribution Blue bars denote a histogram of data divided into 1 sec bins. Red curve is a Poisson curve with rate = median count rate of data. |
 |
 |
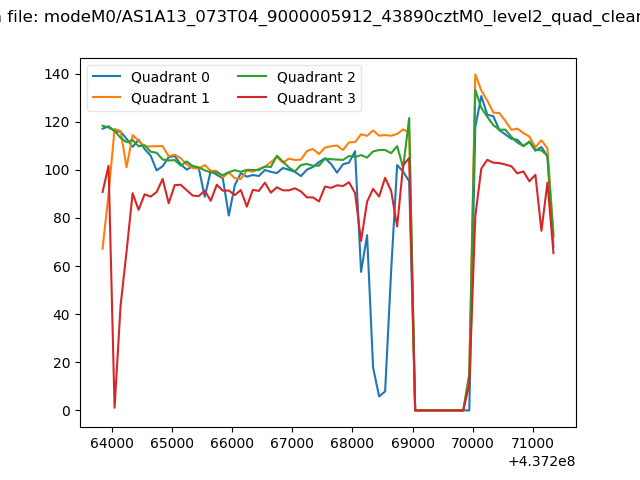
| Quadrant-wise count rates Data is divided into 100 sec bins |
 |
|
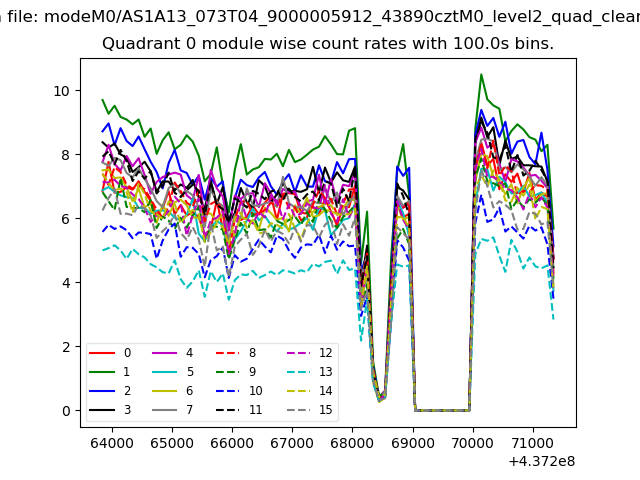
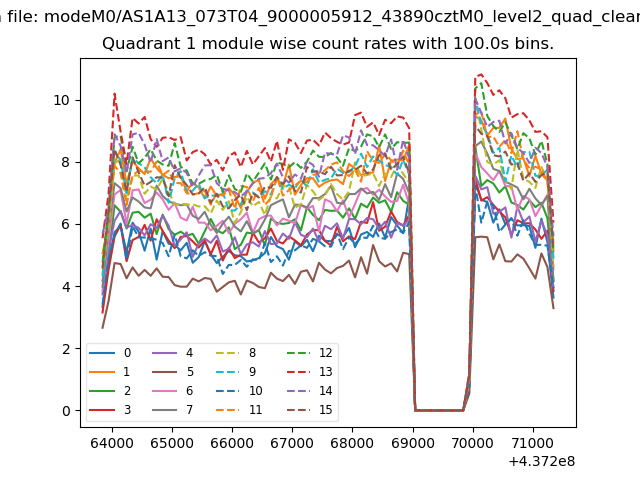
| Module-wise count rates for Quadrant A Data is divided into 100 sec bins |
 |
 |
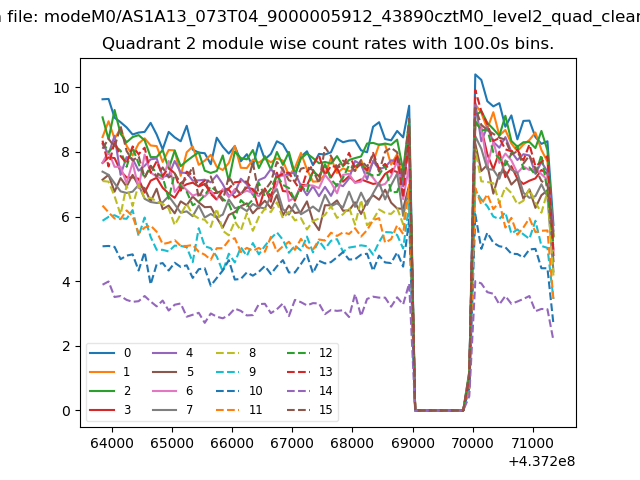
| Module-wise count rates for Quadrant B Data is divided into 100 sec bins |
 |
 |
| Module-wise count rates for Quadrant C Data is divided into 100 sec bins |
 |
 |
| Module-wise count rates for Quadrant D Data is divided into 100 sec bins |
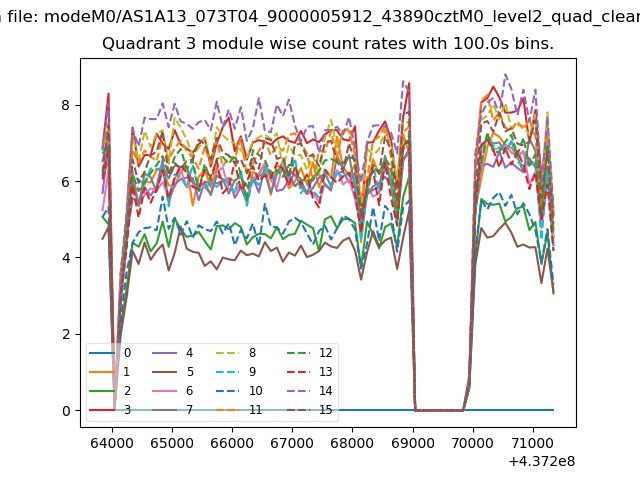 |
 |
| Parameter | Plot |
|---|---|
| CZT HV Monitor | 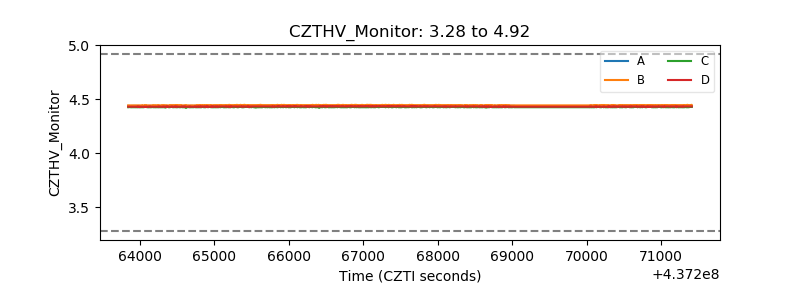 |
| D_VDD | 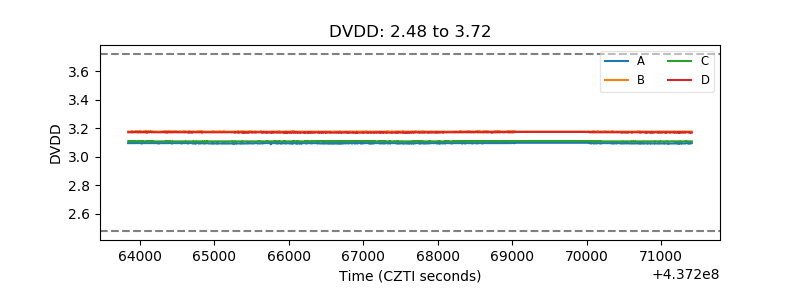 |
| Temperature 1 | 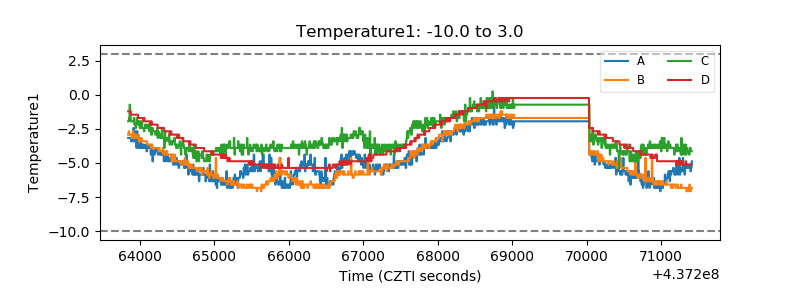 |
| Veto HV Monitor | 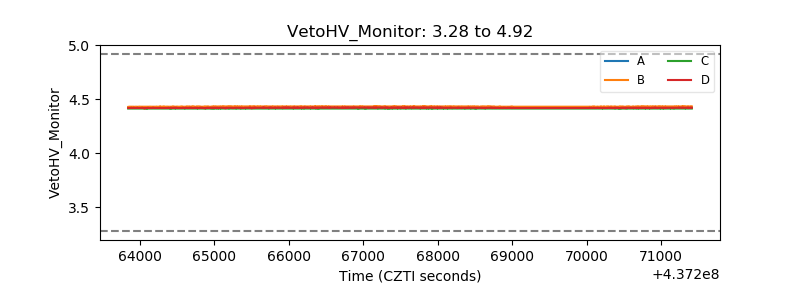 |
| Veto LLD | 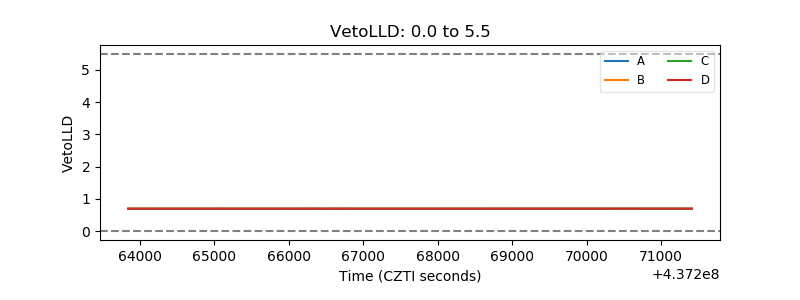 |
| Alpha Counter | 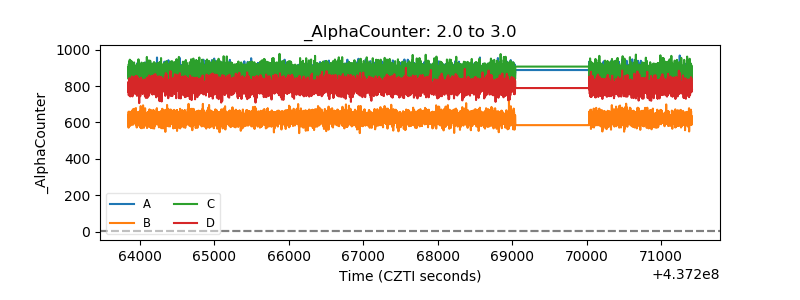 |
| _CPM_Rate | 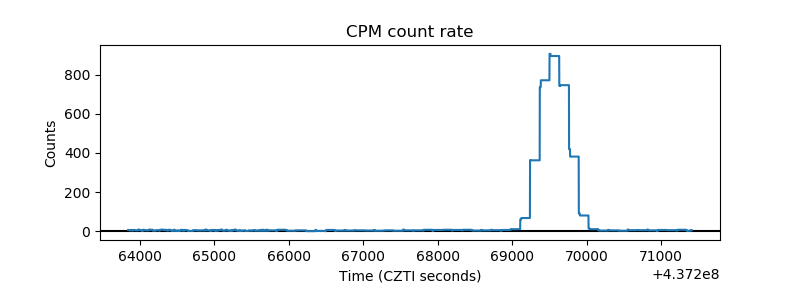 |
| CZT Counter | 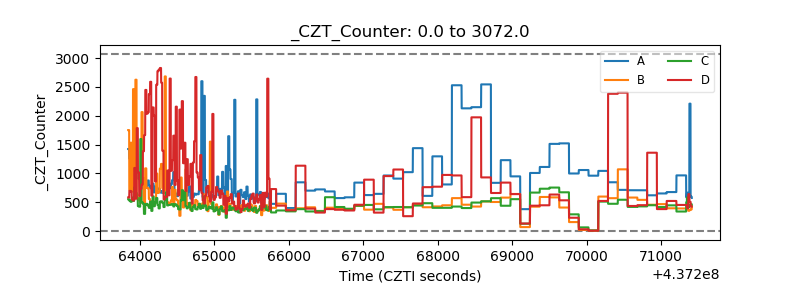 |
| +2.5 Volts monitor | 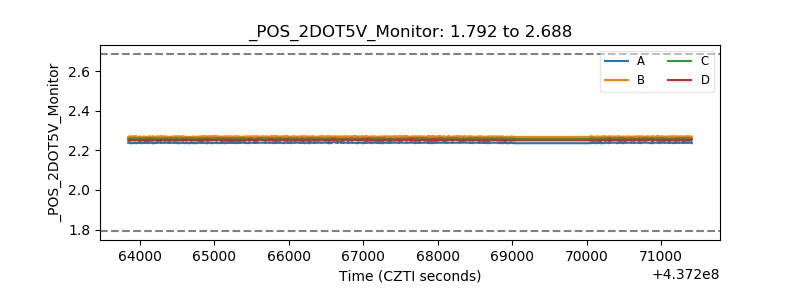 |
| +5 Volts monitor | 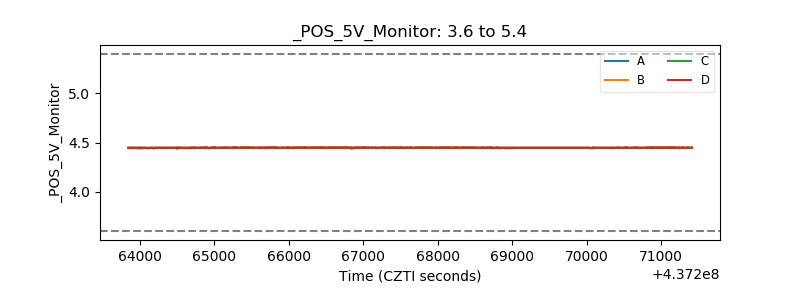 |
| _ROLL_ROT | 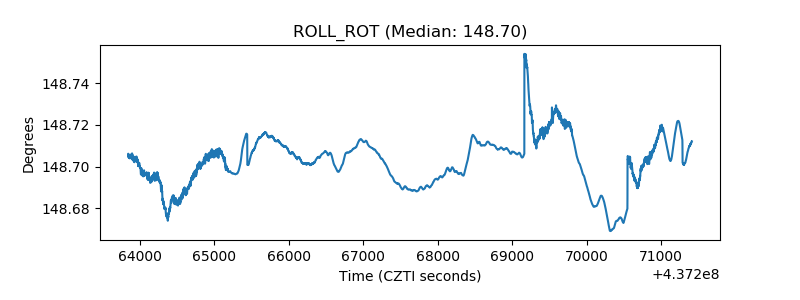 |
| _Roll_DEC | 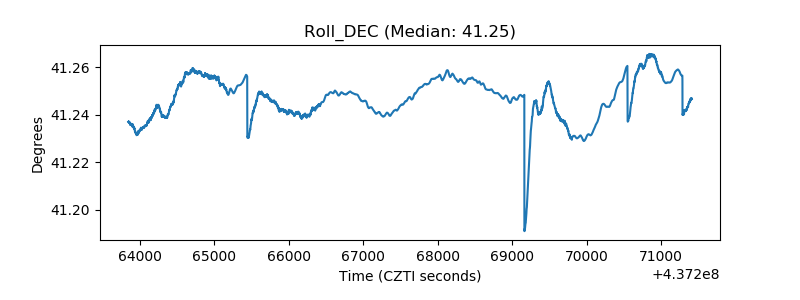 |
| _Roll_RA | 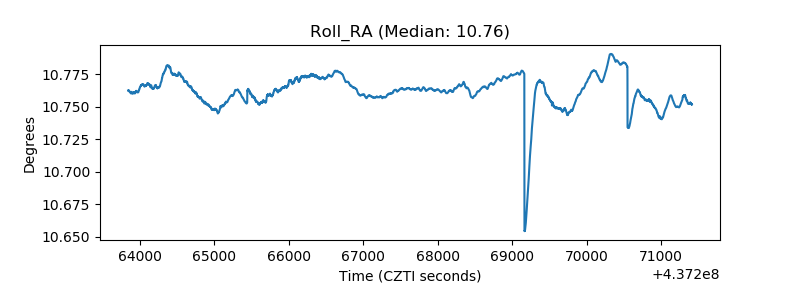 |
| Veto Counter | 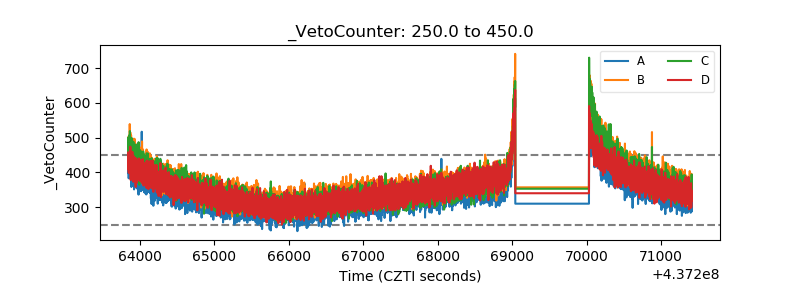 |