| Param | Original file | Final file |
|---|---|---|
| Filename | modeM0/AS1A13_073T04_9000005912_43893cztM0_level2.fits | modeM0/AS1A13_073T04_9000005912_43893cztM0_level2_quad_clean.evt |
| Size (bytes) | 517,265,280 | 92,096,640 |
| Size | 493.3 MB | 87.8 MB |
| Events in quadrant A | 8,289,206 | 482,442 |
| Events in quadrant B | 3,093,499 | 674,940 |
| Events in quadrant C | 2,789,586 | 658,734 |
| Events in quadrant D | 4,510,950 | 555,415 |
| Mode M0 | |||
|---|---|---|---|
| Quadrant | BADHDUFLAG | Total packets | Discarded packets |
| A | 0 | 29029 | 2 |
| B | 0 | 13327 | 2 |
| C | 0 | 12545 | 2 |
| D | 0 | 17753 | 2 |
| Mode M9 | |||
|---|---|---|---|
| Quadrant | BADHDUFLAG | Total packets | Discarded packets |
| A | 0 | 11 | 0 |
| B | 0 | 12 | 0 |
| C | 0 | 12 | 0 |
| D | 0 | 12 | 0 |
| Mode SS | |||
|---|---|---|---|
| Quadrant | BADHDUFLAG | Total packets | Discarded packets |
| A | 0 | 122 | 0 |
| B | 0 | 122 | 0 |
| C | 0 | 122 | 0 |
| D | 0 | 122 | 0 |
| Quadrant | Total seconds | Saturated seconds | Saturation percentage |
|---|---|---|---|
| A | 5968 | 1955 | 32.758043% |
| B | 5968 | 121 | 2.027480% |
| C | 5968 | 25 | 0.418901% |
| D | 5968 | 515 | 8.629357% |
Noise dominated data is calculated using 1-second bins in cleaned event files. If a bin has >2000 counts, and if more than 50% of those come from <1% of pixels, then it is considered to be noise-dominated and hence unusable.
| Quadrant | # 1 sec bins | Bins with >0 counts | Bins with >2000 counts | High rate bins dominated by noise | Noise dominated (total time) | Noise dominated (detector-on time) | Marked lightcurve |
|---|---|---|---|---|---|---|---|
| A | 7093 | 5969 | 1745 | 1745 | 24.60% | 29.23% | 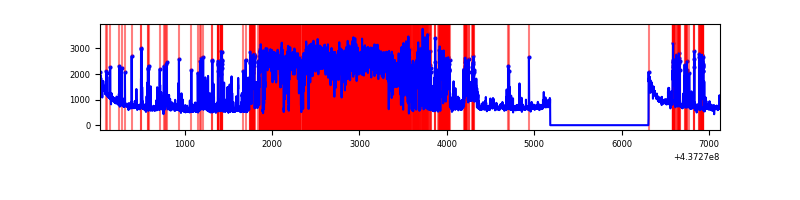 |
| B | 7093 | 5969 | 63 | 63 | 0.89% | 1.06% | 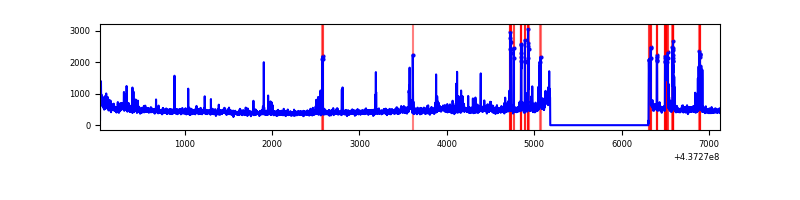 |
| C | 7093 | 5969 | 12 | 12 | 0.17% | 0.20% | 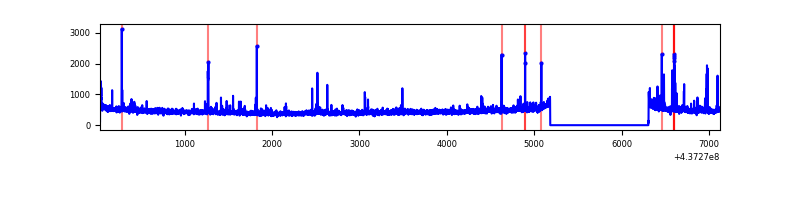 |
| D | 7093 | 5969 | 458 | 458 | 6.46% | 7.67% | 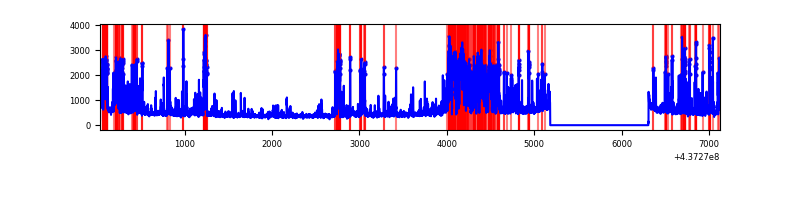 |
Top three noisy pixels from each quadrant. If the there are fewer than three noisy pixels in the level2.evt file, extra rows are filled as -1
| Pixel properties | Quadrant properties | ||||||
|---|---|---|---|---|---|---|---|
| Quadrant | DetID | PixID | Counts | Sigma | Mean | Median | Sigma |
| A | 15 | 223 | 4500299 | 38871.16 | 561 | 549 | 115.8 |
| A | 10 | 83 | 936868 | 8088.41 | 561 | 549 | 115.8 |
| A | 15 | 222 | 419680 | 3620.67 | 561 | 549 | 115.8 |
| B | 7 | 205 | 158655 | 1210.53 | 664 | 644 | 130.5 |
| B | 4 | 158 | 63280 | 479.86 | 664 | 644 | 130.5 |
| B | 0 | 199 | 58955 | 446.72 | 664 | 644 | 130.5 |
| C | 14 | 254 | 91796 | 587.21 | 657 | 660 | 155.2 |
| C | 3 | 233 | 73348 | 468.34 | 657 | 660 | 155.2 |
| C | 11 | 16 | 21227 | 132.52 | 657 | 660 | 155.2 |
| D | 5 | 235 | 851834 | 5391.59 | 627 | 608 | 157.9 |
| D | 1 | 52 | 189872 | 1198.78 | 627 | 608 | 157.9 |
| D | 13 | 171 | 172717 | 1090.12 | 627 | 608 | 157.9 |
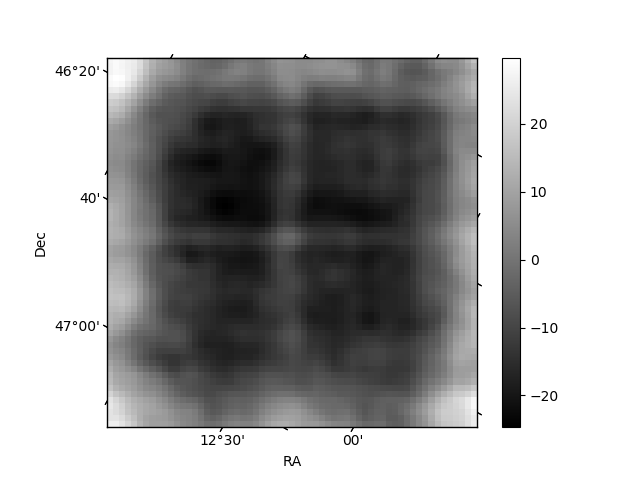
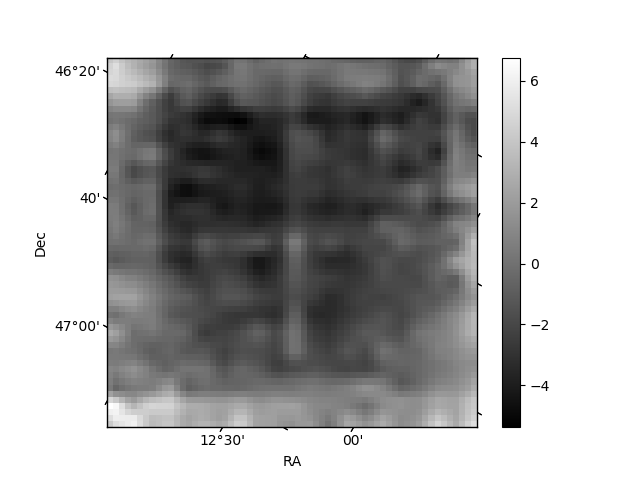
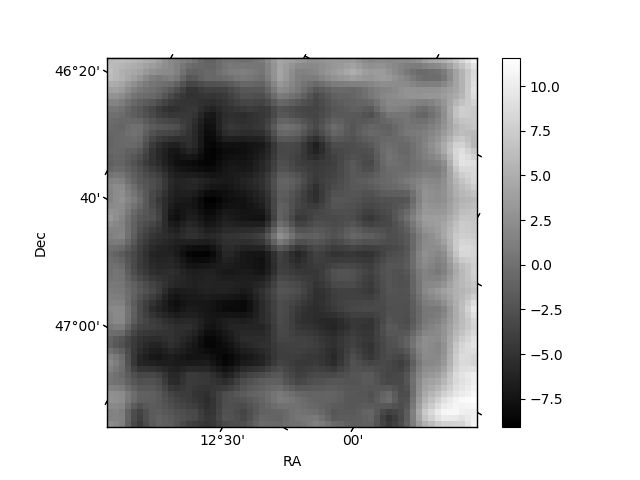
Histogram calculated using DETX and DETY for each event in the final _common_clean file
| Quadrant A | 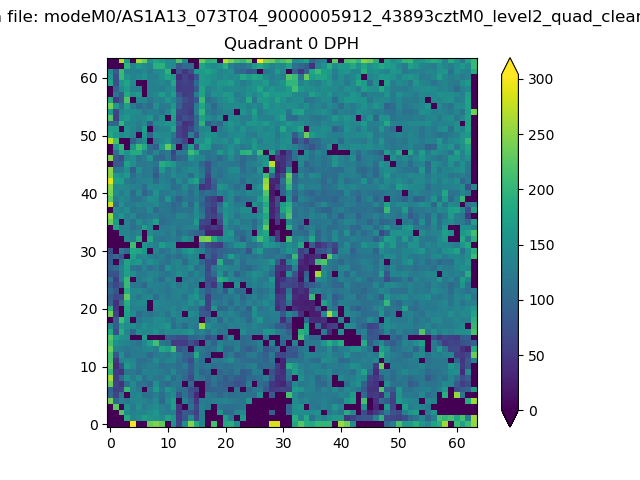 |
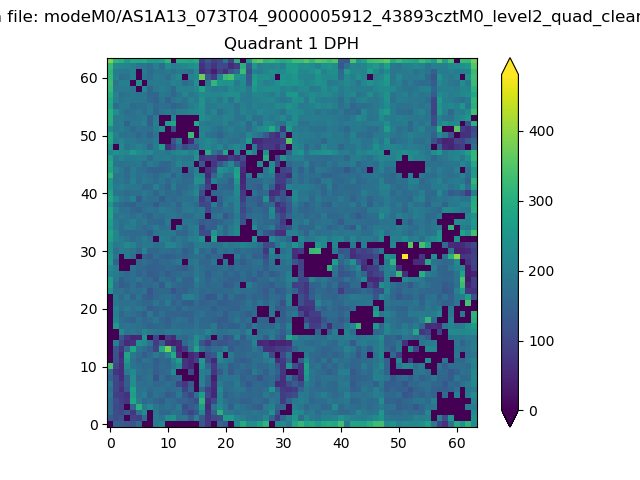 |
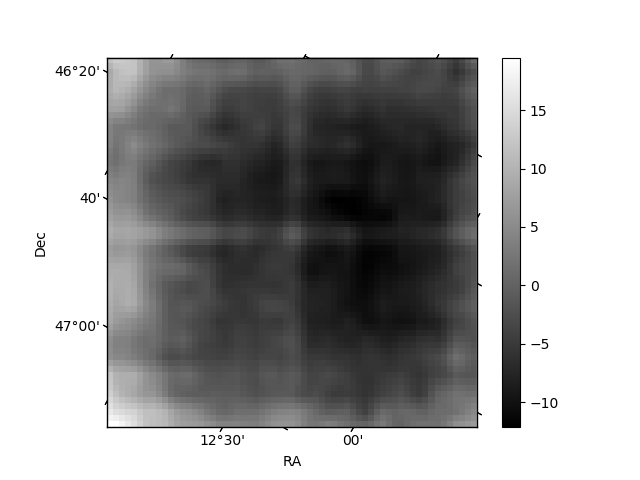
Quadrant B |
|---|---|---|---|
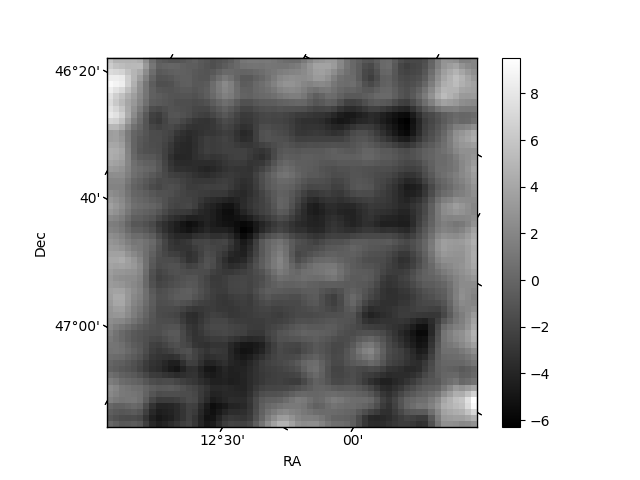
| Quadrant D | 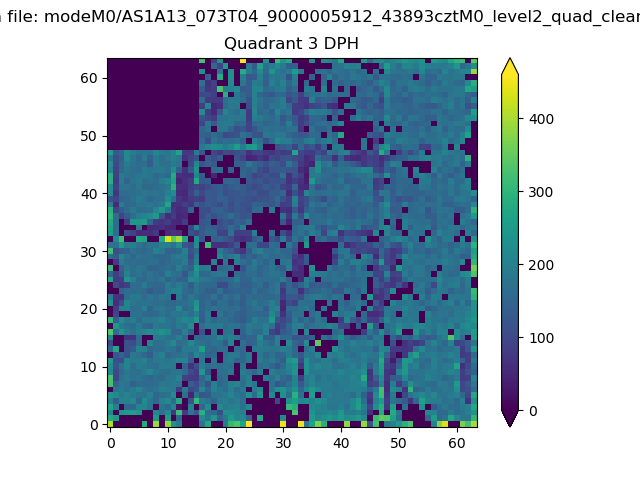 |
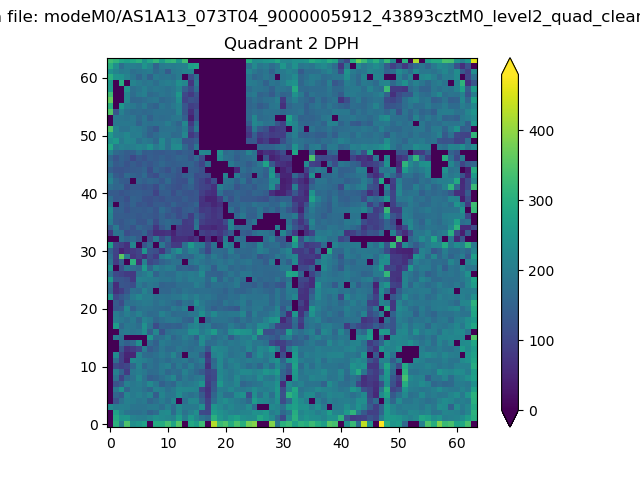 |
Quadrant C |
| Plot type | Count rate plots | Images |
|---|---|---|
| Comparison with Poisson distribution Blue bars denote a histogram of data divided into 1 sec bins. Red curve is a Poisson curve with rate = median count rate of data. |
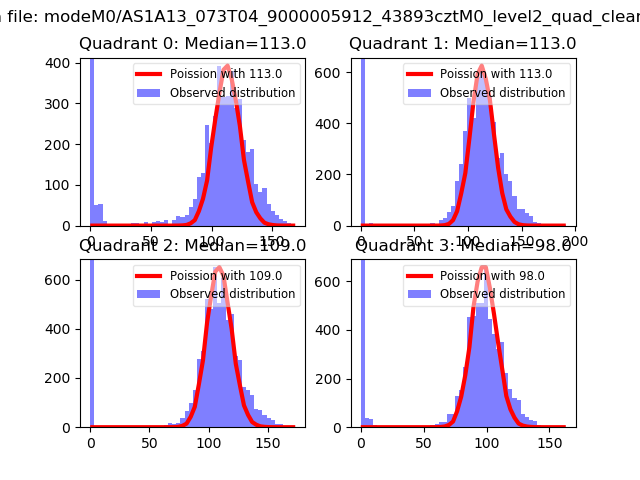 |
 |
| Quadrant-wise count rates Data is divided into 100 sec bins |
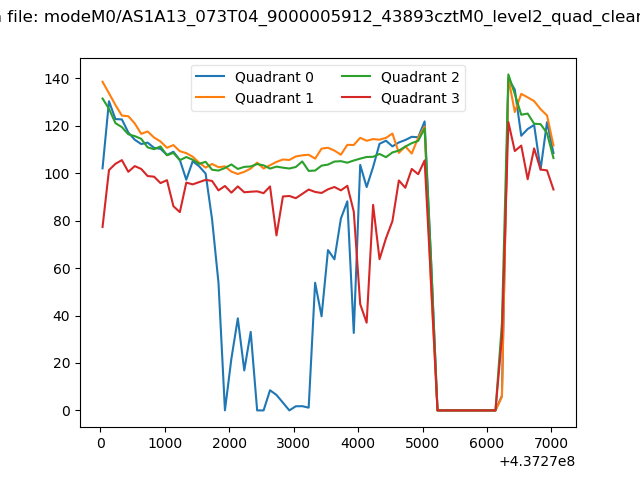 |
|
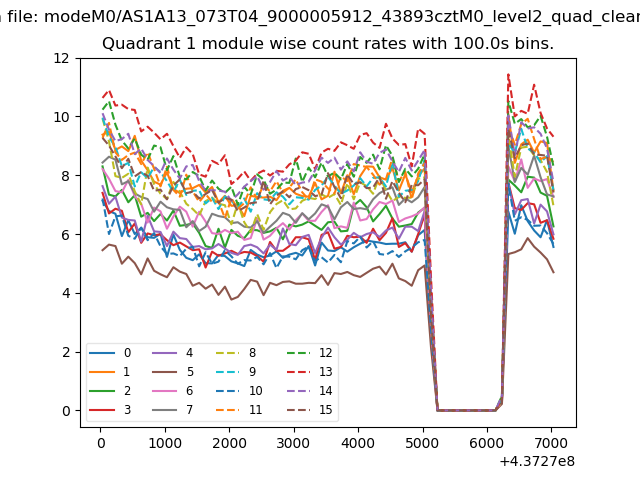
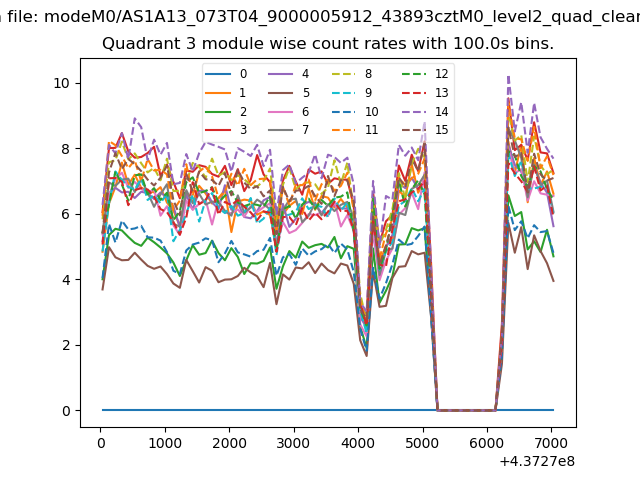
| Module-wise count rates for Quadrant A Data is divided into 100 sec bins |
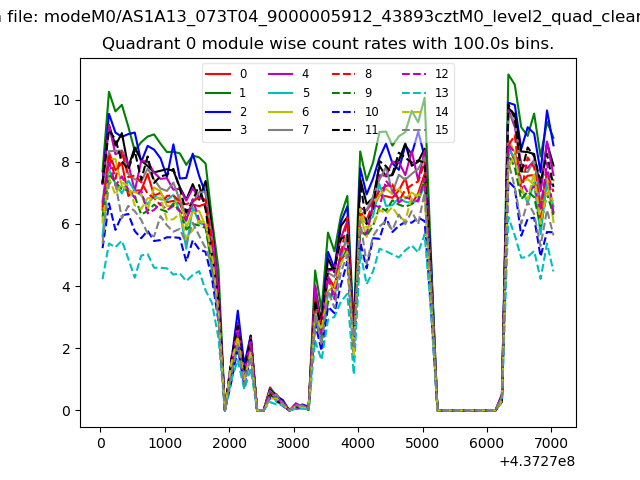 |
 |
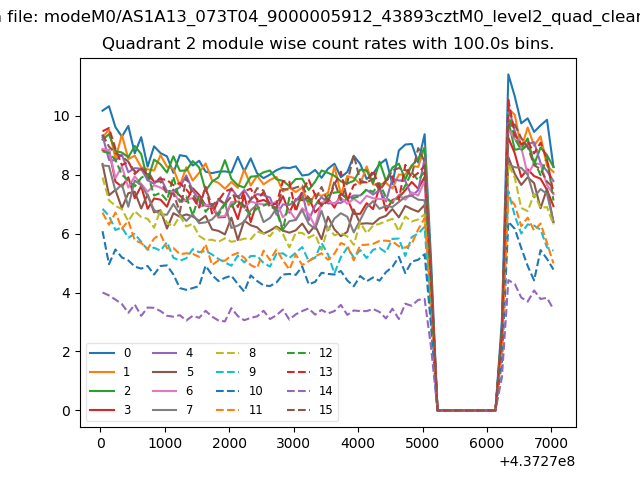
| Module-wise count rates for Quadrant B Data is divided into 100 sec bins |
 |
 |
| Module-wise count rates for Quadrant C Data is divided into 100 sec bins |
 |
 |
| Module-wise count rates for Quadrant D Data is divided into 100 sec bins |
 |
 |
| Parameter | Plot |
|---|---|
| CZT HV Monitor |  |
| D_VDD | 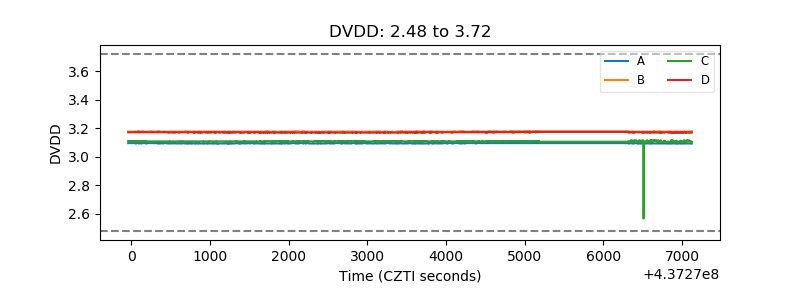 |
| Temperature 1 | 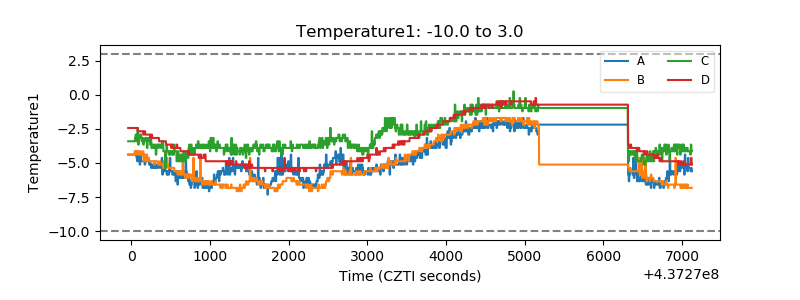 |
| Veto HV Monitor | 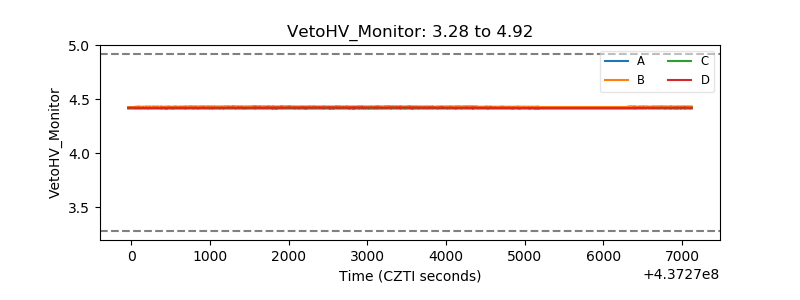 |
| Veto LLD | 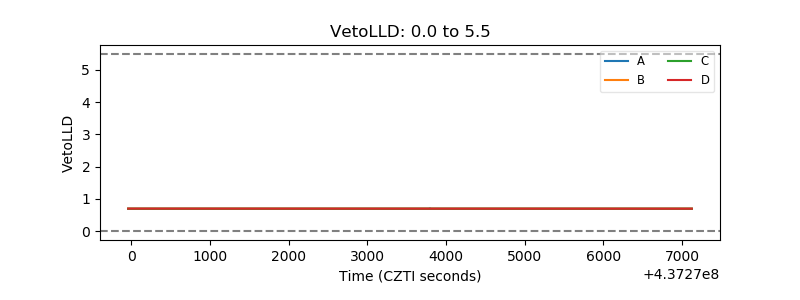 |
| Alpha Counter | 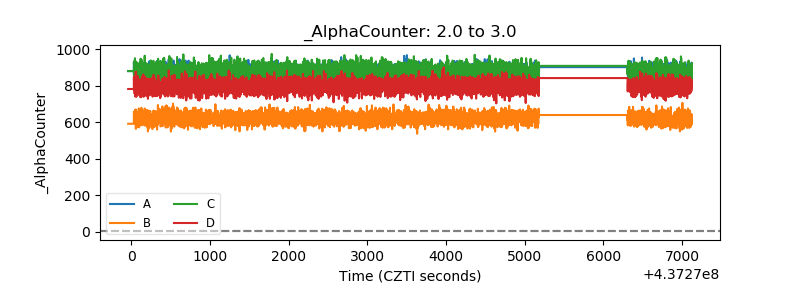 |
| _CPM_Rate | 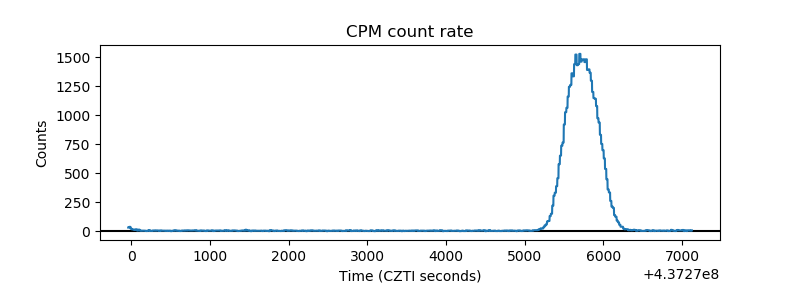 |
| CZT Counter | 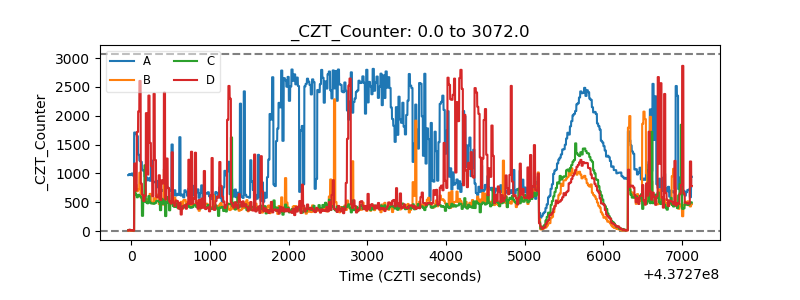 |
| +2.5 Volts monitor | 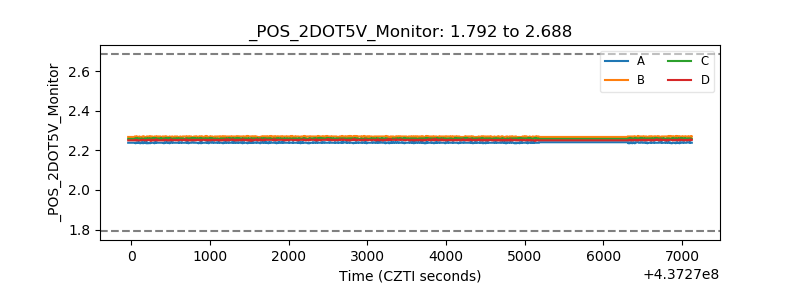 |
| +5 Volts monitor | 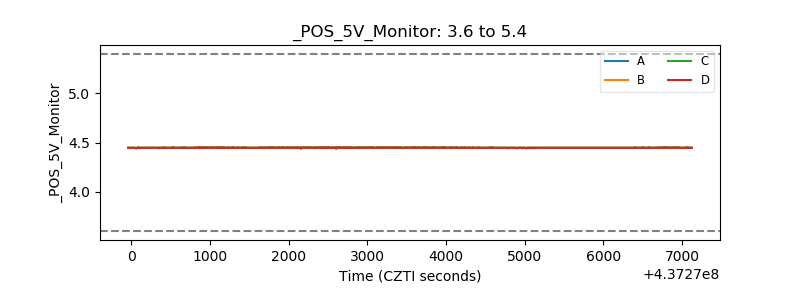 |
| _ROLL_ROT | 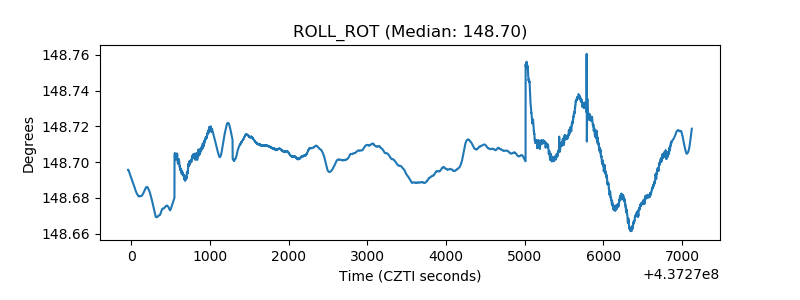 |
| _Roll_DEC | 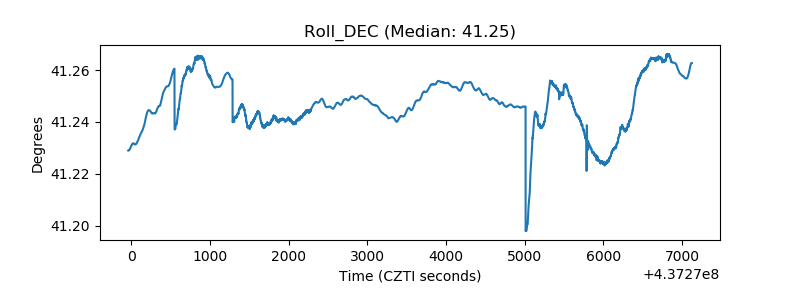 |
| _Roll_RA | 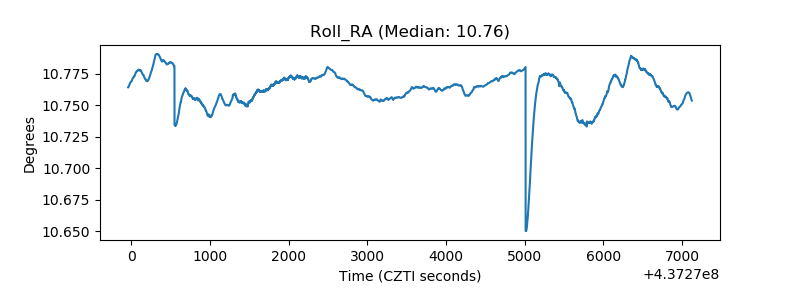 |
| Veto Counter | 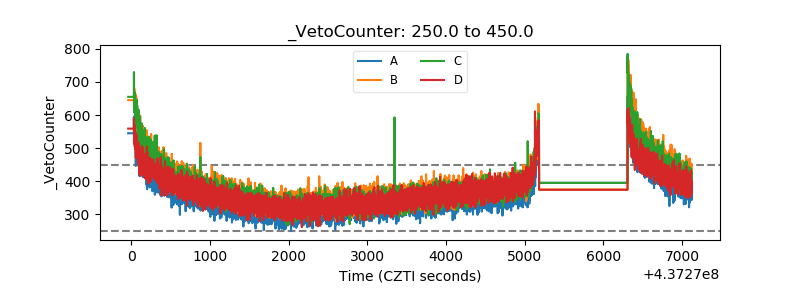 |