| Param | Original file | Final file |
|---|---|---|
| Filename | modeM0/AS1C07_001T10_9000005910_43881cztM0_level2.fits | modeM0/AS1C07_001T10_9000005910_43881cztM0_level2_quad_clean.evt |
| Size (bytes) | 445,420,800 | 93,401,280 |
| Size | 424.8 MB | 89.1 MB |
| Events in quadrant A | 4,500,029 | 634,206 |
| Events in quadrant B | 2,739,658 | 680,873 |
| Events in quadrant C | 2,522,162 | 634,343 |
| Events in quadrant D | 6,279,907 | 477,820 |
| Mode M9 | |||
|---|---|---|---|
| Quadrant | BADHDUFLAG | Total packets | Discarded packets |
| A | 0 | 12 | 0 |
| B | 0 | 12 | 0 |
| C | 0 | 12 | 0 |
| D | 0 | 12 | 0 |
| Mode M0 | |||
|---|---|---|---|
| Quadrant | BADHDUFLAG | Total packets | Discarded packets |
| A | 0 | 17086 | 1 |
| B | 0 | 12074 | 1 |
| C | 0 | 11781 | 1 |
| D | 0 | 22685 | 1 |
| Mode SS | |||
|---|---|---|---|
| Quadrant | BADHDUFLAG | Total packets | Discarded packets |
| A | 0 | 116 | 0 |
| B | 0 | 116 | 0 |
| C | 0 | 116 | 0 |
| D | 0 | 116 | 0 |
| Quadrant | Total seconds | Saturated seconds | Saturation percentage |
|---|---|---|---|
| A | 5736 | 344 | 5.997211% |
| B | 5737 | 53 | 0.923828% |
| C | 5737 | 14 | 0.244030% |
| D | 5737 | 1169 | 20.376503% |
Noise dominated data is calculated using 1-second bins in cleaned event files. If a bin has >2000 counts, and if more than 50% of those come from <1% of pixels, then it is considered to be noise-dominated and hence unusable.
| Quadrant | # 1 sec bins | Bins with >0 counts | Bins with >2000 counts | High rate bins dominated by noise | Noise dominated (total time) | Noise dominated (detector-on time) | Marked lightcurve |
|---|---|---|---|---|---|---|---|
| A | 6866 | 5737 | 270 | 270 | 3.93% | 4.71% | 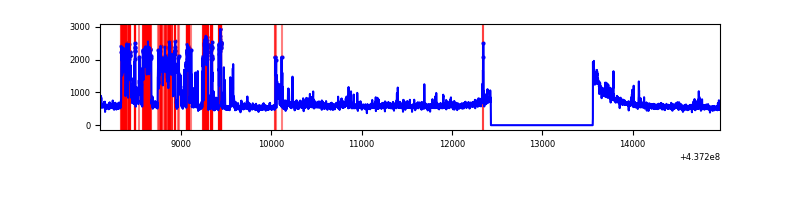 |
| B | 6867 | 5738 | 9 | 9 | 0.13% | 0.16% | 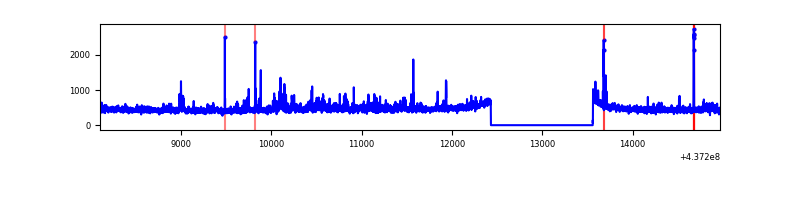 |
| C | 6867 | 5738 | 4 | 4 | 0.06% | 0.07% | 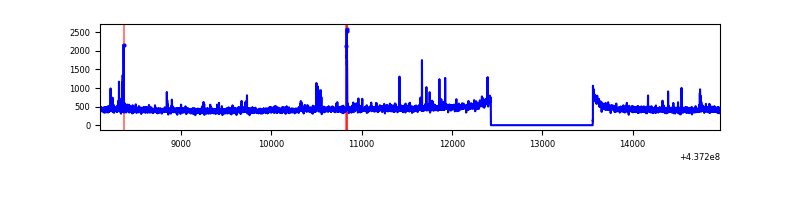 |
| D | 6867 | 5738 | 1114 | 1114 | 16.22% | 19.41% | 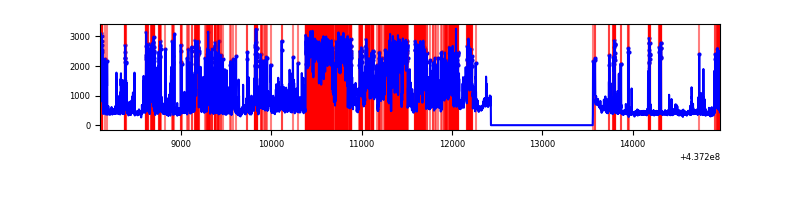 |
Top three noisy pixels from each quadrant. If the there are fewer than three noisy pixels in the level2.evt file, extra rows are filled as -1
| Pixel properties | Quadrant properties | ||||||
|---|---|---|---|---|---|---|---|
| Quadrant | DetID | PixID | Counts | Sigma | Mean | Median | Sigma |
| A | 15 | 223 | 1121500 | 8563.84 | 635 | 621 | 130.9 |
| A | 10 | 83 | 856399 | 6538.39 | 635 | 621 | 130.9 |
| A | 7 | 3 | 29010 | 216.9 | 635 | 621 | 130.9 |
| B | 0 | 200 | 87763 | 712.55 | 637 | 619 | 122.3 |
| B | 4 | 170 | 49179 | 397.06 | 637 | 619 | 122.3 |
| B | 0 | 213 | 19413 | 153.67 | 637 | 619 | 122.3 |
| C | 3 | 233 | 42706 | 293.58 | 615 | 619 | 143.4 |
| C | 2 | 14 | 26337 | 179.4 | 615 | 619 | 143.4 |
| C | 14 | 254 | 15949 | 106.94 | 615 | 619 | 143.4 |
| D | 5 | 235 | 2064838 | 14517.21 | 562 | 543 | 142.2 |
| D | 7 | 80 | 619108 | 4350.07 | 562 | 543 | 142.2 |
| D | 1 | 52 | 456321 | 3205.27 | 562 | 543 | 142.2 |
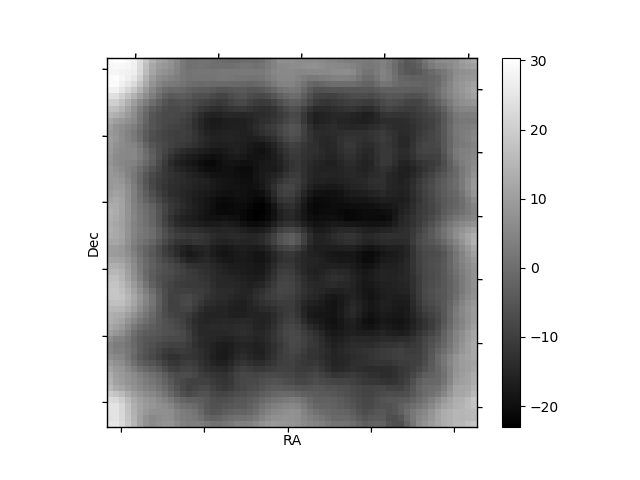
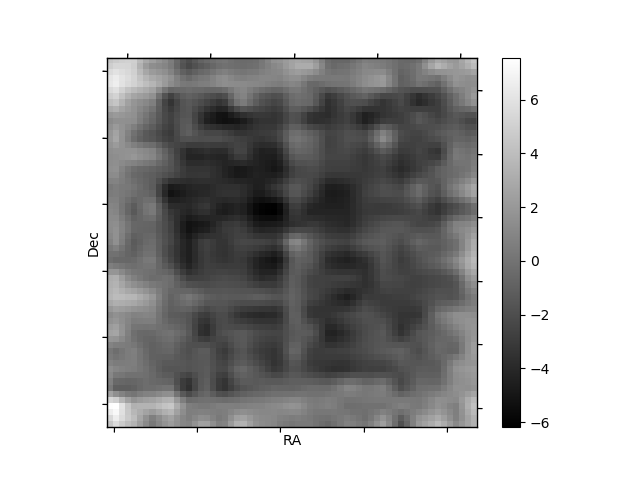
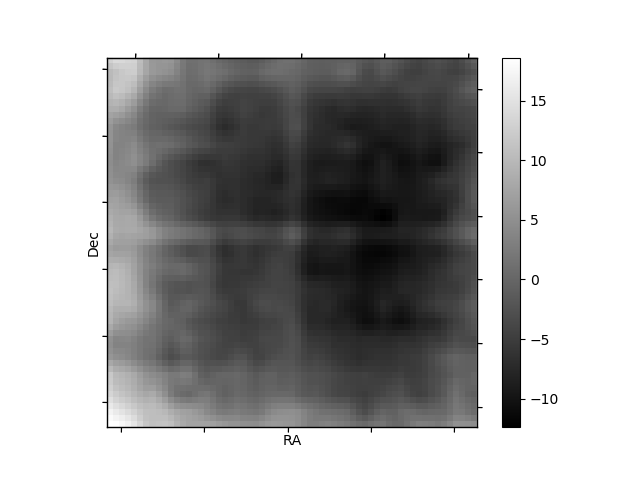
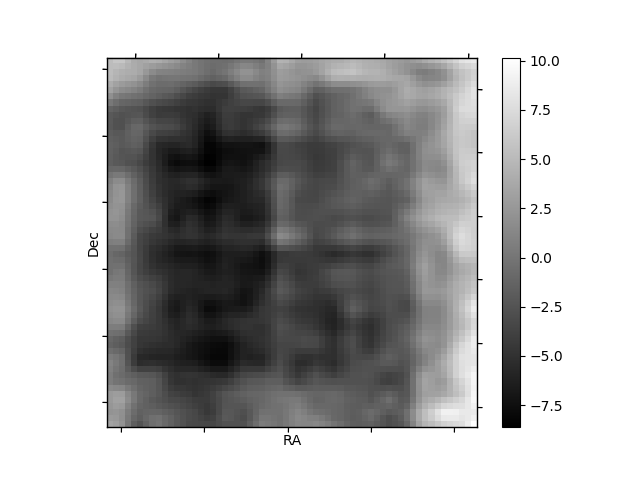
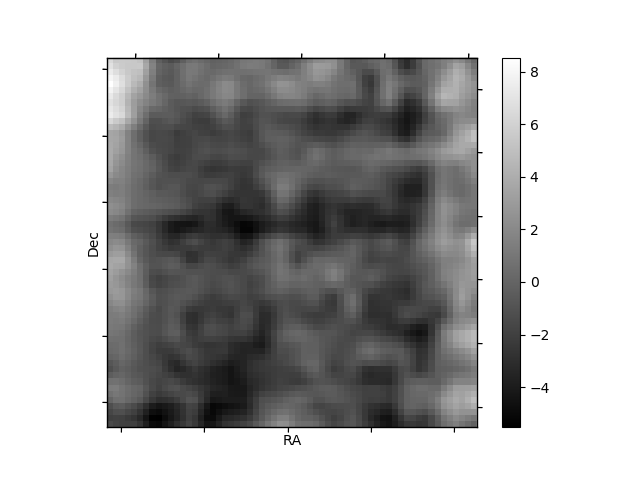
Histogram calculated using DETX and DETY for each event in the final _common_clean file
| Quadrant A | 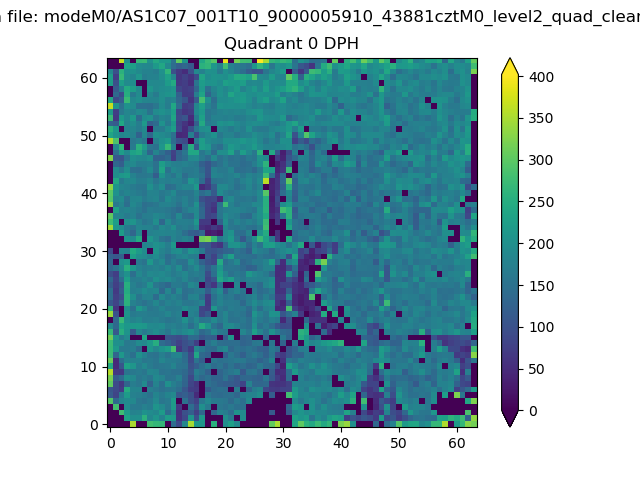 |
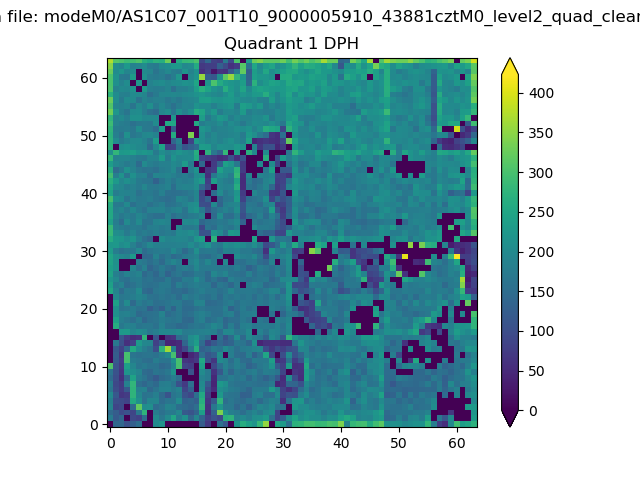 |
Quadrant B |
|---|---|---|---|
| Quadrant D | 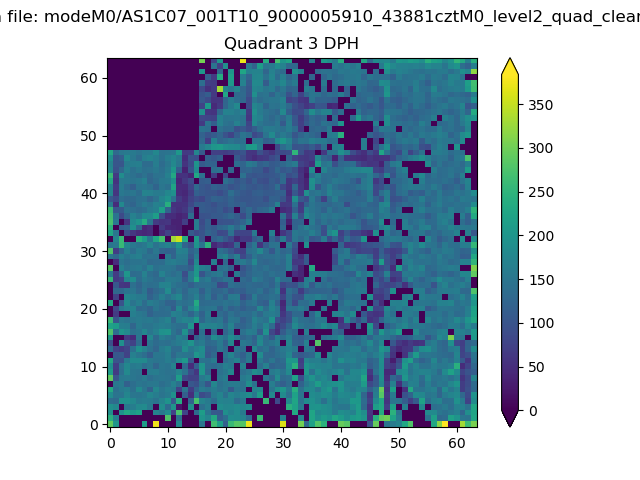 |
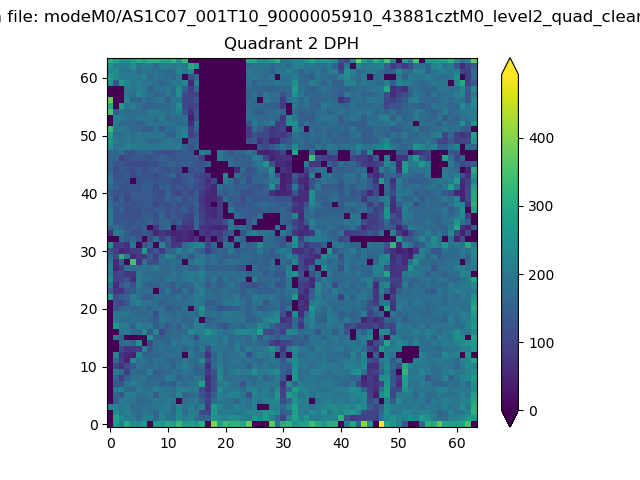 |
Quadrant C |
| Plot type | Count rate plots | Images |
|---|---|---|
| Comparison with Poisson distribution Blue bars denote a histogram of data divided into 1 sec bins. Red curve is a Poisson curve with rate = median count rate of data. |
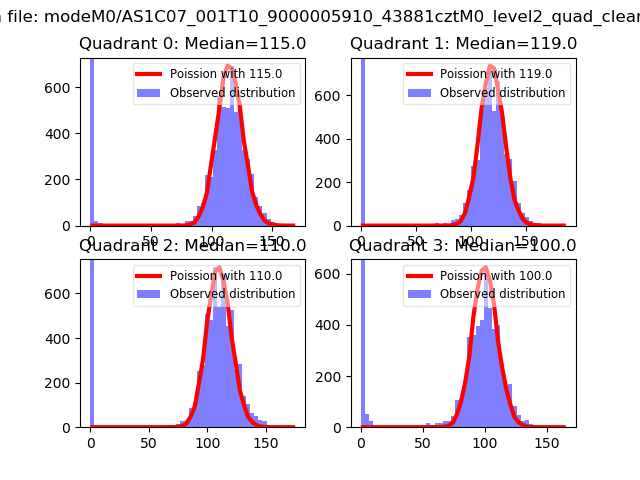 |
 |
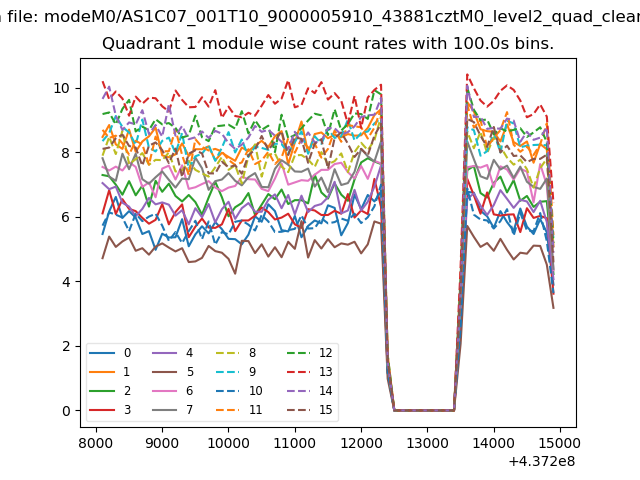
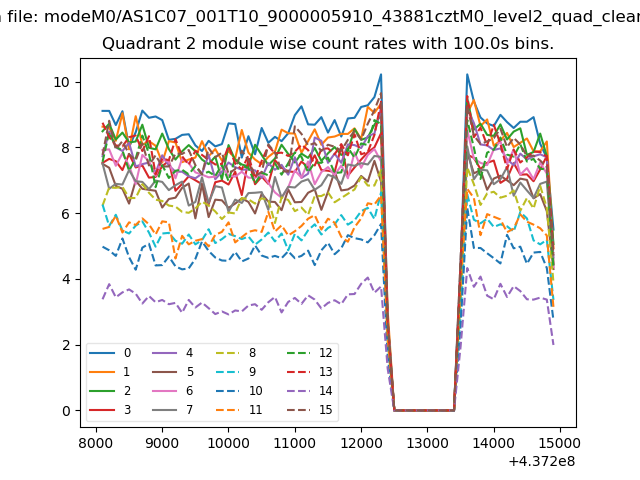
| Quadrant-wise count rates Data is divided into 100 sec bins |
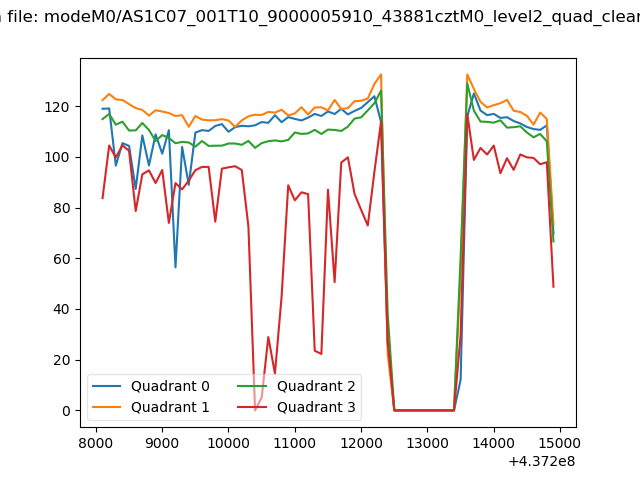 |
|
| Module-wise count rates for Quadrant A Data is divided into 100 sec bins |
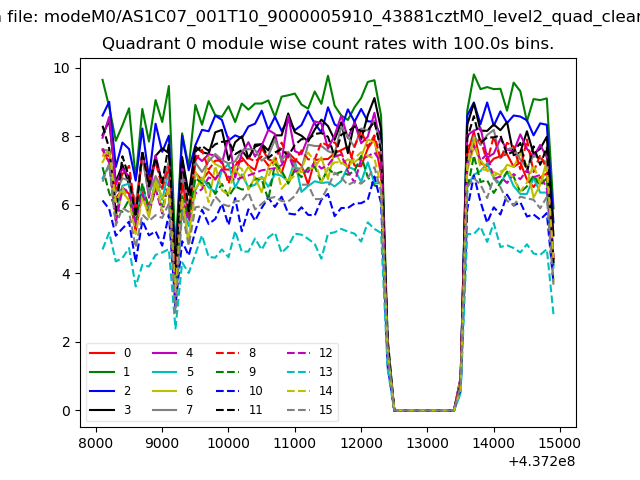 |
 |
| Module-wise count rates for Quadrant B Data is divided into 100 sec bins |
 |
 |
| Module-wise count rates for Quadrant C Data is divided into 100 sec bins |
 |
 |
| Module-wise count rates for Quadrant D Data is divided into 100 sec bins |
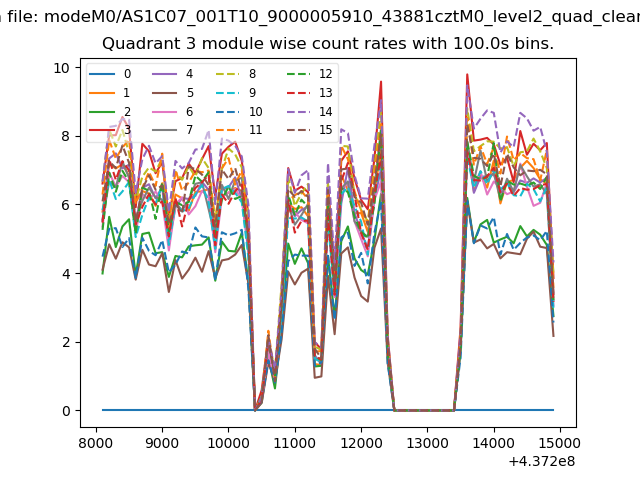 |
 |
| Parameter | Plot |
|---|---|
| CZT HV Monitor | 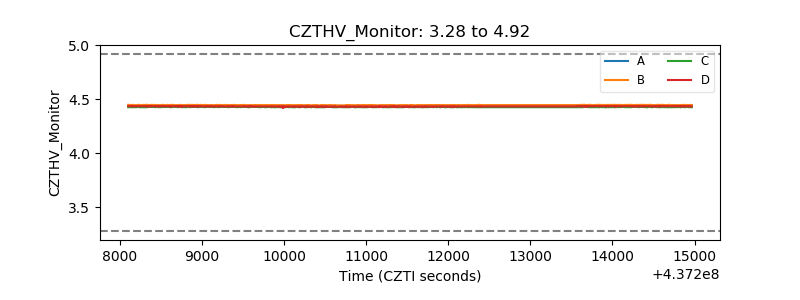 |
| D_VDD | 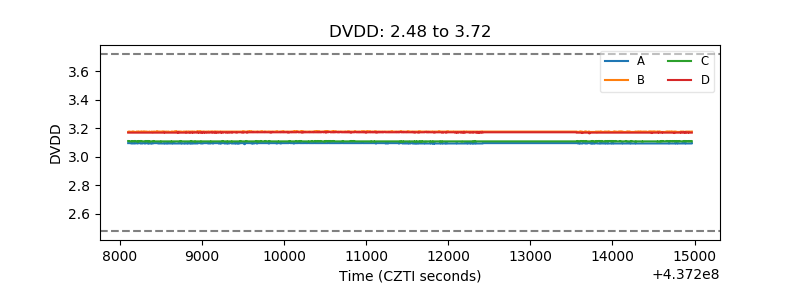 |
| Temperature 1 | 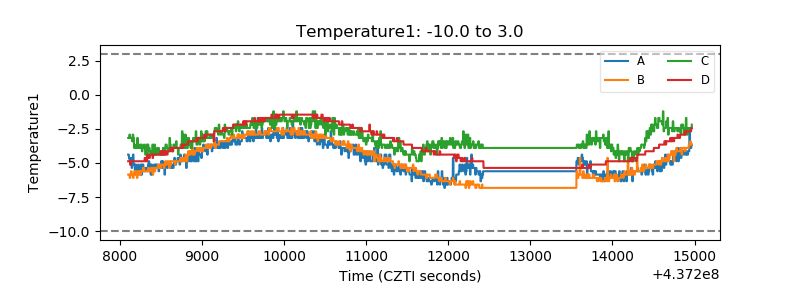 |
| Veto HV Monitor |  |
| Veto LLD | 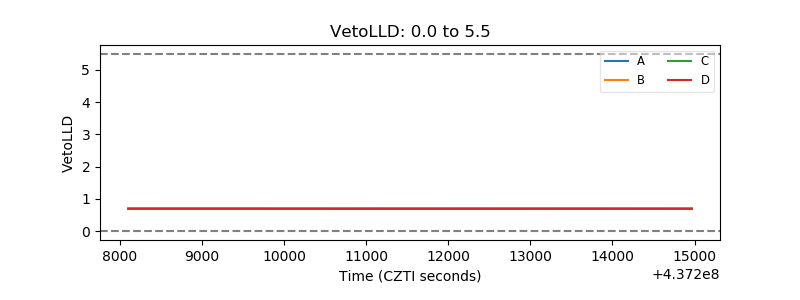 |
| Alpha Counter | 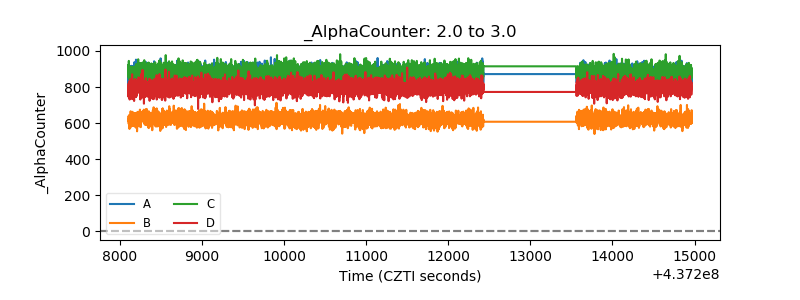 |
| _CPM_Rate | 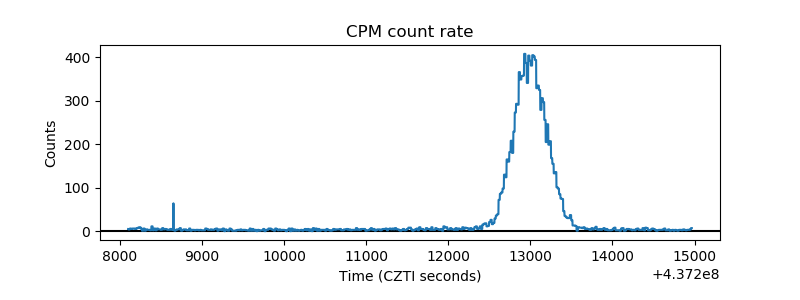 |
| CZT Counter | 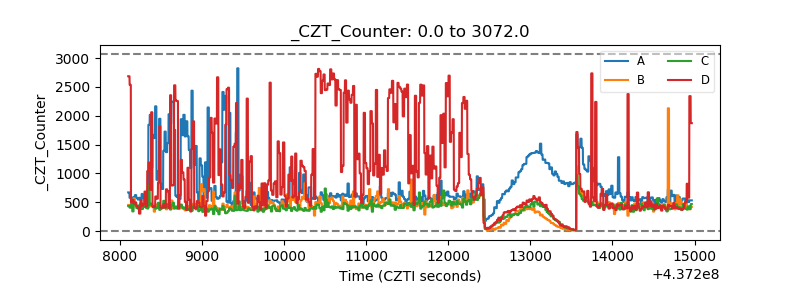 |
| +2.5 Volts monitor | 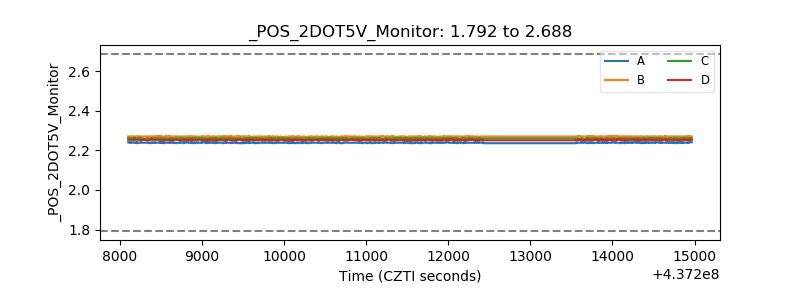 |
| +5 Volts monitor | 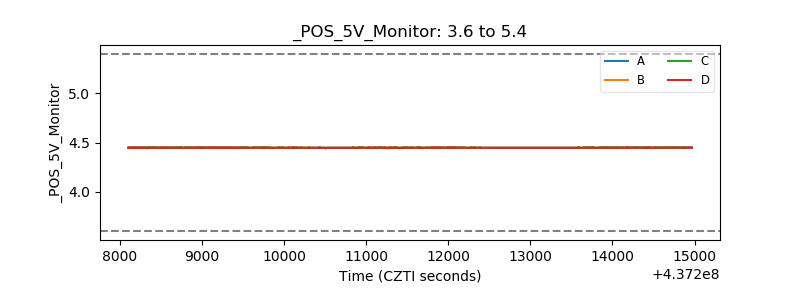 |
| _ROLL_ROT | 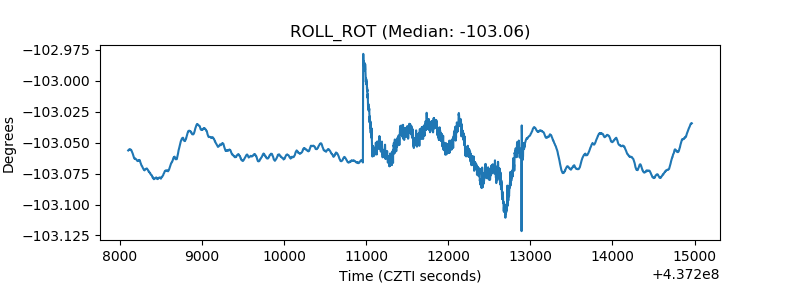 |
| _Roll_DEC | 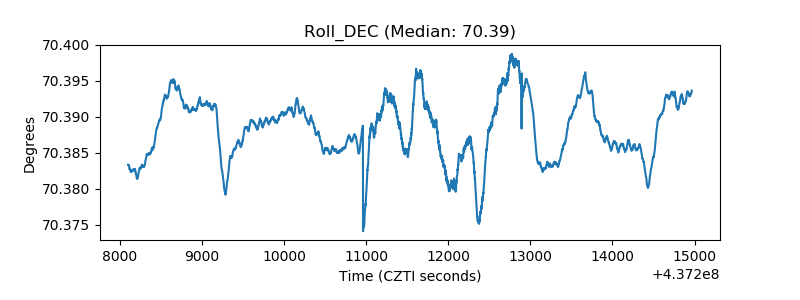 |
| _Roll_RA | 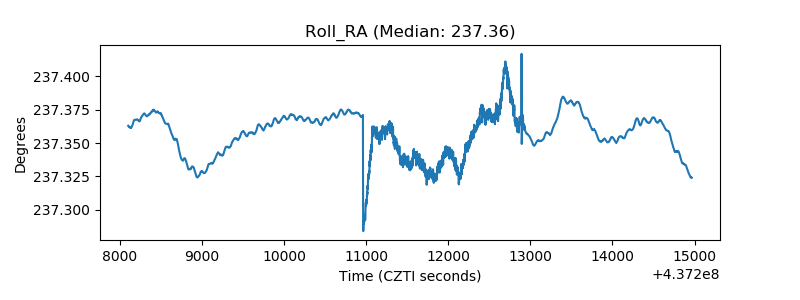 |
| Veto Counter | 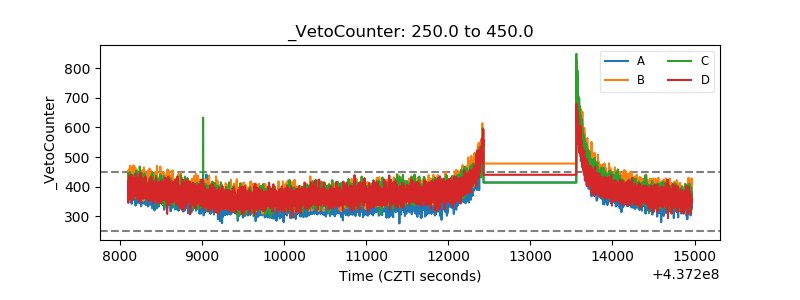 |