| Param | Original file | Final file |
|---|---|---|
| Filename | modeM0/AS1C07_001T10_9000005910_43883cztM0_level2.fits | modeM0/AS1C07_001T10_9000005910_43883cztM0_level2_quad_clean.evt |
| Size (bytes) | 542,283,840 | 109,742,400 |
| Size | 517.2 MB | 104.7 MB |
| Events in quadrant A | 5,118,914 | 715,470 |
| Events in quadrant B | 3,677,036 | 782,557 |
| Events in quadrant C | 3,496,069 | 734,073 |
| Events in quadrant D | 7,227,644 | 593,523 |
| Mode M9 | |||
|---|---|---|---|
| Quadrant | BADHDUFLAG | Total packets | Discarded packets |
| A | 0 | 1 | 0 |
| B | 0 | 1 | 0 |
| C | 0 | 1 | 0 |
| D | 0 | 1 | 0 |
| Mode M0 | |||
|---|---|---|---|
| Quadrant | BADHDUFLAG | Total packets | Discarded packets |
| A | 0 | 19552 | 3 |
| B | 0 | 15782 | 4 |
| C | 0 | 15514 | 3 |
| D | 0 | 26478 | 3 |
| Mode SS | |||
|---|---|---|---|
| Quadrant | BADHDUFLAG | Total packets | Discarded packets |
| A | 0 | 148 | 0 |
| B | 0 | 148 | 0 |
| C | 0 | 148 | 0 |
| D | 0 | 148 | 0 |
| Quadrant | Total seconds | Saturated seconds | Saturation percentage |
|---|---|---|---|
| A | 7129 | 595 | 8.346192% |
| B | 7129 | 270 | 3.787347% |
| C | 7129 | 222 | 3.114041% |
| D | 7129 | 1245 | 17.463880% |
Noise dominated data is calculated using 1-second bins in cleaned event files. If a bin has >2000 counts, and if more than 50% of those come from <1% of pixels, then it is considered to be noise-dominated and hence unusable.
| Quadrant | # 1 sec bins | Bins with >0 counts | Bins with >2000 counts | High rate bins dominated by noise | Noise dominated (total time) | Noise dominated (detector-on time) | Marked lightcurve |
|---|---|---|---|---|---|---|---|
| A | 7359 | 7132 | 297 | 297 | 4.04% | 4.16% | 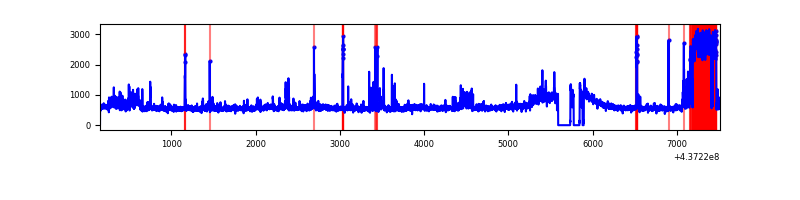 |
| B | 7359 | 7132 | 19 | 19 | 0.26% | 0.27% | 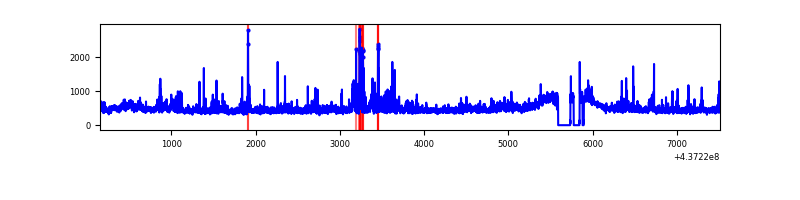 |
| C | 7359 | 7132 | 29 | 29 | 0.39% | 0.41% | 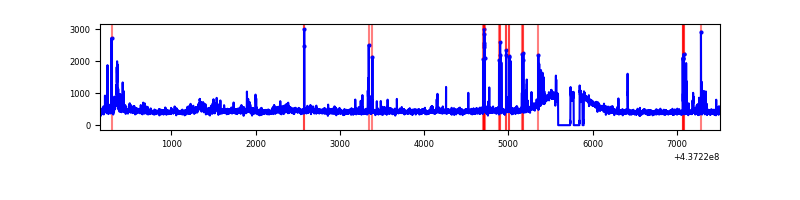 |
| D | 7359 | 7132 | 1084 | 1084 | 14.73% | 15.20% | 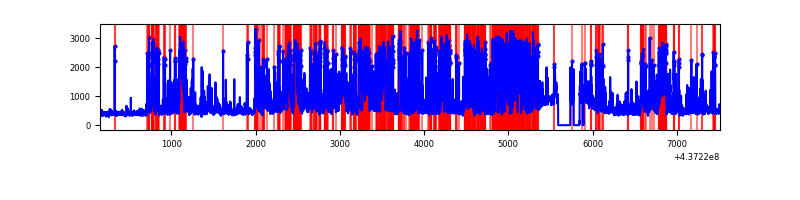 |
Top three noisy pixels from each quadrant. If the there are fewer than three noisy pixels in the level2.evt file, extra rows are filled as -1
| Pixel properties | Quadrant properties | ||||||
|---|---|---|---|---|---|---|---|
| Quadrant | DetID | PixID | Counts | Sigma | Mean | Median | Sigma |
| A | 10 | 83 | 927754 | 5751.22 | 781 | 762 | 161.2 |
| A | 15 | 222 | 780539 | 4837.87 | 781 | 762 | 161.2 |
| A | 15 | 223 | 222410 | 1375.14 | 781 | 762 | 161.2 |
| B | 0 | 213 | 152124 | 957.11 | 795 | 768 | 158.1 |
| B | 10 | 128 | 102535 | 643.53 | 795 | 768 | 158.1 |
| B | 0 | 183 | 84274 | 528.05 | 795 | 768 | 158.1 |
| C | 3 | 233 | 233552 | 1264.54 | 783 | 785 | 184.1 |
| C | 14 | 254 | 116496 | 628.62 | 783 | 785 | 184.1 |
| C | 15 | 158 | 38258 | 203.58 | 783 | 785 | 184.1 |
| D | 1 | 52 | 2275135 | 12021.88 | 743 | 716 | 189.2 |
| D | 13 | 171 | 898571 | 4745.78 | 743 | 716 | 189.2 |
| D | 12 | 233 | 397059 | 2094.95 | 743 | 716 | 189.2 |
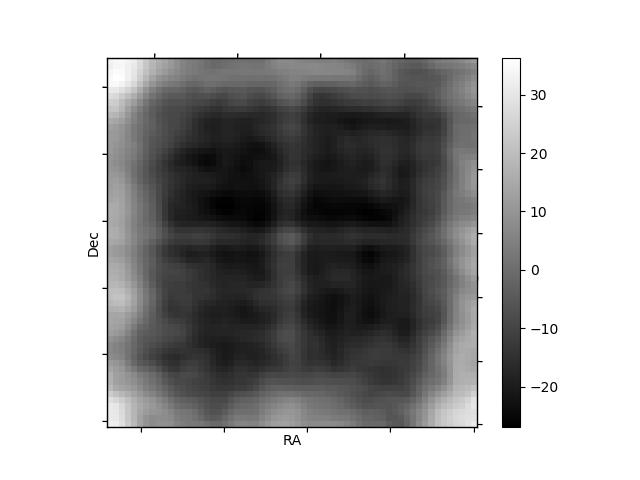
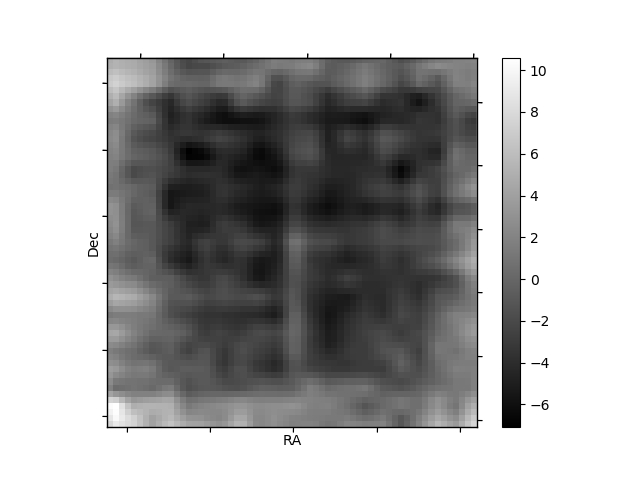
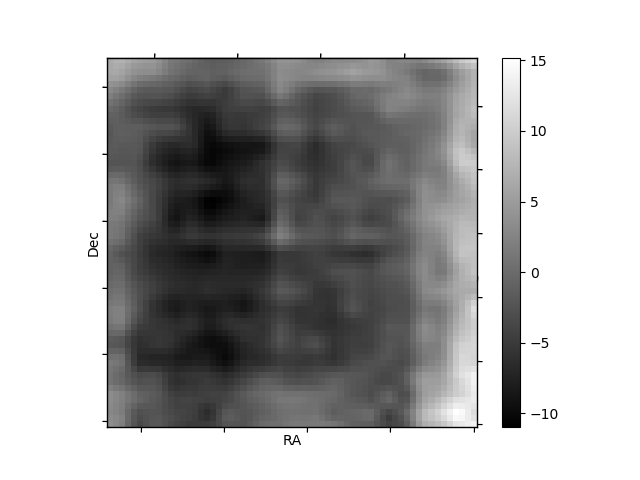
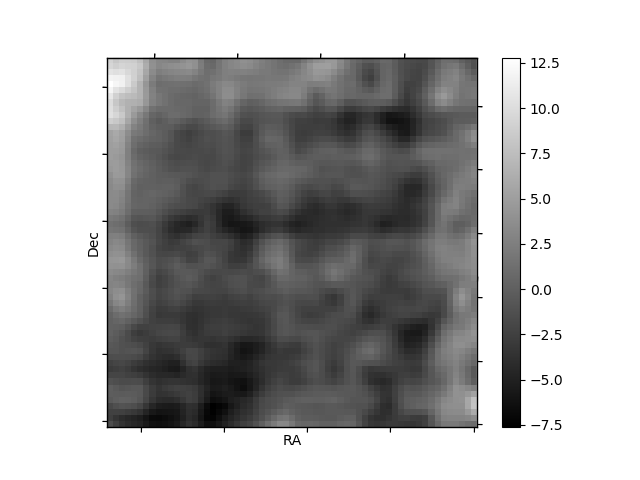
Histogram calculated using DETX and DETY for each event in the final _common_clean file
| Quadrant A | 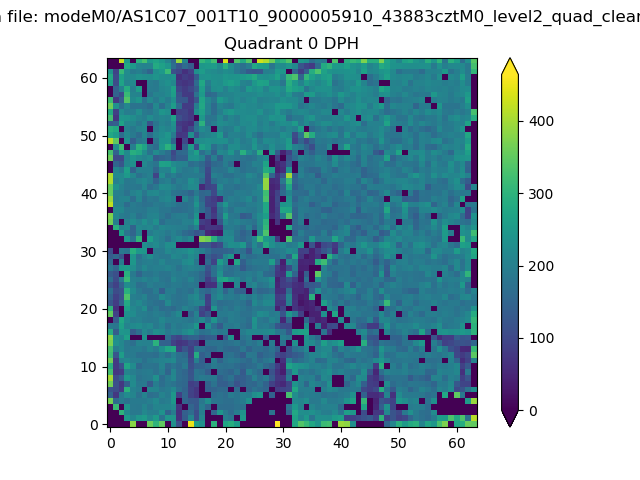 |
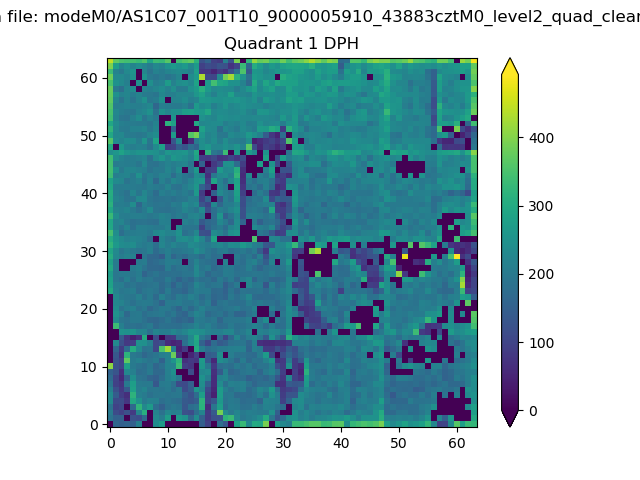 |
Quadrant B |
|---|---|---|---|
| Quadrant D | 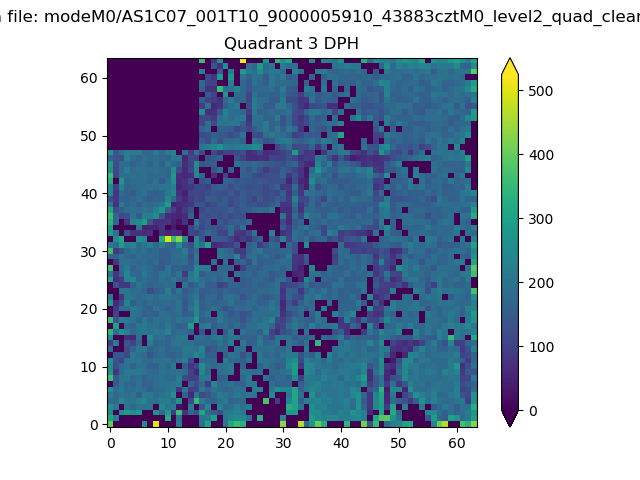 |
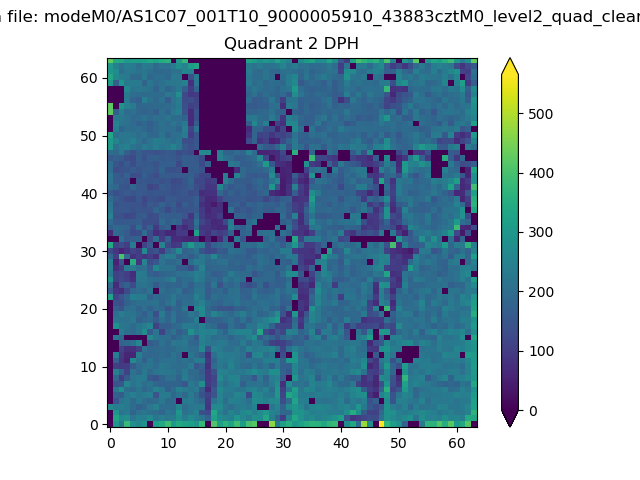 |
Quadrant C |
| Plot type | Count rate plots | Images |
|---|---|---|
| Comparison with Poisson distribution Blue bars denote a histogram of data divided into 1 sec bins. Red curve is a Poisson curve with rate = median count rate of data. |
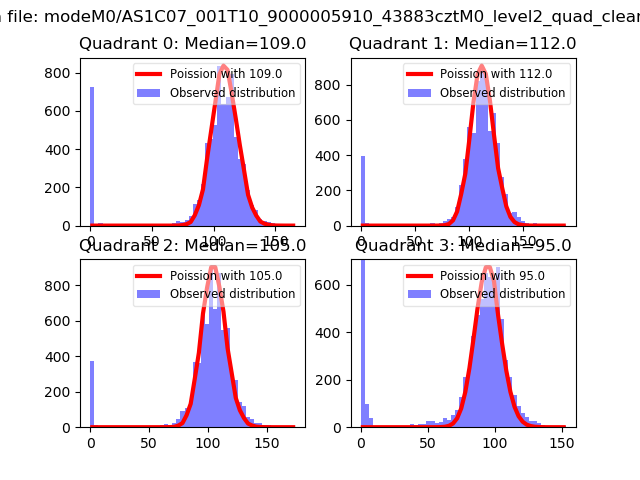 |
 |
| Quadrant-wise count rates Data is divided into 100 sec bins |
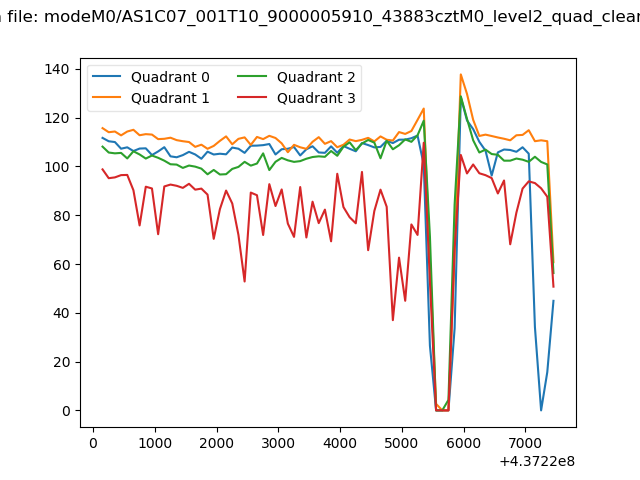 |
|
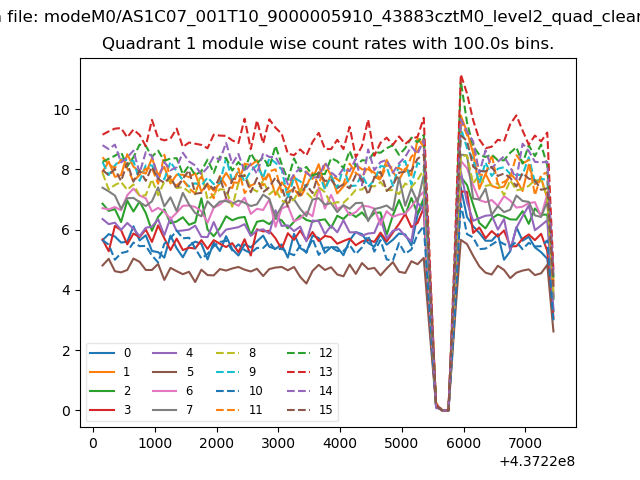
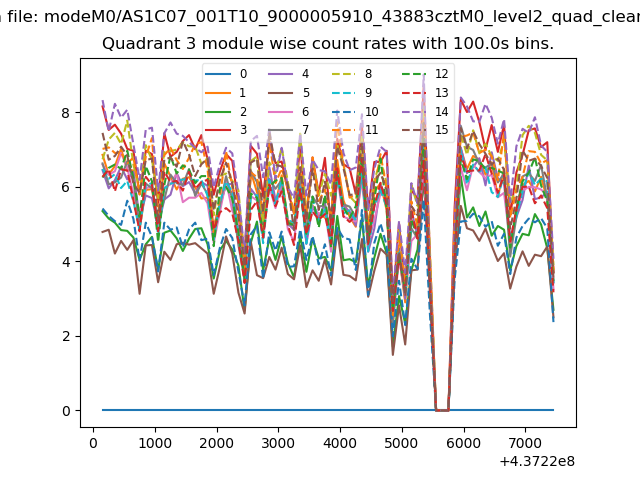
| Module-wise count rates for Quadrant A Data is divided into 100 sec bins |
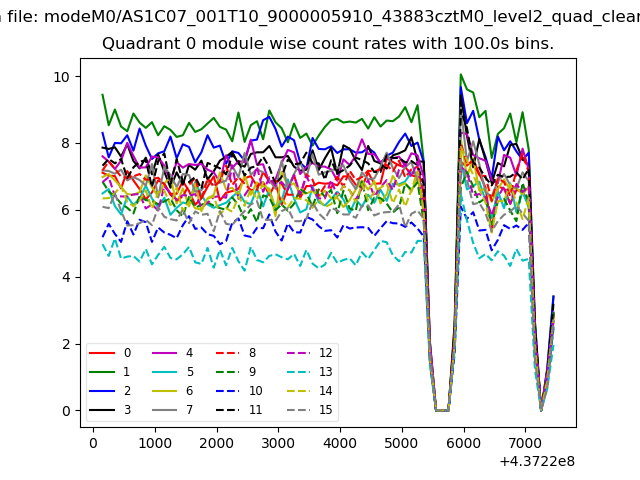 |
 |
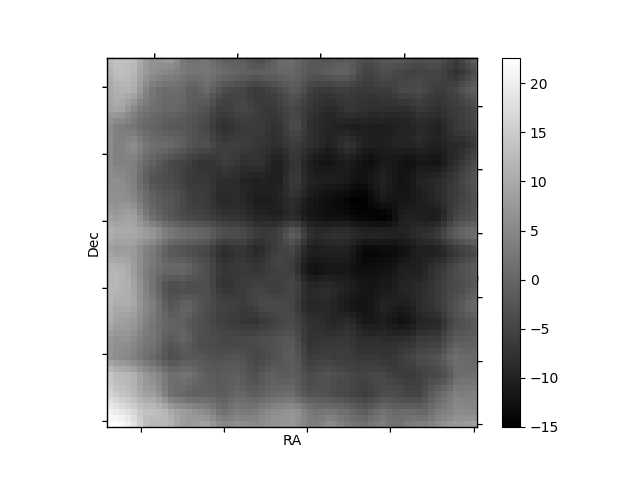
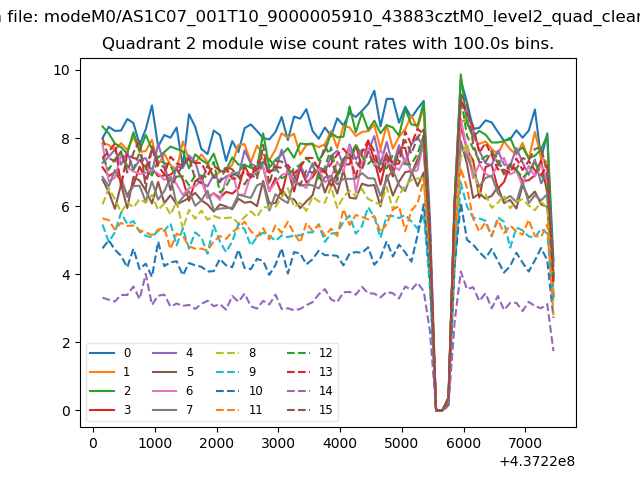
| Module-wise count rates for Quadrant B Data is divided into 100 sec bins |
 |
 |
| Module-wise count rates for Quadrant C Data is divided into 100 sec bins |
 |
 |
| Module-wise count rates for Quadrant D Data is divided into 100 sec bins |
 |
 |
| Parameter | Plot |
|---|---|
| CZT HV Monitor | 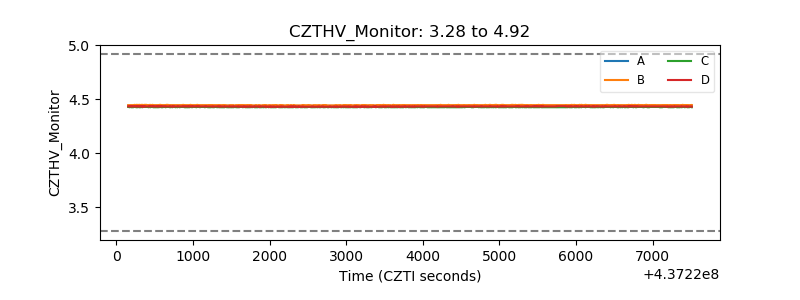 |
| D_VDD | 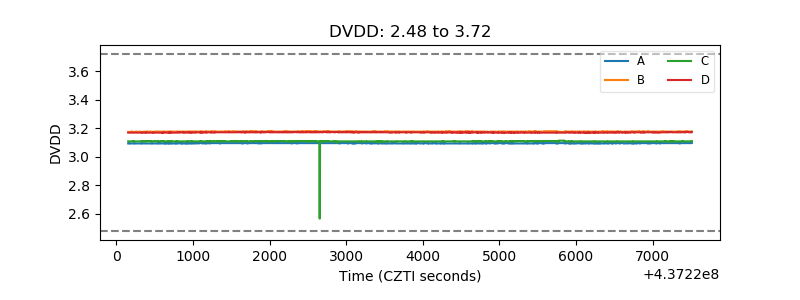 |
| Temperature 1 | 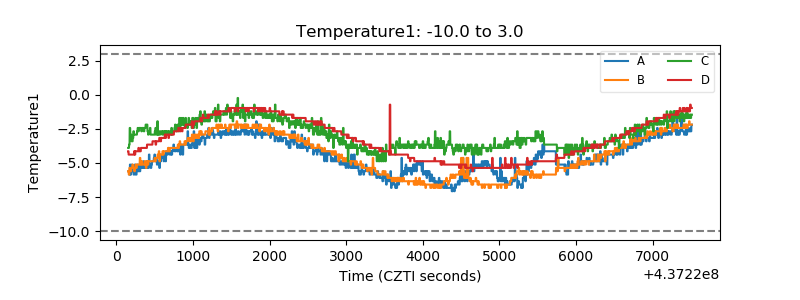 |
| Veto HV Monitor | 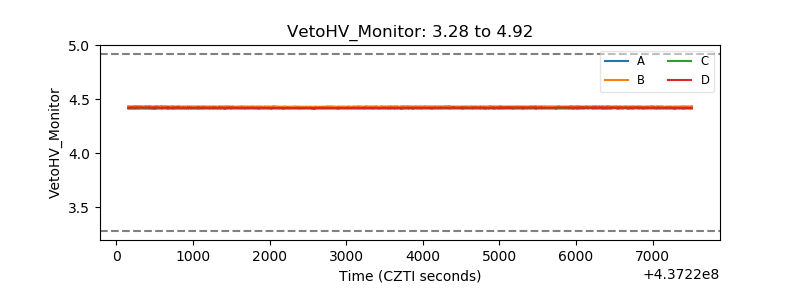 |
| Veto LLD | 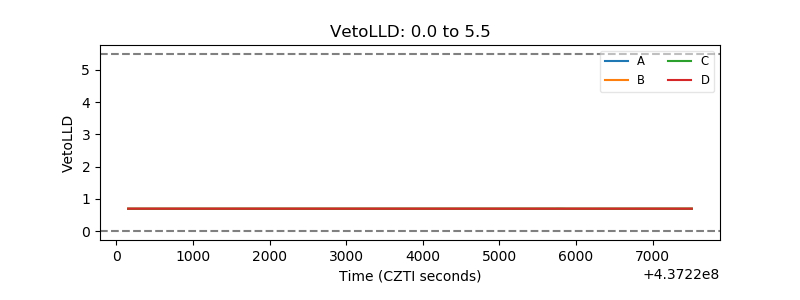 |
| Alpha Counter | 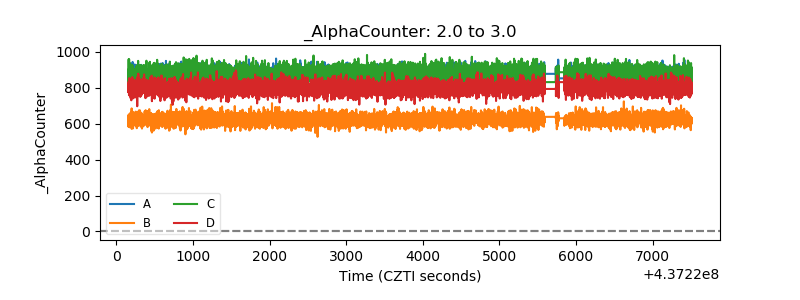 |
| _CPM_Rate | 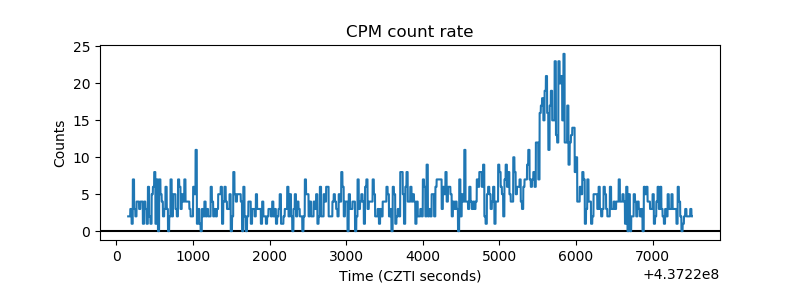 |
| CZT Counter | 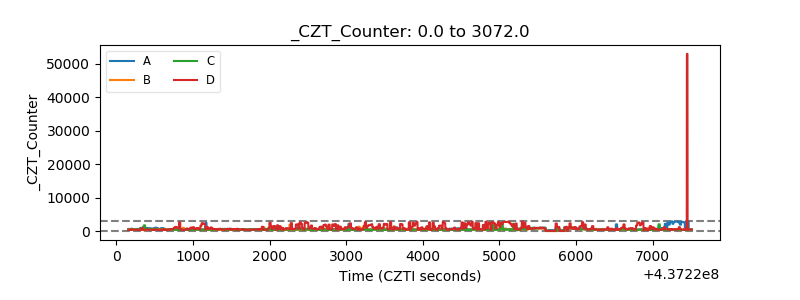 |
| +2.5 Volts monitor | 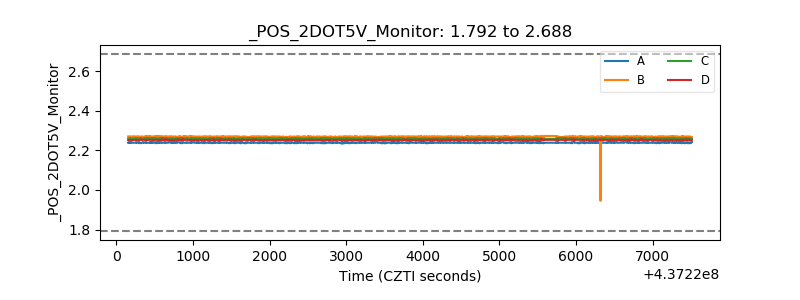 |
| +5 Volts monitor | 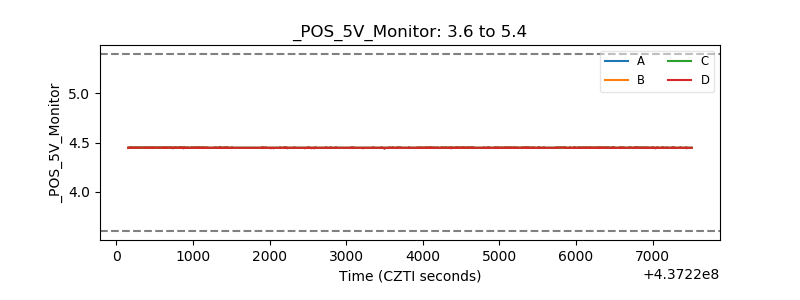 |
| _ROLL_ROT | 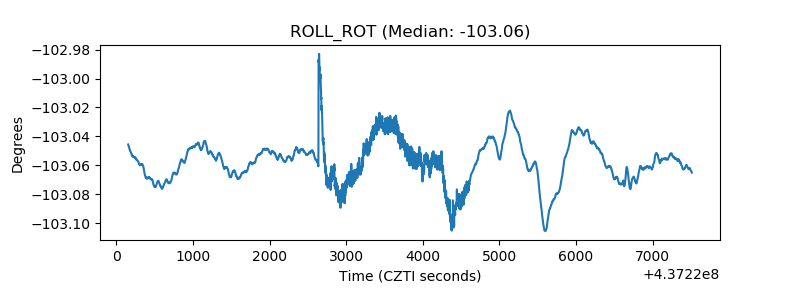 |
| _Roll_DEC | 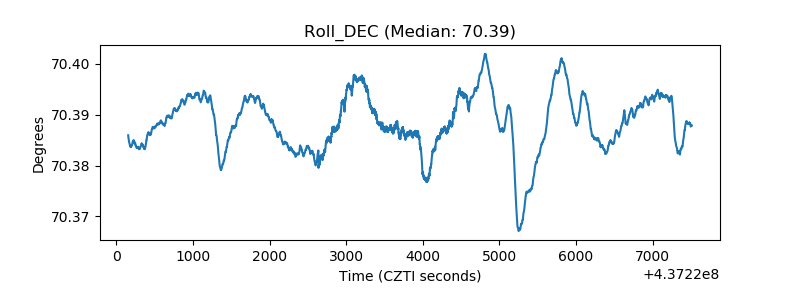 |
| _Roll_RA | 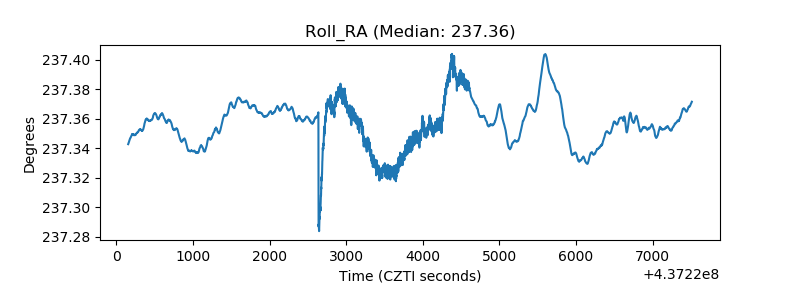 |
| Veto Counter | 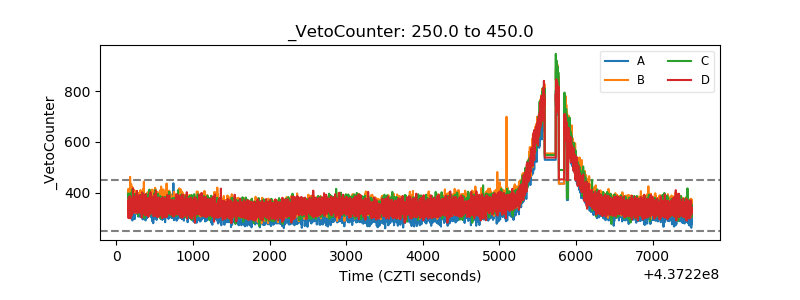 |