| Param | Original file | Final file |
|---|---|---|
| Filename | modeM0/AS1C07_001T10_9000005910_43884cztM0_level2.fits | modeM0/AS1C07_001T10_9000005910_43884cztM0_level2_quad_clean.evt |
| Size (bytes) | 566,979,840 | 116,219,520 |
| Size | 540.7 MB | 110.8 MB |
| Events in quadrant A | 6,146,595 | 746,136 |
| Events in quadrant B | 3,914,429 | 828,514 |
| Events in quadrant C | 3,535,942 | 773,421 |
| Events in quadrant D | 6,812,643 | 652,247 |
| Mode M0 | |||
|---|---|---|---|
| Quadrant | BADHDUFLAG | Total packets | Discarded packets |
| A | 0 | 23111 | 0 |
| B | 0 | 16796 | 0 |
| C | 0 | 16119 | 0 |
| D | 0 | 25429 | 0 |
| Mode SS | |||
|---|---|---|---|
| Quadrant | BADHDUFLAG | Total packets | Discarded packets |
| A | 0 | 148 | 0 |
| B | 0 | 148 | 0 |
| C | 0 | 148 | 0 |
| D | 0 | 148 | 0 |
| Quadrant | Total seconds | Saturated seconds | Saturation percentage |
|---|---|---|---|
| A | 7452 | 595 | 7.984434% |
| B | 7452 | 56 | 0.751476% |
| C | 7453 | 79 | 1.059976% |
| D | 7453 | 817 | 10.962029% |
Noise dominated data is calculated using 1-second bins in cleaned event files. If a bin has >2000 counts, and if more than 50% of those come from <1% of pixels, then it is considered to be noise-dominated and hence unusable.
| Quadrant | # 1 sec bins | Bins with >0 counts | Bins with >2000 counts | High rate bins dominated by noise | Noise dominated (total time) | Noise dominated (detector-on time) | Marked lightcurve |
|---|---|---|---|---|---|---|---|
| A | 7452 | 7452 | 550 | 550 | 7.38% | 7.38% | 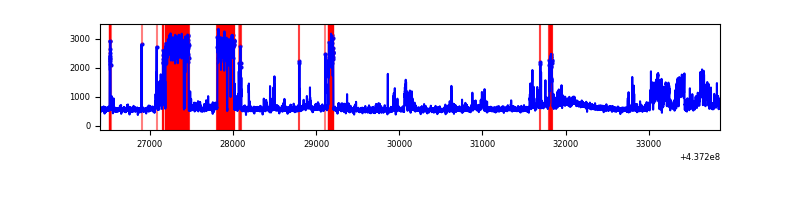 |
| B | 7452 | 7452 | 17 | 17 | 0.23% | 0.23% | 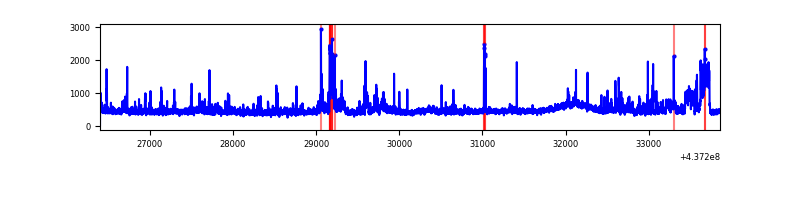 |
| C | 7453 | 7453 | 55 | 55 | 0.74% | 0.74% | 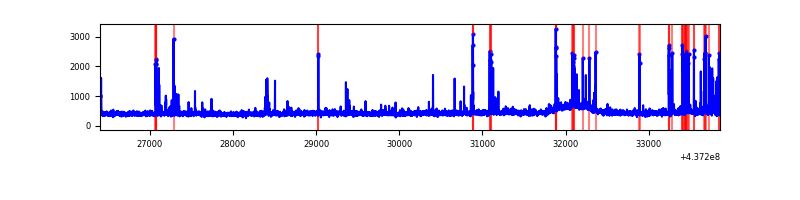 |
| D | 7453 | 7453 | 867 | 867 | 11.63% | 11.63% | 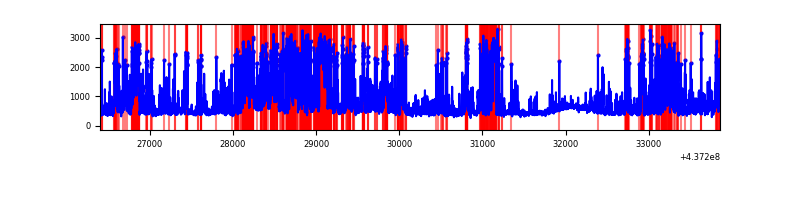 |
Top three noisy pixels from each quadrant. If the there are fewer than three noisy pixels in the level2.evt file, extra rows are filled as -1
| Pixel properties | Quadrant properties | ||||||
|---|---|---|---|---|---|---|---|
| Quadrant | DetID | PixID | Counts | Sigma | Mean | Median | Sigma |
| A | 15 | 222 | 1869746 | 11537.04 | 778 | 759 | 162.0 |
| A | 10 | 83 | 949284 | 5855.13 | 778 | 759 | 162.0 |
| A | 15 | 223 | 266847 | 1642.53 | 778 | 759 | 162.0 |
| B | 7 | 205 | 217131 | 1362.25 | 811 | 786 | 158.8 |
| B | 0 | 183 | 207759 | 1303.24 | 811 | 786 | 158.8 |
| B | 0 | 213 | 83111 | 518.37 | 811 | 786 | 158.8 |
| C | 15 | 158 | 132007 | 707.56 | 790 | 794 | 185.4 |
| C | 3 | 233 | 91427 | 488.74 | 790 | 794 | 185.4 |
| C | 14 | 254 | 72972 | 389.22 | 790 | 794 | 185.4 |
| D | 13 | 171 | 1319018 | 6823.24 | 765 | 740 | 193.2 |
| D | 1 | 52 | 748790 | 3871.81 | 765 | 740 | 193.2 |
| D | 7 | 80 | 555524 | 2871.49 | 765 | 740 | 193.2 |
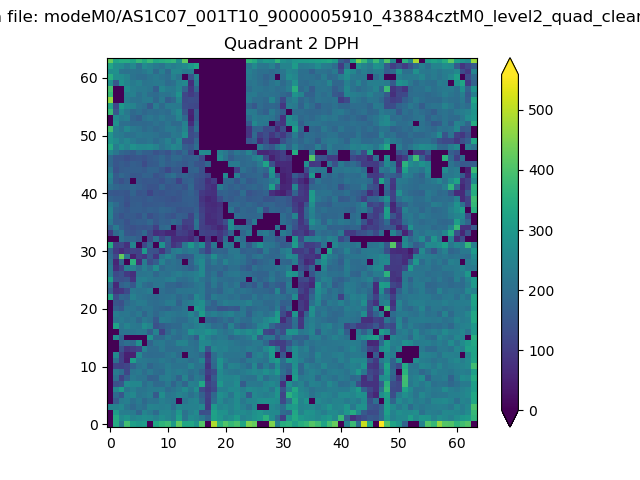
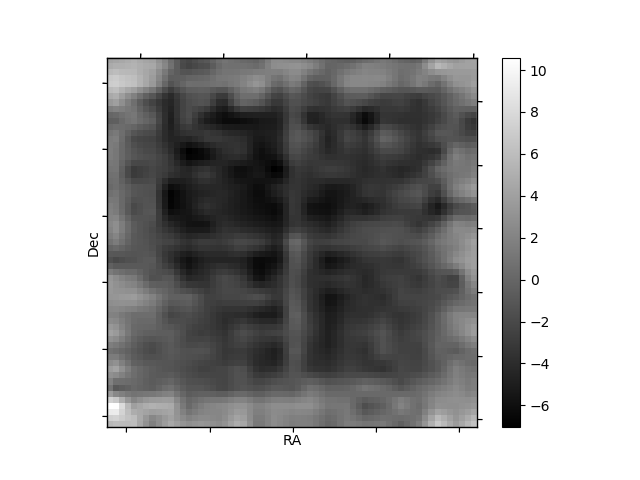
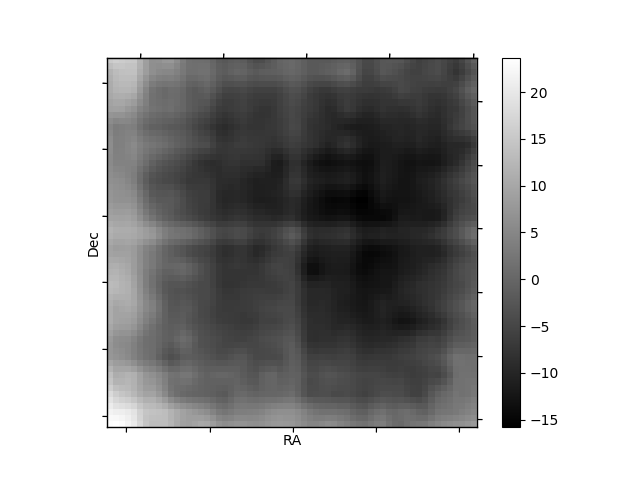
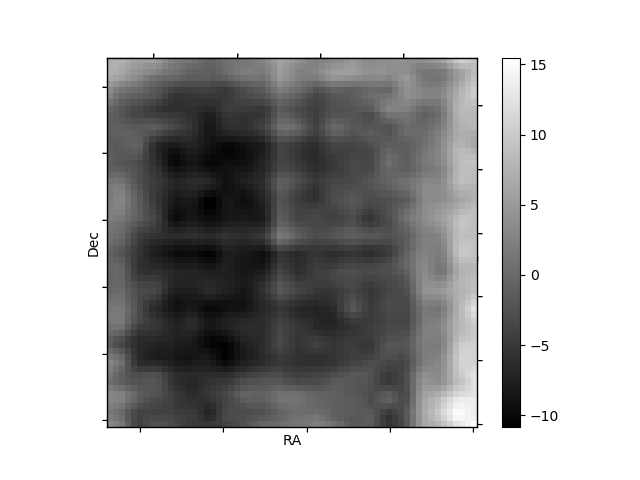
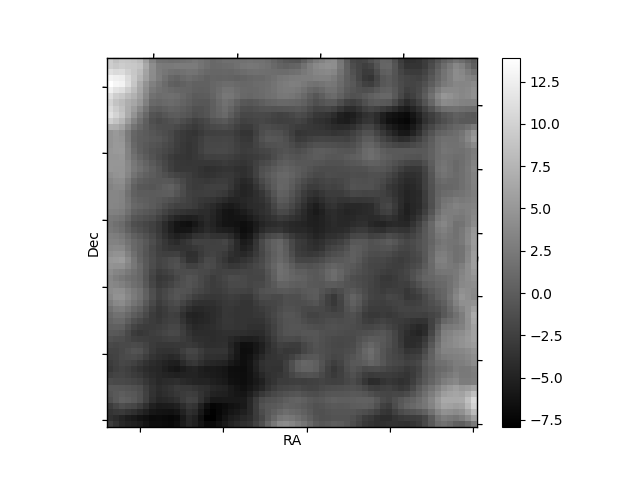
Histogram calculated using DETX and DETY for each event in the final _common_clean file
| Quadrant A | 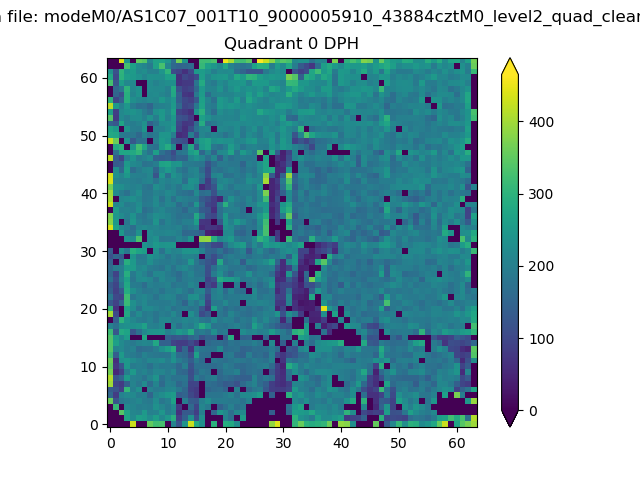 |
 |
Quadrant B |
|---|---|---|---|
| Quadrant D |  |
 |
Quadrant C |
| Plot type | Count rate plots | Images |
|---|---|---|
| Comparison with Poisson distribution Blue bars denote a histogram of data divided into 1 sec bins. Red curve is a Poisson curve with rate = median count rate of data. |
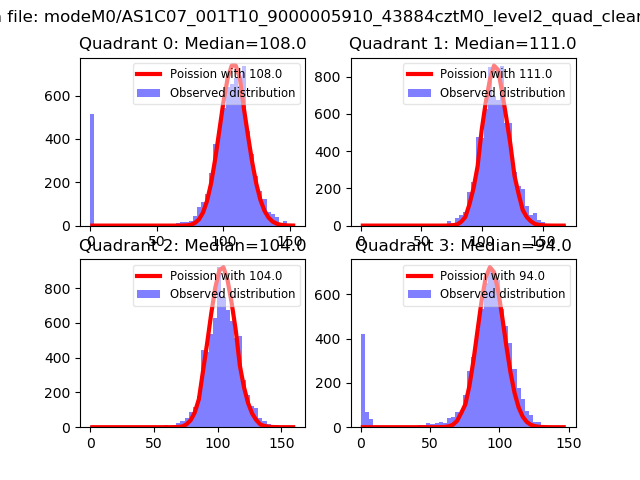 |
 |
| Quadrant-wise count rates Data is divided into 100 sec bins |
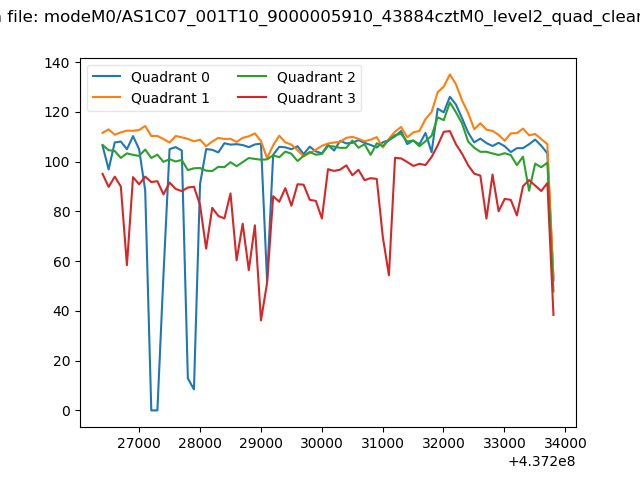 |
|
| Module-wise count rates for Quadrant A Data is divided into 100 sec bins |
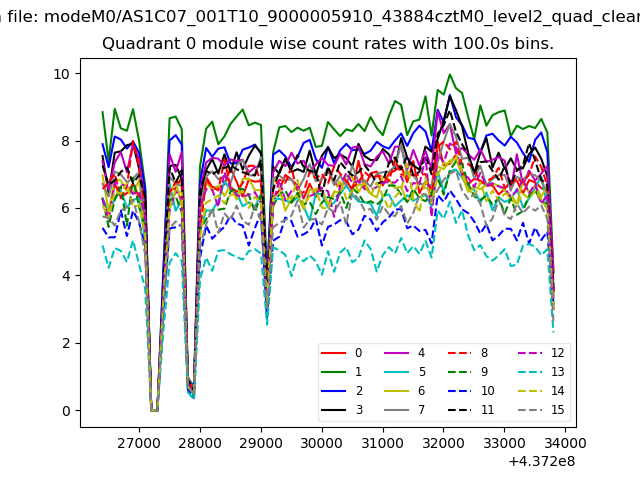 |
 |
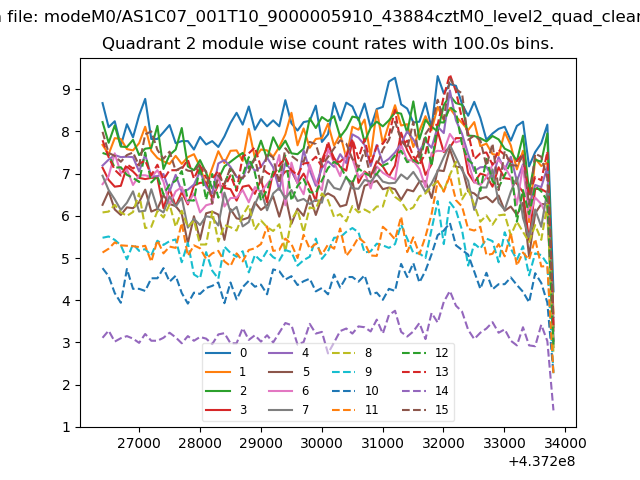
| Module-wise count rates for Quadrant B Data is divided into 100 sec bins |
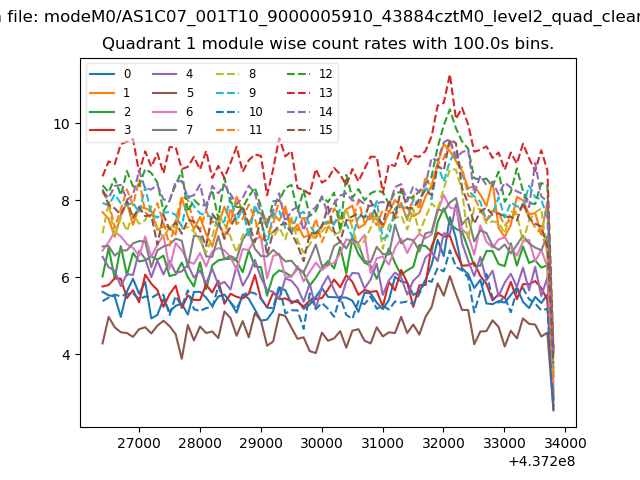 |
 |
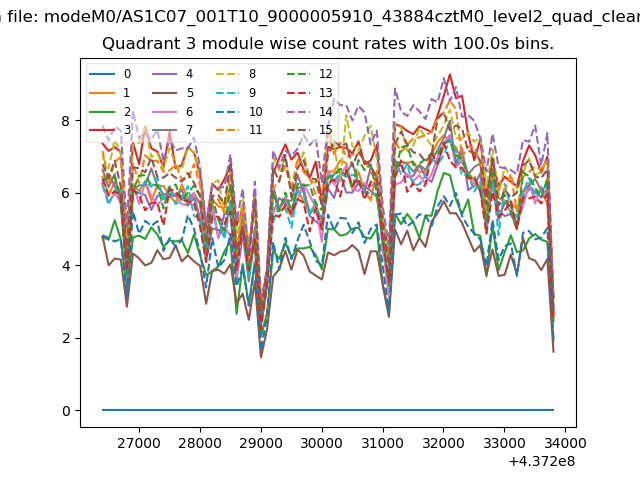
| Module-wise count rates for Quadrant C Data is divided into 100 sec bins |
 |
 |
| Module-wise count rates for Quadrant D Data is divided into 100 sec bins |
 |
 |
| Parameter | Plot |
|---|---|
| CZT HV Monitor | 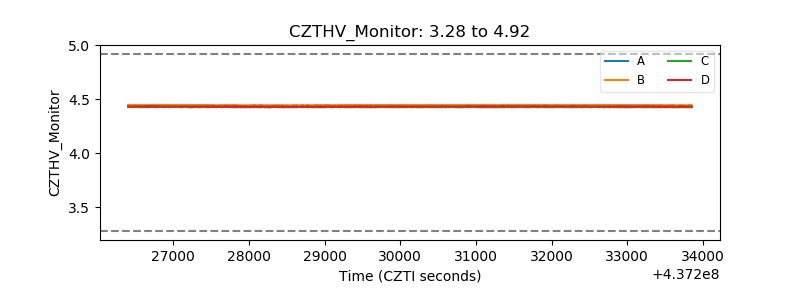 |
| D_VDD | 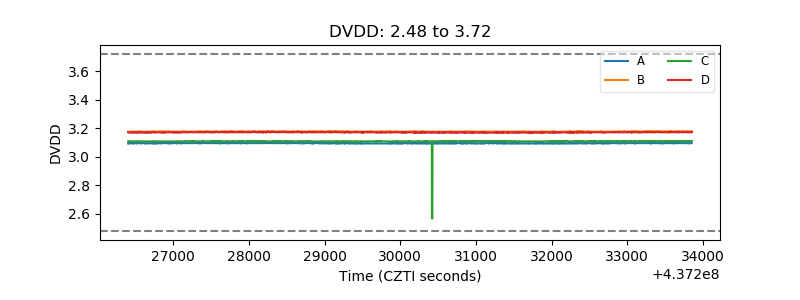 |
| Temperature 1 | 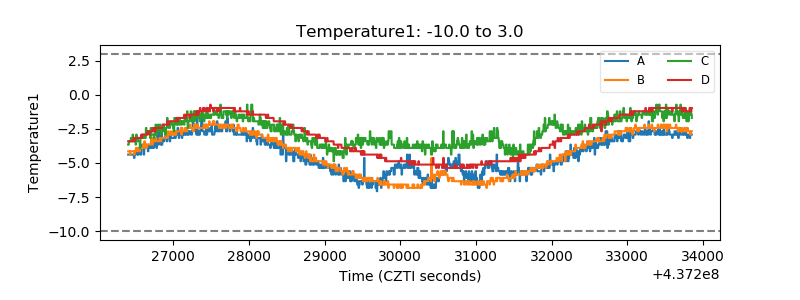 |
| Veto HV Monitor | 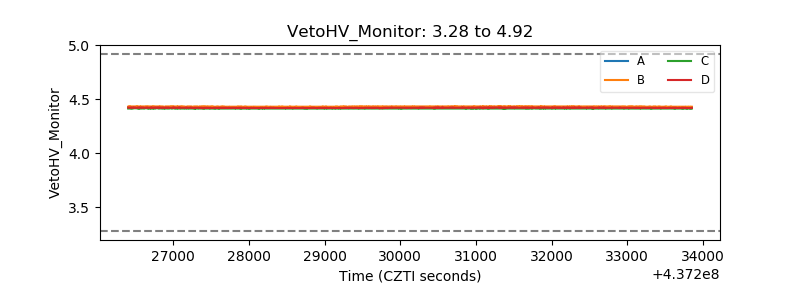 |
| Veto LLD | 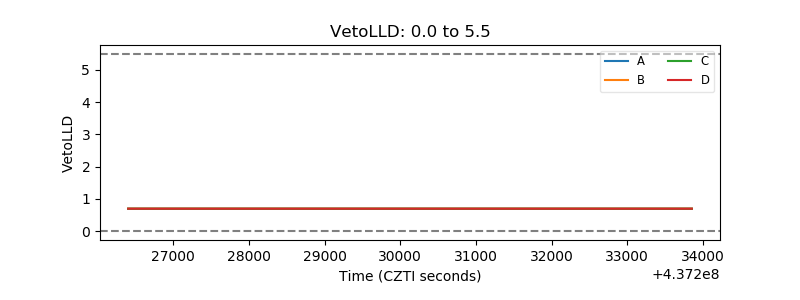 |
| Alpha Counter | 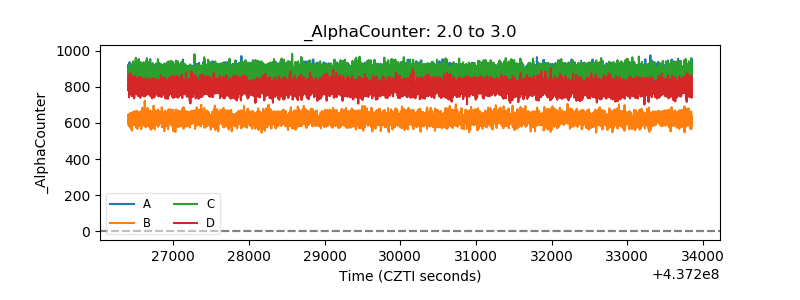 |
| _CPM_Rate | 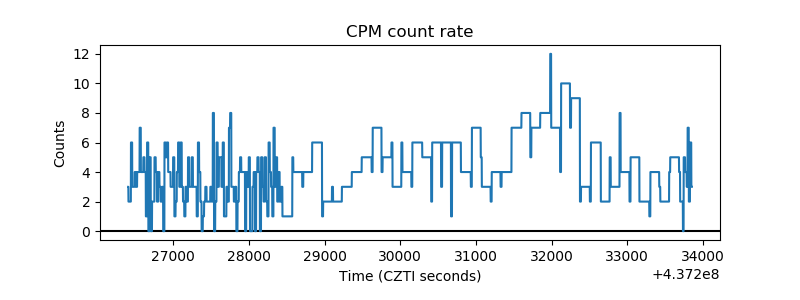 |
| CZT Counter | 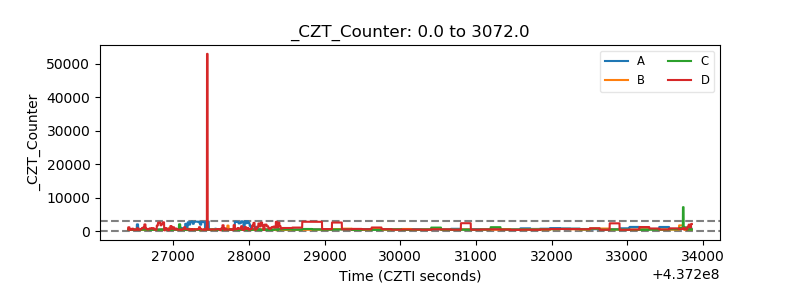 |
| +2.5 Volts monitor | 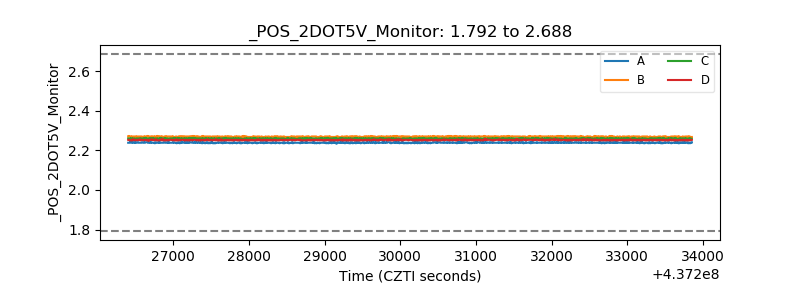 |
| +5 Volts monitor | 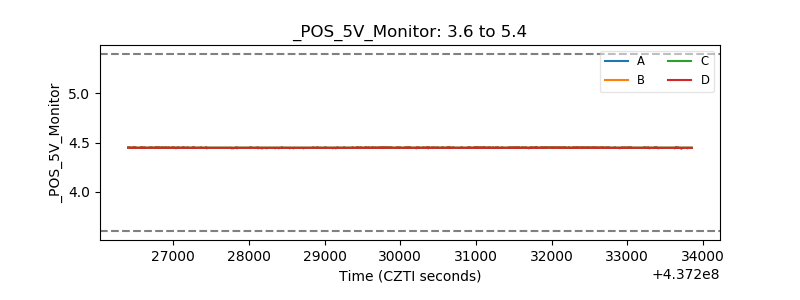 |
| _ROLL_ROT | 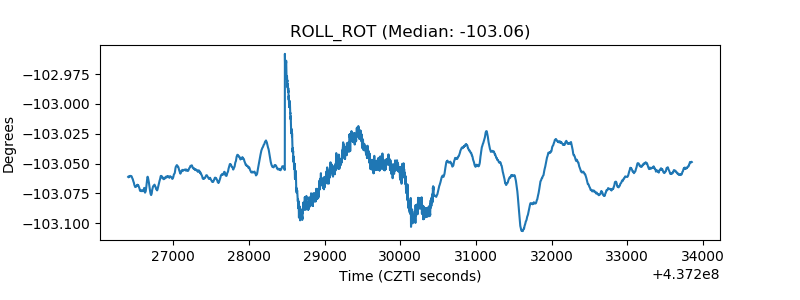 |
| _Roll_DEC | 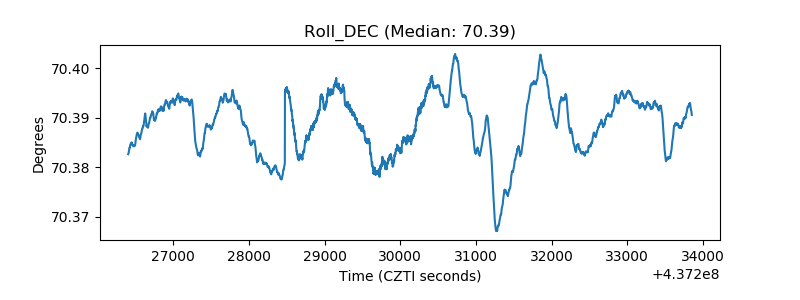 |
| _Roll_RA | 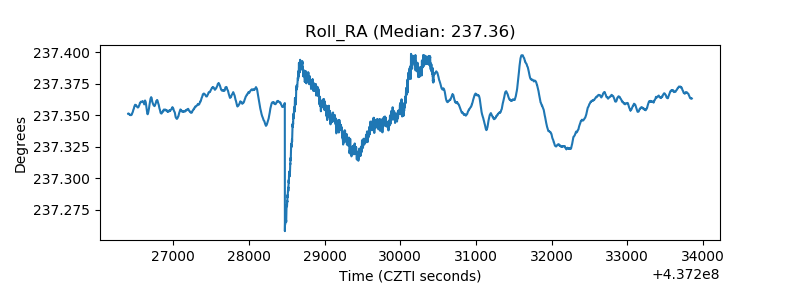 |
| Veto Counter | 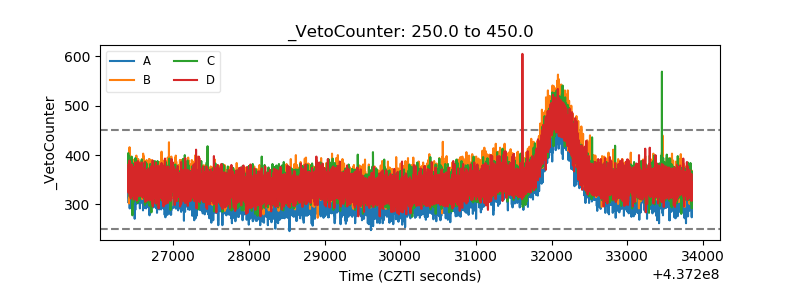 |