| Param | Original file | Final file |
|---|---|---|
| Filename | modeM0/AS1C07_001T10_9000005910_43885cztM0_level2.fits | modeM0/AS1C07_001T10_9000005910_43885cztM0_level2_quad_clean.evt |
| Size (bytes) | 590,238,720 | 118,601,280 |
| Size | 562.9 MB | 113.1 MB |
| Events in quadrant A | 6,037,782 | 797,759 |
| Events in quadrant B | 4,431,403 | 818,270 |
| Events in quadrant C | 4,656,711 | 776,121 |
| Events in quadrant D | 6,136,100 | 672,326 |
| Mode M0 | |||
|---|---|---|---|
| Quadrant | BADHDUFLAG | Total packets | Discarded packets |
| A | 0 | 23408 | 0 |
| B | 0 | 18504 | 0 |
| C | 0 | 19314 | 0 |
| D | 0 | 23436 | 0 |
| Mode SS | |||
|---|---|---|---|
| Quadrant | BADHDUFLAG | Total packets | Discarded packets |
| A | 0 | 150 | 0 |
| B | 0 | 150 | 0 |
| C | 0 | 150 | 0 |
| D | 0 | 150 | 0 |
| Quadrant | Total seconds | Saturated seconds | Saturation percentage |
|---|---|---|---|
| A | 7571 | 171 | 2.258618% |
| B | 7571 | 217 | 2.866200% |
| C | 7571 | 187 | 2.469951% |
| D | 7571 | 656 | 8.664641% |
Noise dominated data is calculated using 1-second bins in cleaned event files. If a bin has >2000 counts, and if more than 50% of those come from <1% of pixels, then it is considered to be noise-dominated and hence unusable.
| Quadrant | # 1 sec bins | Bins with >0 counts | Bins with >2000 counts | High rate bins dominated by noise | Noise dominated (total time) | Noise dominated (detector-on time) | Marked lightcurve |
|---|---|---|---|---|---|---|---|
| A | 7571 | 7571 | 121 | 121 | 1.60% | 1.60% | 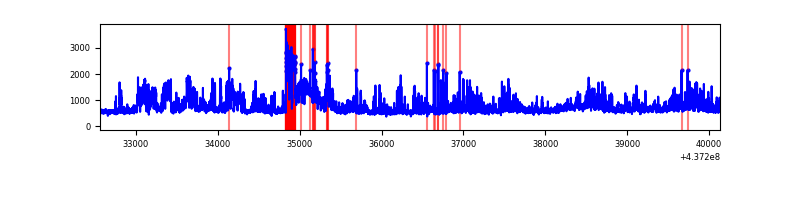 |
| B | 7571 | 7571 | 188 | 188 | 2.48% | 2.48% | 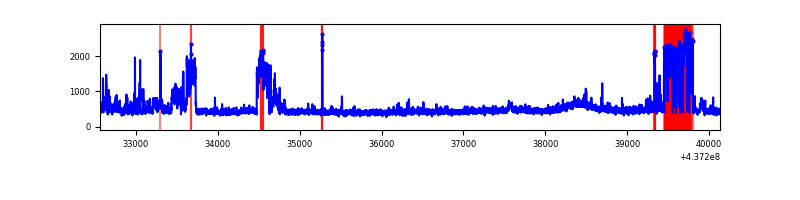 |
| C | 7571 | 7571 | 187 | 187 | 2.47% | 2.47% | 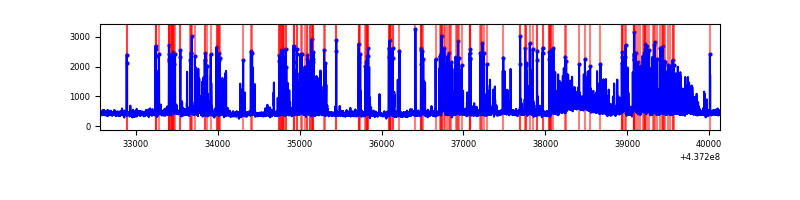 |
| D | 7571 | 7571 | 603 | 603 | 7.96% | 7.96% | 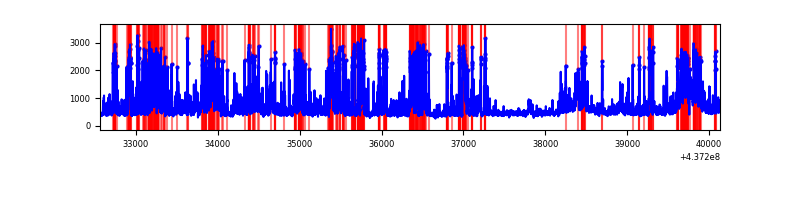 |
Top three noisy pixels from each quadrant. If the there are fewer than three noisy pixels in the level2.evt file, extra rows are filled as -1
| Pixel properties | Quadrant properties | ||||||
|---|---|---|---|---|---|---|---|
| Quadrant | DetID | PixID | Counts | Sigma | Mean | Median | Sigma |
| A | 15 | 222 | 1258424 | 7468.36 | 817 | 799 | 168.4 |
| A | 10 | 83 | 1031319 | 6119.7 | 817 | 799 | 168.4 |
| A | 15 | 223 | 360887 | 2138.37 | 817 | 799 | 168.4 |
| B | 7 | 205 | 1019826 | 6397.06 | 814 | 789 | 159.3 |
| B | 0 | 213 | 49781 | 307.55 | 814 | 789 | 159.3 |
| B | 0 | 183 | 31769 | 194.48 | 814 | 789 | 159.3 |
| C | 15 | 158 | 1171832 | 6183.93 | 796 | 798 | 189.4 |
| C | 3 | 233 | 113430 | 594.78 | 796 | 798 | 189.4 |
| C | 15 | 157 | 100340 | 525.66 | 796 | 798 | 189.4 |
| D | 12 | 233 | 784515 | 4015.16 | 781 | 758 | 195.2 |
| D | 13 | 171 | 768351 | 3932.35 | 781 | 758 | 195.2 |
| D | 1 | 52 | 500529 | 2560.31 | 781 | 758 | 195.2 |
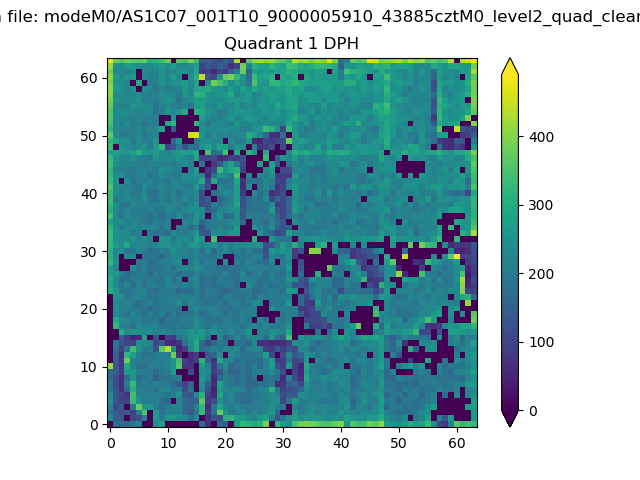
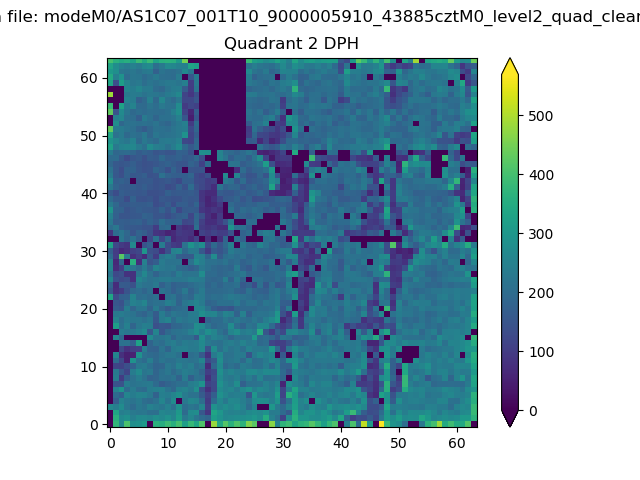
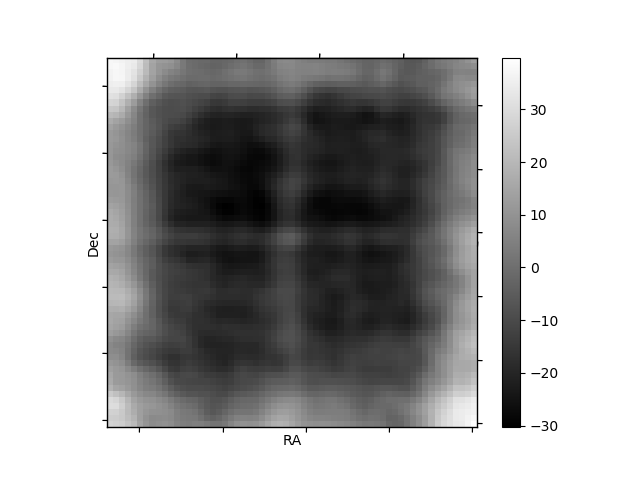
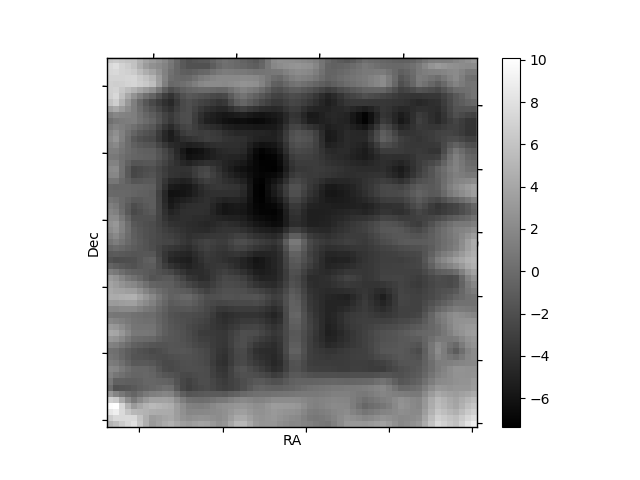
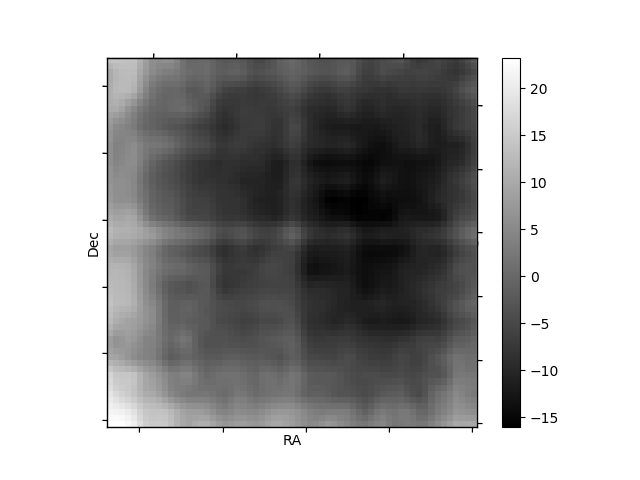
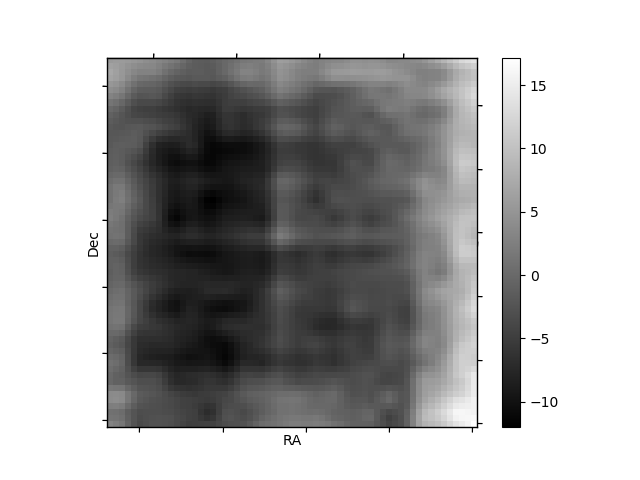
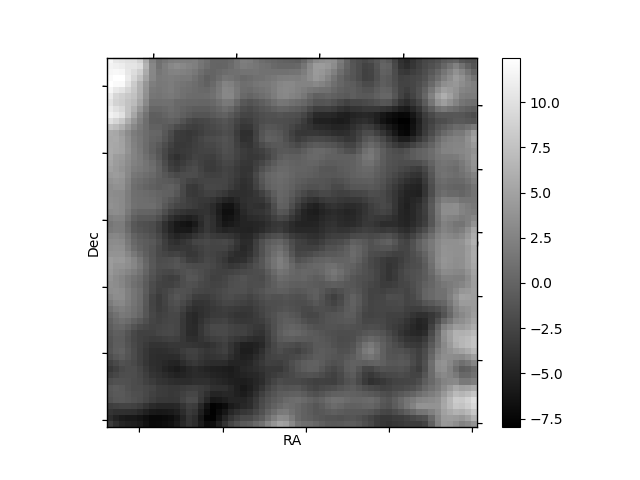
Histogram calculated using DETX and DETY for each event in the final _common_clean file
| Quadrant A |  |
 |
Quadrant B |
|---|---|---|---|
| Quadrant D | 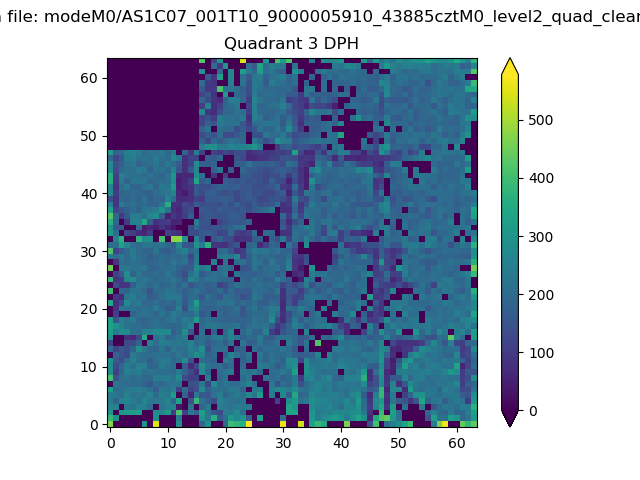 |
 |
Quadrant C |
| Plot type | Count rate plots | Images |
|---|---|---|
| Comparison with Poisson distribution Blue bars denote a histogram of data divided into 1 sec bins. Red curve is a Poisson curve with rate = median count rate of data. |
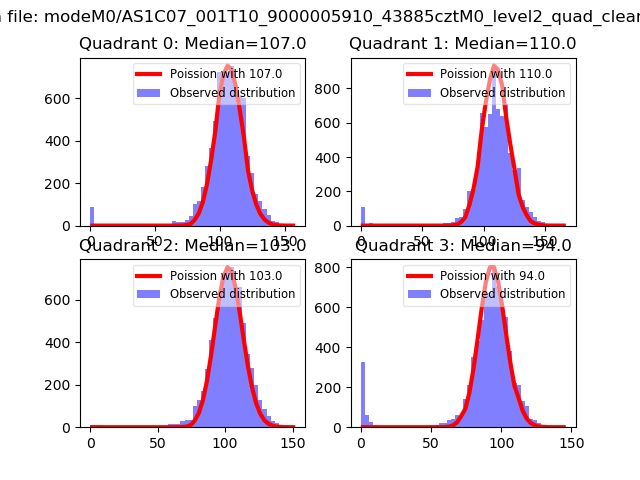 |
 |
| Quadrant-wise count rates Data is divided into 100 sec bins |
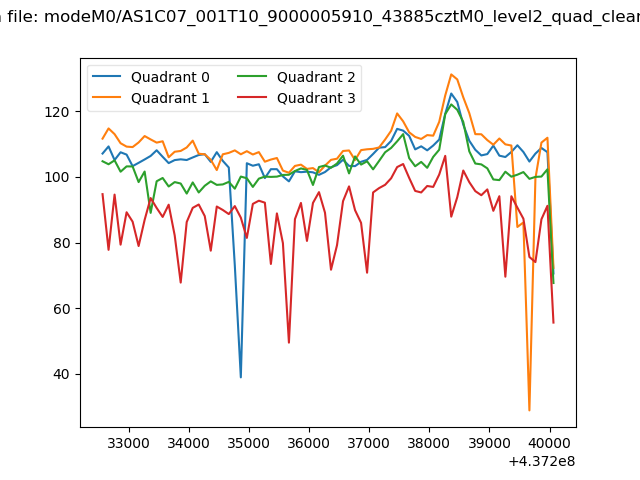 |
|
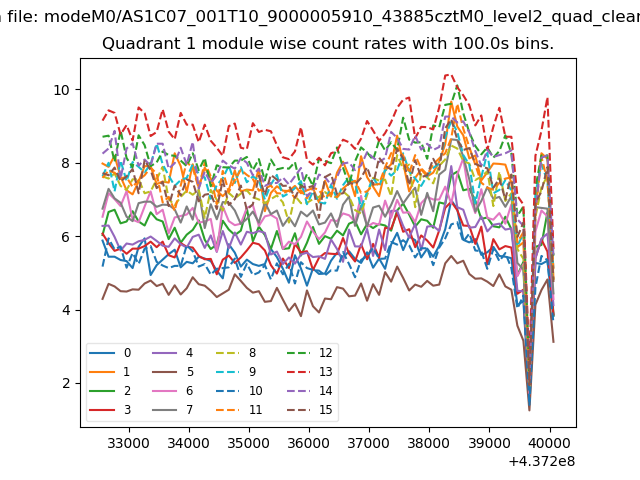
| Module-wise count rates for Quadrant A Data is divided into 100 sec bins |
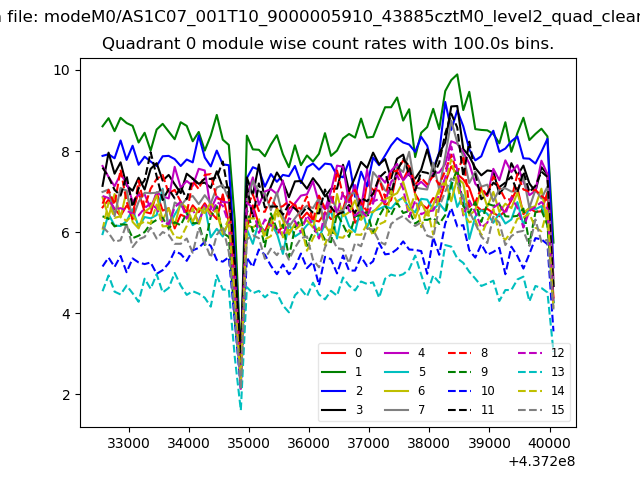 |
 |
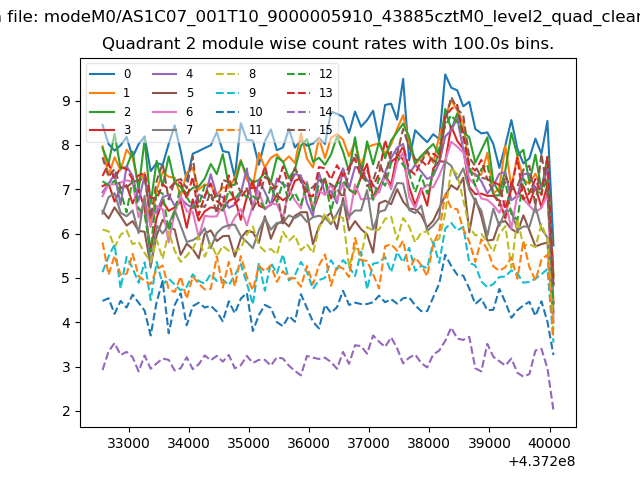
| Module-wise count rates for Quadrant B Data is divided into 100 sec bins |
 |
 |
| Module-wise count rates for Quadrant C Data is divided into 100 sec bins |
 |
 |
| Module-wise count rates for Quadrant D Data is divided into 100 sec bins |
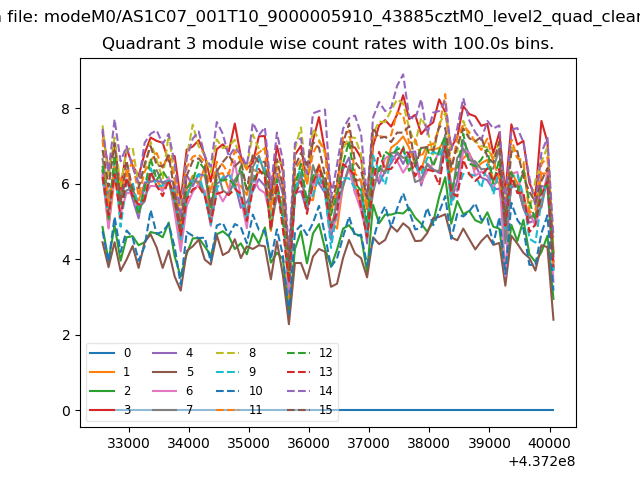 |
 |
| Parameter | Plot |
|---|---|
| CZT HV Monitor |  |
| D_VDD | 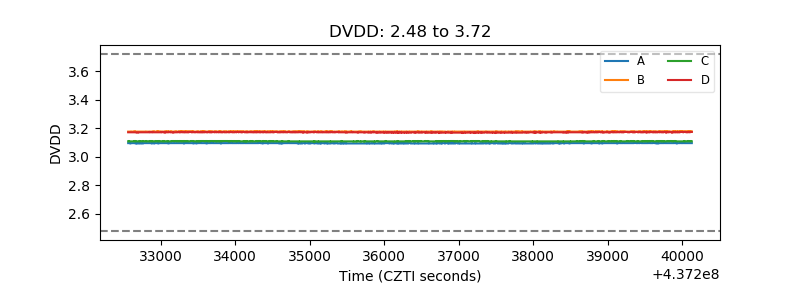 |
| Temperature 1 | 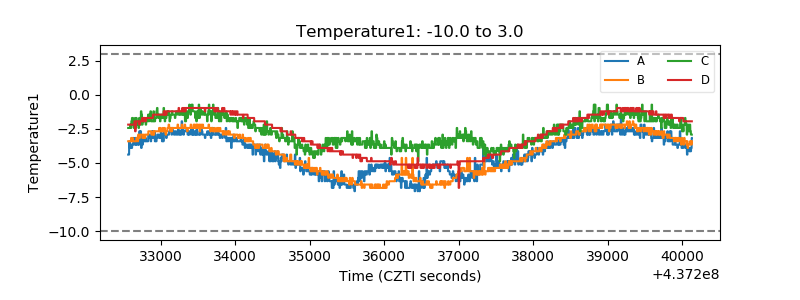 |
| Veto HV Monitor | 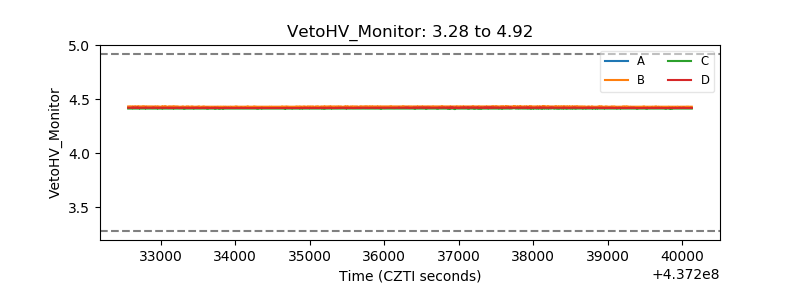 |
| Veto LLD | 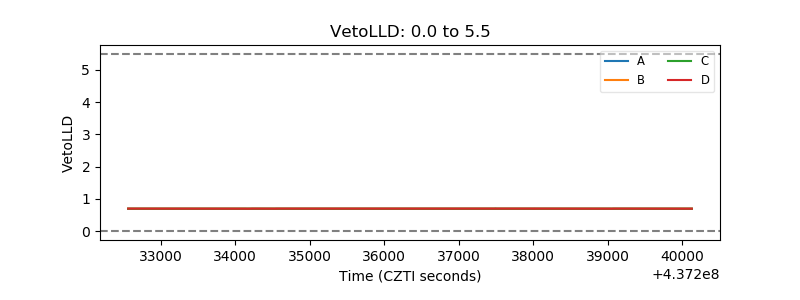 |
| Alpha Counter | 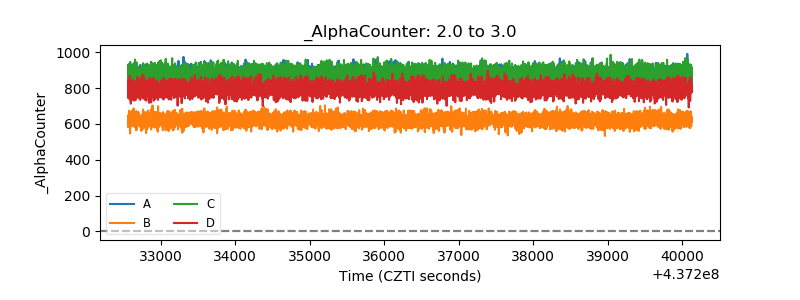 |
| _CPM_Rate | 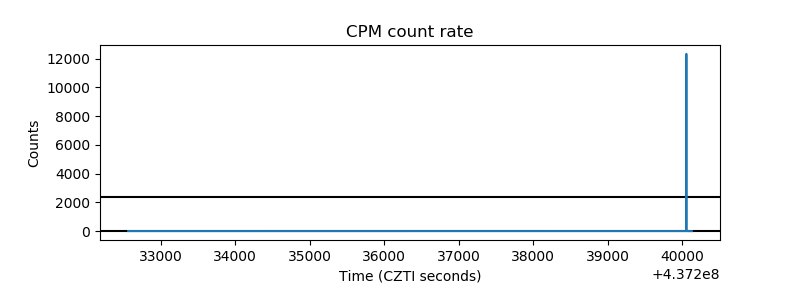 |
| CZT Counter | 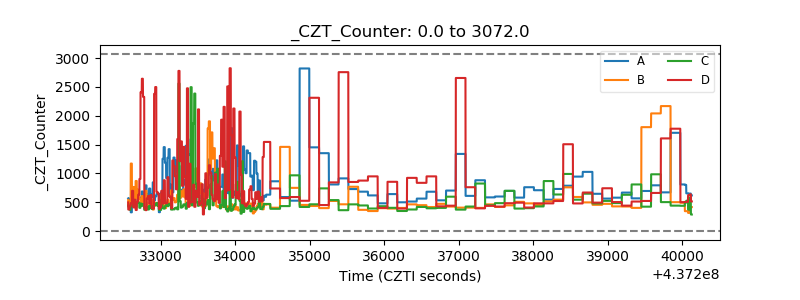 |
| +2.5 Volts monitor | 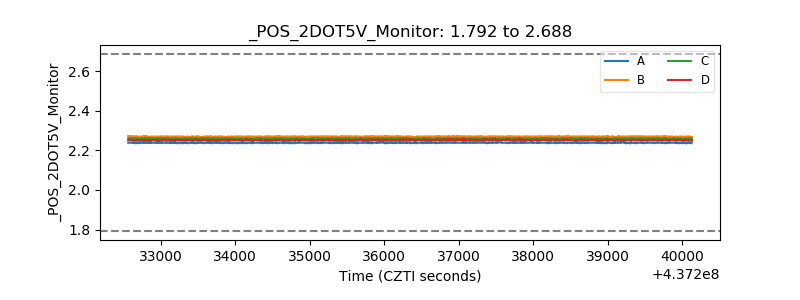 |
| +5 Volts monitor | 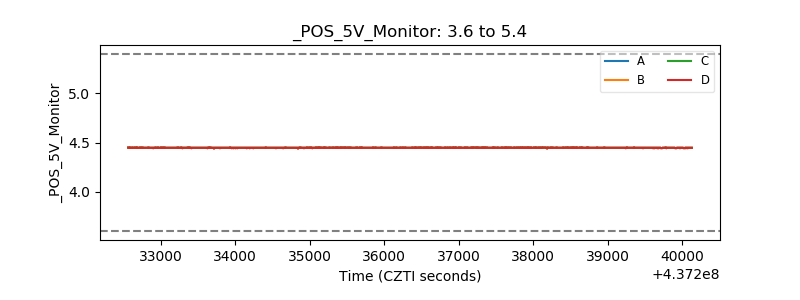 |
| _ROLL_ROT | 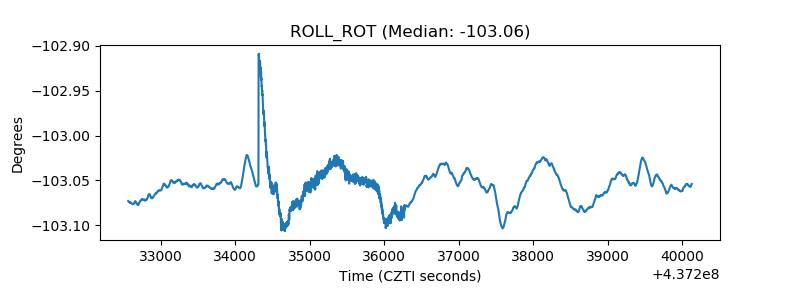 |
| _Roll_DEC | 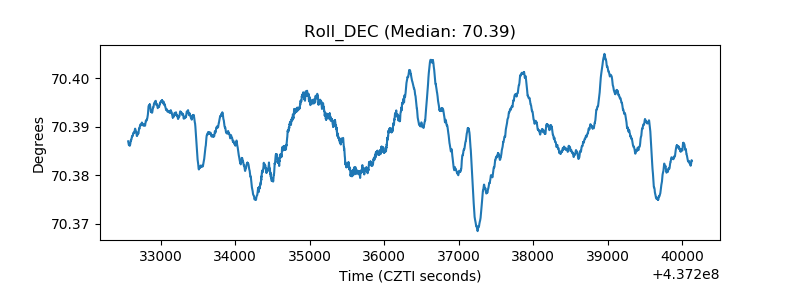 |
| _Roll_RA | 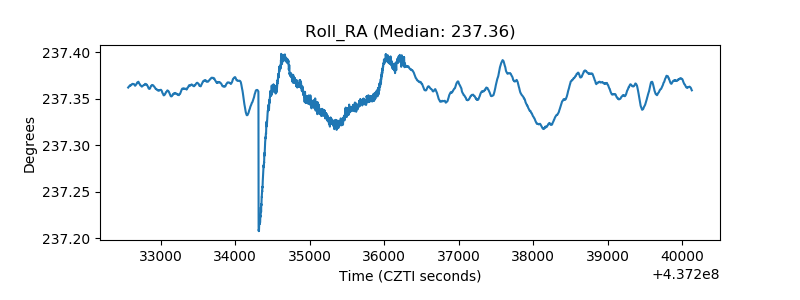 |
| Veto Counter | 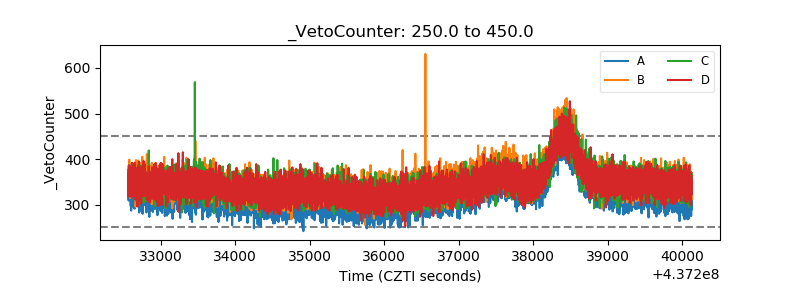 |