| Param | Original file | Final file |
|---|---|---|
| Filename | modeM0/AS1C07_001T10_9000005910_43888cztM0_level2.fits | modeM0/AS1C07_001T10_9000005910_43888cztM0_level2_quad_clean.evt |
| Size (bytes) | 1,415,289,600 | 297,581,760 |
| Size | 1.3 GB | 283.8 MB |
| Events in quadrant A | 15,095,891 | 1,990,773 |
| Events in quadrant B | 10,038,448 | 2,053,652 |
| Events in quadrant C | 11,587,747 | 1,951,947 |
| Events in quadrant D | 14,176,728 | 1,684,572 |
| Mode M9 | |||
|---|---|---|---|
| Quadrant | BADHDUFLAG | Total packets | Discarded packets |
| A | 0 | 12 | 0 |
| B | 0 | 12 | 0 |
| C | 0 | 12 | 0 |
| D | 0 | 12 | 0 |
| Mode M0 | |||
|---|---|---|---|
| Quadrant | BADHDUFLAG | Total packets | Discarded packets |
| A | 0 | 58578 | 3 |
| B | 0 | 43423 | 3 |
| C | 0 | 47876 | 3 |
| D | 0 | 55797 | 3 |
| Mode SS | |||
|---|---|---|---|
| Quadrant | BADHDUFLAG | Total packets | Discarded packets |
| A | 0 | 390 | 0 |
| B | 0 | 390 | 0 |
| C | 0 | 390 | 0 |
| D | 0 | 390 | 0 |
| Quadrant | Total seconds | Saturated seconds | Saturation percentage |
|---|---|---|---|
| A | 19285 | 753 | 3.904589% |
| B | 19285 | 519 | 2.691211% |
| C | 19285 | 612 | 3.173451% |
| D | 19285 | 1502 | 7.788437% |
Noise dominated data is calculated using 1-second bins in cleaned event files. If a bin has >2000 counts, and if more than 50% of those come from <1% of pixels, then it is considered to be noise-dominated and hence unusable.
| Quadrant | # 1 sec bins | Bins with >0 counts | Bins with >2000 counts | High rate bins dominated by noise | Noise dominated (total time) | Noise dominated (detector-on time) | Marked lightcurve |
|---|---|---|---|---|---|---|---|
| A | 20375 | 19289 | 429 | 429 | 2.11% | 2.22% | 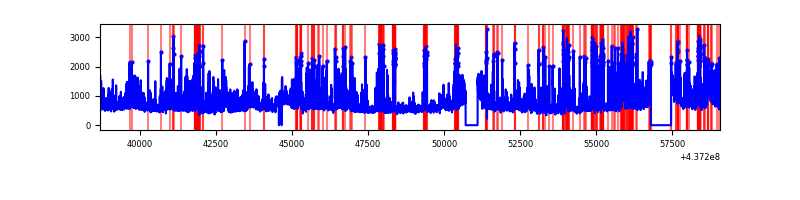 |
| B | 20375 | 19289 | 284 | 284 | 1.39% | 1.47% | 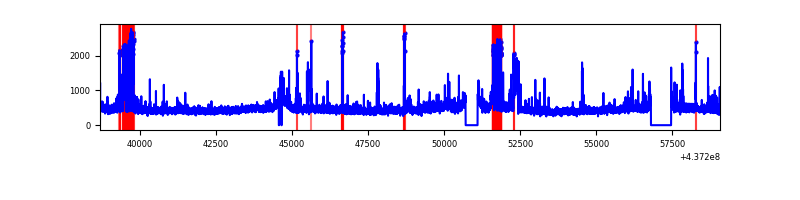 |
| C | 20375 | 19289 | 481 | 481 | 2.36% | 2.49% | 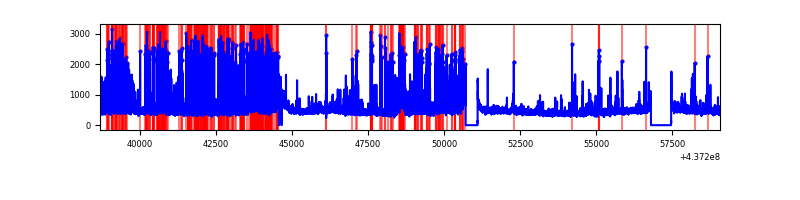 |
| D | 20375 | 19289 | 1148 | 1148 | 5.63% | 5.95% | 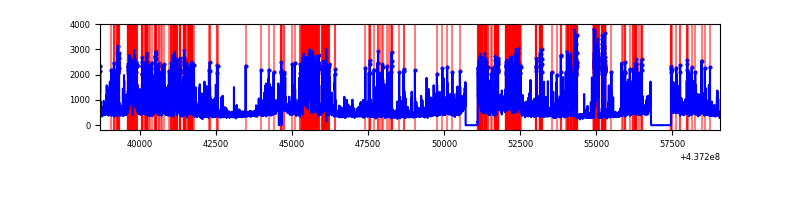 |
Top three noisy pixels from each quadrant. If the there are fewer than three noisy pixels in the level2.evt file, extra rows are filled as -1
| Pixel properties | Quadrant properties | ||||||
|---|---|---|---|---|---|---|---|
| Quadrant | DetID | PixID | Counts | Sigma | Mean | Median | Sigma |
| A | 10 | 83 | 2785508 | 6498.78 | 2085 | 2039 | 428.3 |
| A | 15 | 222 | 2242986 | 5232.11 | 2085 | 2039 | 428.3 |
| A | 15 | 223 | 1610428 | 3755.23 | 2085 | 2039 | 428.3 |
| B | 7 | 205 | 1114662 | 2718.73 | 2097 | 2034 | 409.2 |
| B | 0 | 213 | 108346 | 259.78 | 2097 | 2034 | 409.2 |
| B | 4 | 170 | 89648 | 214.09 | 2097 | 2034 | 409.2 |
| C | 15 | 158 | 2398573 | 5007.36 | 2051 | 2059 | 478.6 |
| C | 3 | 233 | 777143 | 1619.49 | 2051 | 2059 | 478.6 |
| C | 14 | 254 | 226408 | 468.76 | 2051 | 2059 | 478.6 |
| D | 13 | 171 | 1304675 | 2575.42 | 2005 | 1944 | 505.8 |
| D | 7 | 80 | 1183887 | 2336.63 | 2005 | 1944 | 505.8 |
| D | 13 | 187 | 797497 | 1572.76 | 2005 | 1944 | 505.8 |
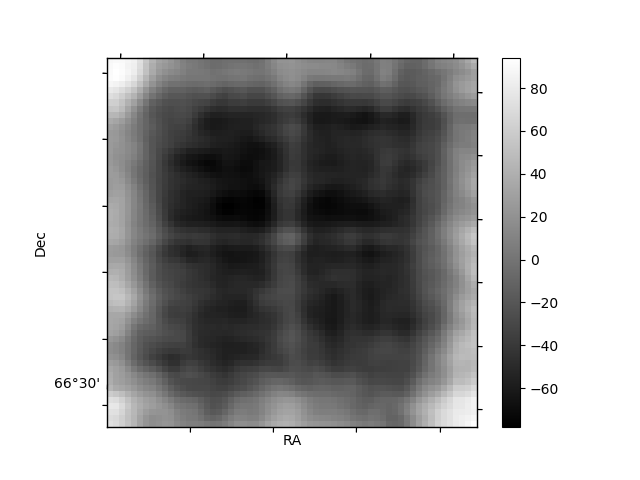
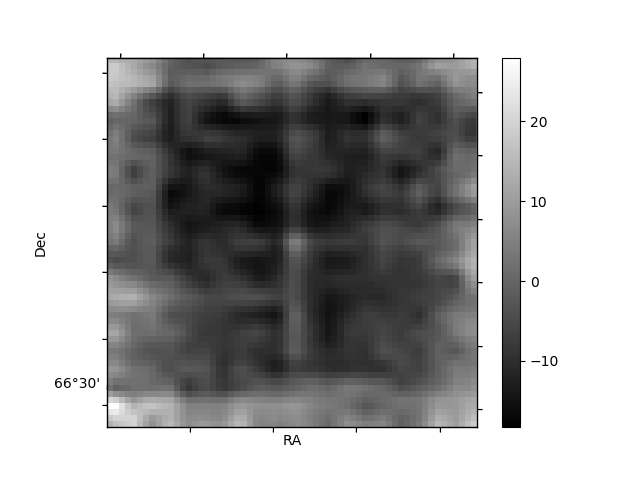
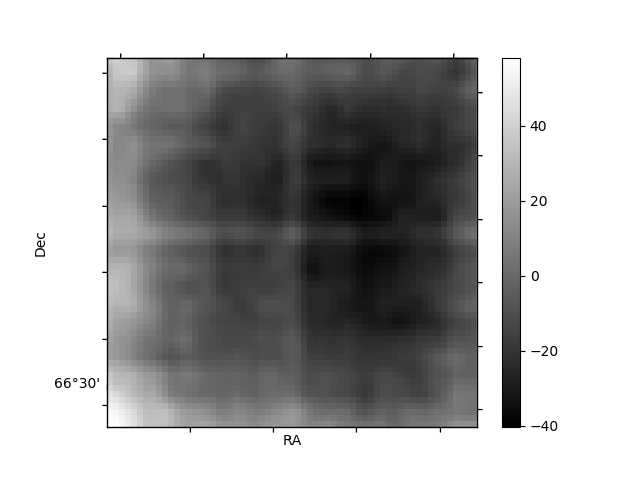
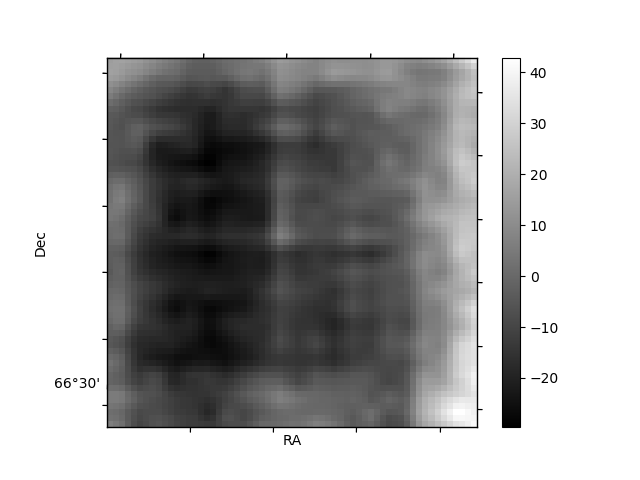
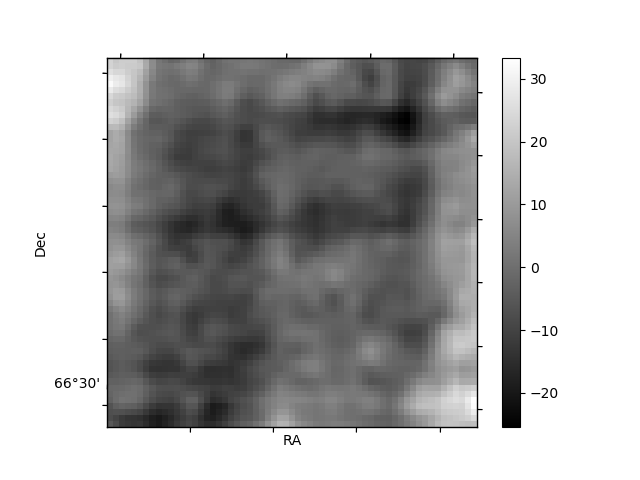
Histogram calculated using DETX and DETY for each event in the final _common_clean file
| Quadrant A | 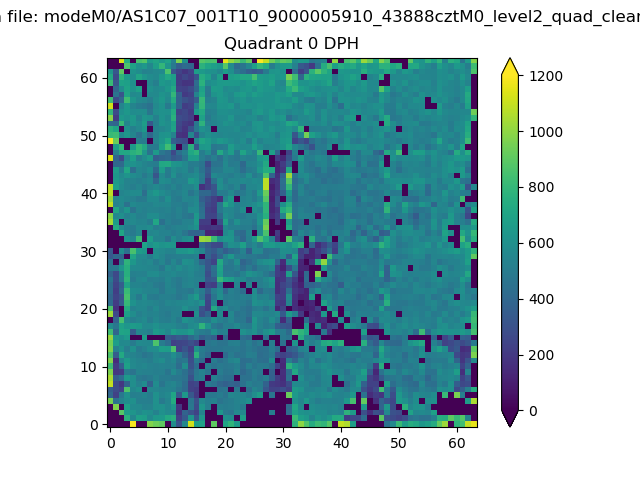 |
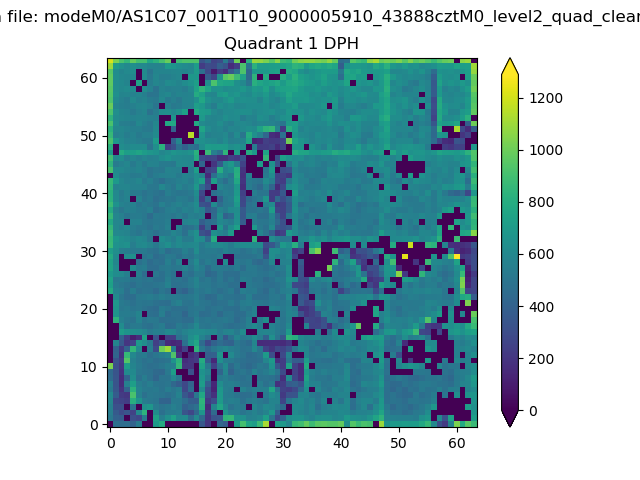 |
Quadrant B |
|---|---|---|---|
| Quadrant D | 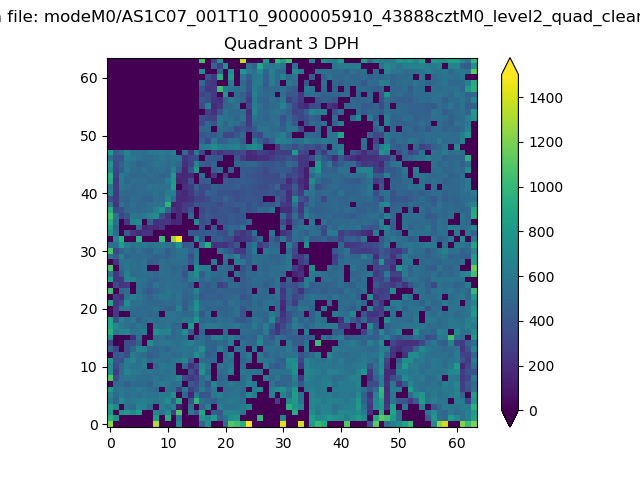 |
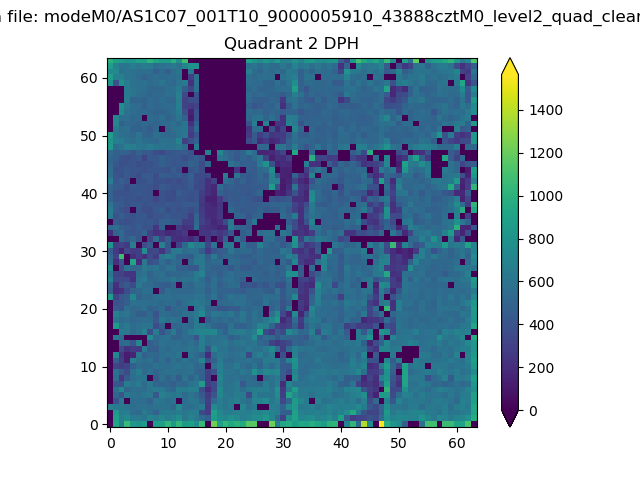 |
Quadrant C |
| Plot type | Count rate plots | Images |
|---|---|---|
| Comparison with Poisson distribution Blue bars denote a histogram of data divided into 1 sec bins. Red curve is a Poisson curve with rate = median count rate of data. |
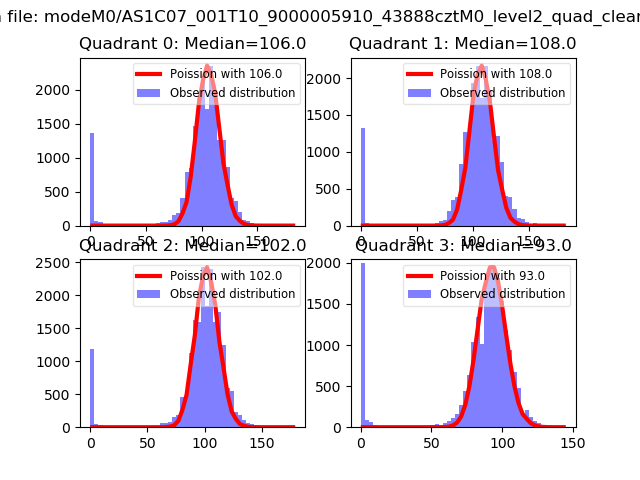 |
 |
| Quadrant-wise count rates Data is divided into 100 sec bins |
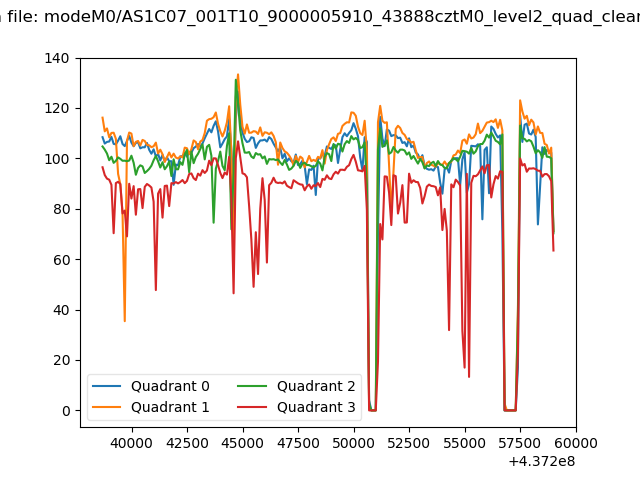 |
|
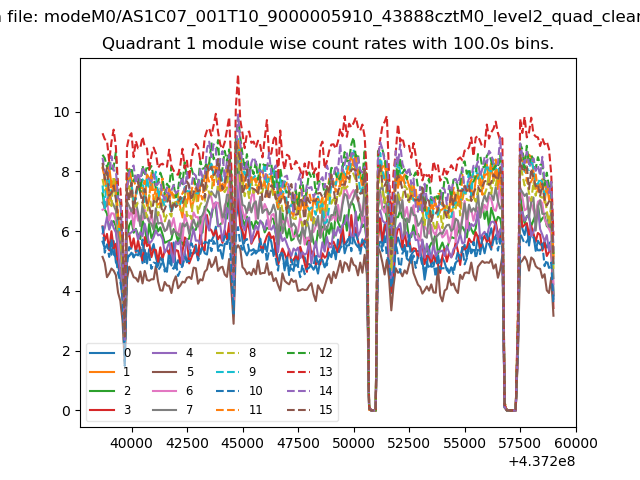
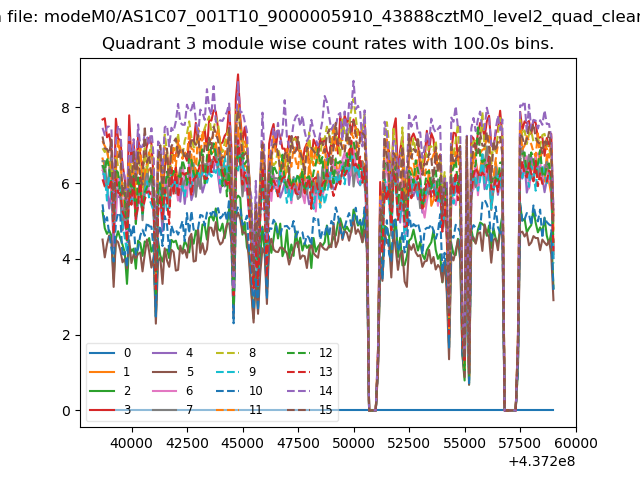
| Module-wise count rates for Quadrant A Data is divided into 100 sec bins |
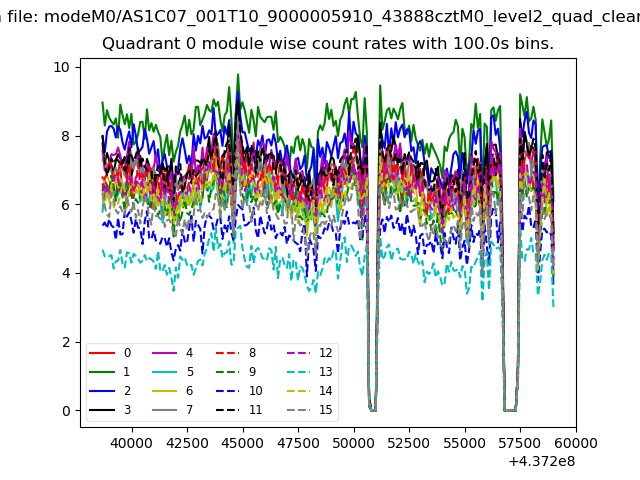 |
 |
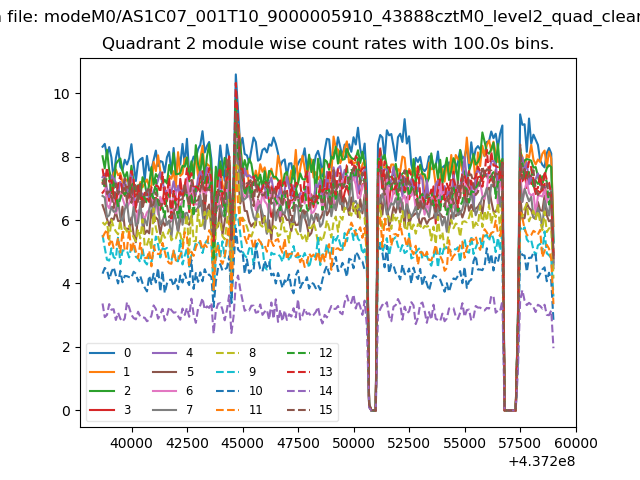
| Module-wise count rates for Quadrant B Data is divided into 100 sec bins |
 |
 |
| Module-wise count rates for Quadrant C Data is divided into 100 sec bins |
 |
 |
| Module-wise count rates for Quadrant D Data is divided into 100 sec bins |
 |
 |
| Parameter | Plot |
|---|---|
| CZT HV Monitor | 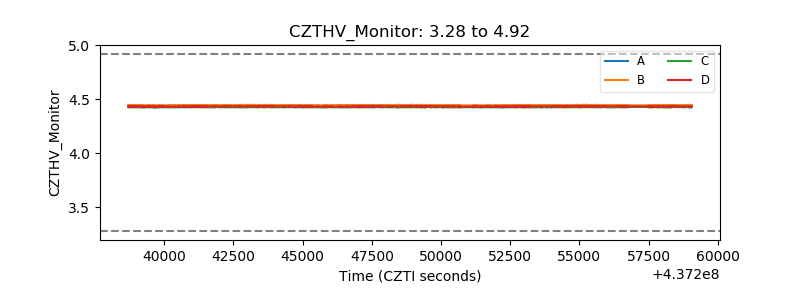 |
| D_VDD | 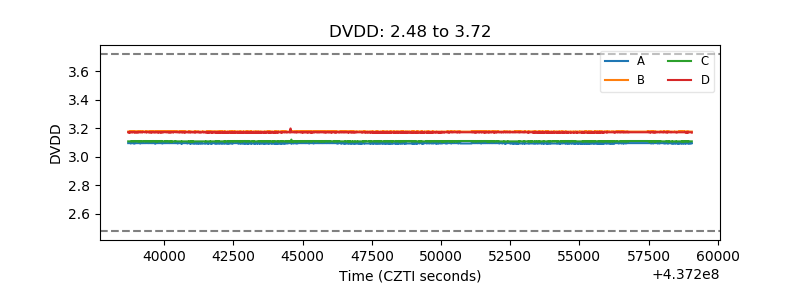 |
| Temperature 1 | 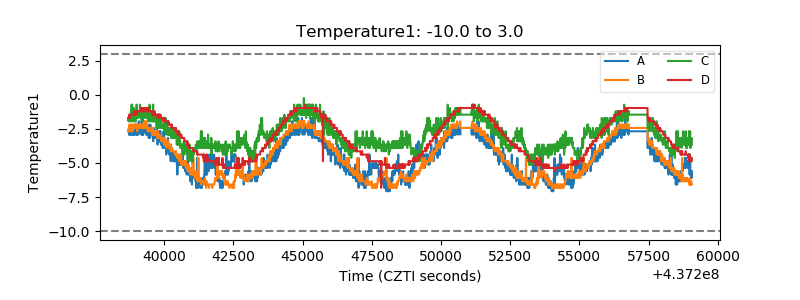 |
| Veto HV Monitor | 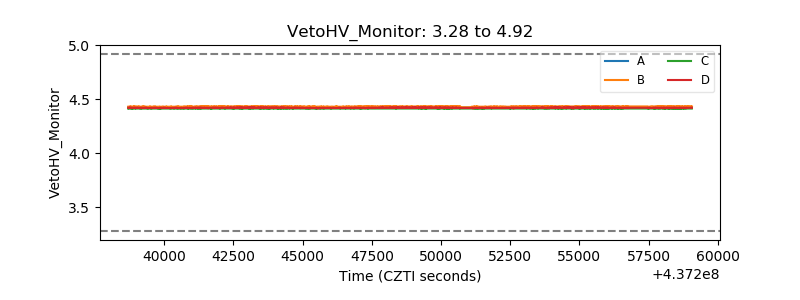 |
| Veto LLD | 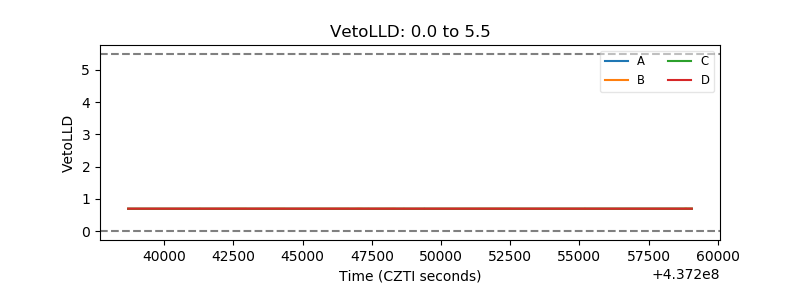 |
| Alpha Counter | 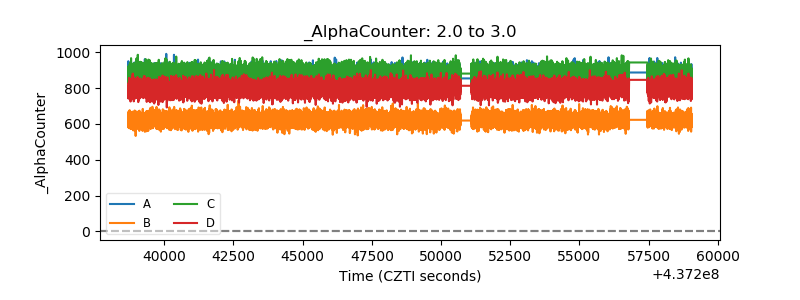 |
| _CPM_Rate | 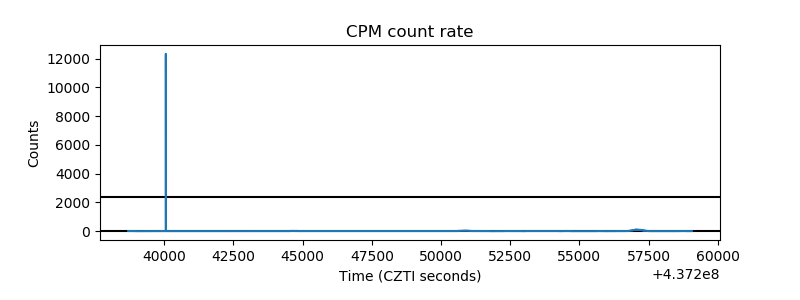 |
| CZT Counter |  |
| +2.5 Volts monitor | 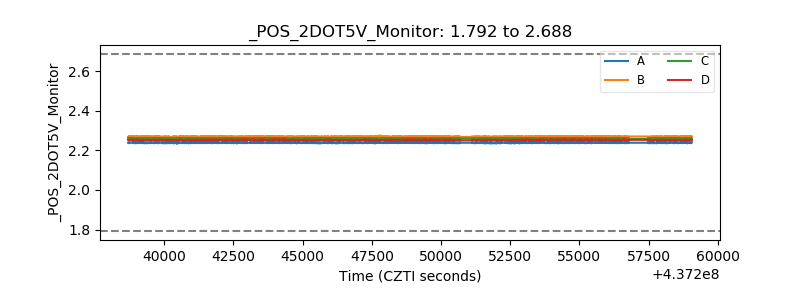 |
| +5 Volts monitor | 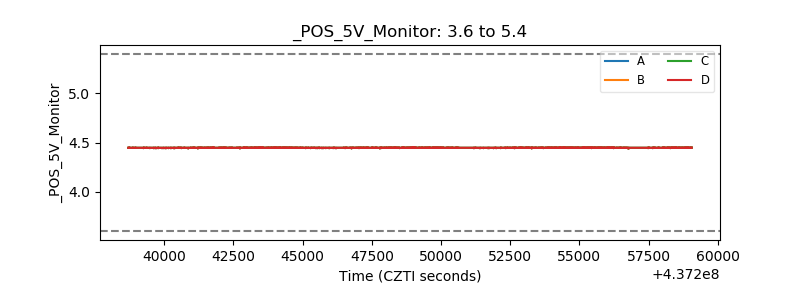 |
| _ROLL_ROT | 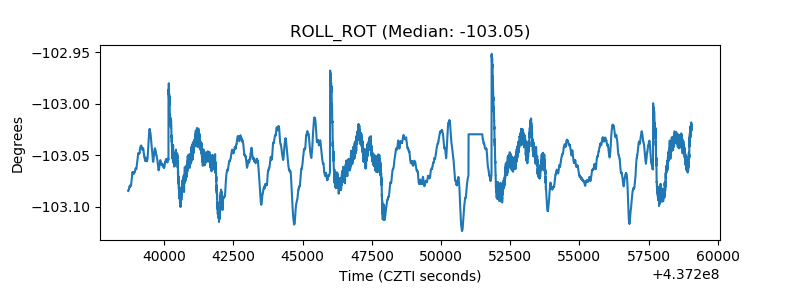 |
| _Roll_DEC | 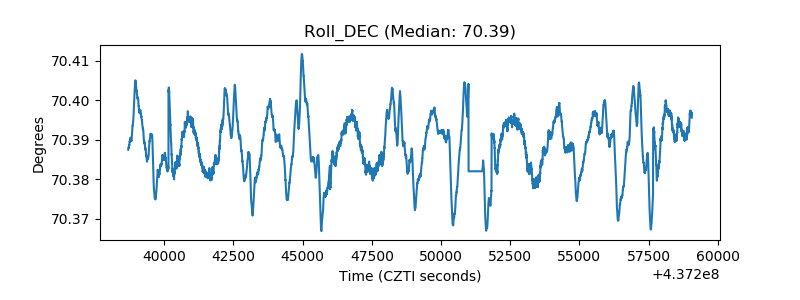 |
| _Roll_RA | 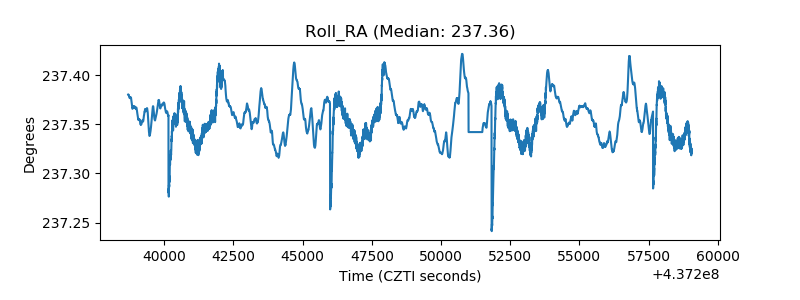 |
| Veto Counter | 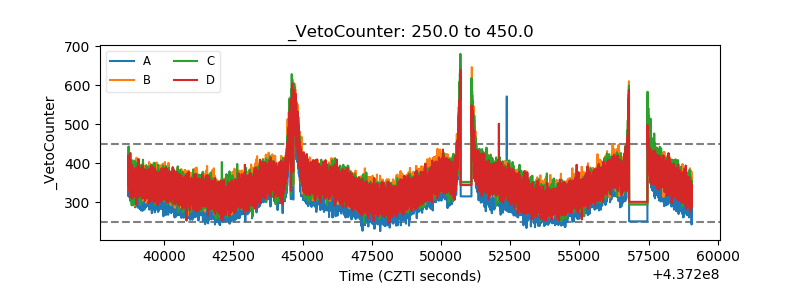 |