| Param | Original file | Final file |
|---|---|---|
| Filename | modeM0/AS1C07_001T10_9000005910_43889cztM0_level2.fits | modeM0/AS1C07_001T10_9000005910_43889cztM0_level2_quad_clean.evt |
| Size (bytes) | 211,795,200 | 46,031,040 |
| Size | 202.0 MB | 43.9 MB |
| Events in quadrant A | 2,970,828 | 292,128 |
| Events in quadrant B | 1,368,743 | 314,698 |
| Events in quadrant C | 1,390,922 | 301,417 |
| Events in quadrant D | 1,878,632 | 275,588 |
| Mode M9 | |||
|---|---|---|---|
| Quadrant | BADHDUFLAG | Total packets | Discarded packets |
| A | 1 | 139740967749672 | 139736760975406 |
| B | 1 | -1 | -1 |
| C | 1 | -1 | -1 |
| D | 1 | -1 | -1 |
| Mode M0 | |||
|---|---|---|---|
| Quadrant | BADHDUFLAG | Total packets | Discarded packets |
| A | 0 | 11036 | 1 |
| B | 0 | 6234 | 1 |
| C | 0 | 6230 | 1 |
| D | 0 | 7708 | 1 |
| Mode SS | |||
|---|---|---|---|
| Quadrant | BADHDUFLAG | Total packets | Discarded packets |
| A | 0 | 58 | 0 |
| B | 0 | 58 | 0 |
| C | 0 | 58 | 0 |
| D | 0 | 58 | 0 |
| Quadrant | Total seconds | Saturated seconds | Saturation percentage |
|---|---|---|---|
| A | 2947 | 199 | 6.752630% |
| B | 2947 | 17 | 0.576858% |
| C | 2947 | 8 | 0.271463% |
| D | 2947 | 62 | 2.103834% |
Noise dominated data is calculated using 1-second bins in cleaned event files. If a bin has >2000 counts, and if more than 50% of those come from <1% of pixels, then it is considered to be noise-dominated and hence unusable.
| Quadrant | # 1 sec bins | Bins with >0 counts | Bins with >2000 counts | High rate bins dominated by noise | Noise dominated (total time) | Noise dominated (detector-on time) | Marked lightcurve |
|---|---|---|---|---|---|---|---|
| A | 2947 | 2947 | 186 | 186 | 6.31% | 6.31% | 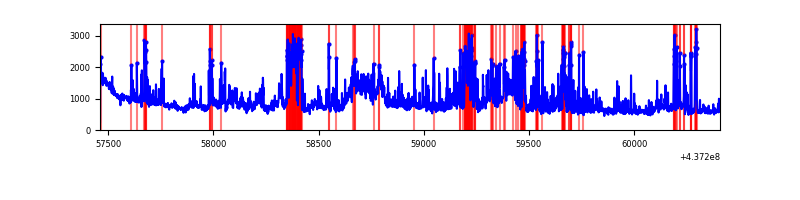 |
| B | 2947 | 2947 | 8 | 8 | 0.27% | 0.27% | 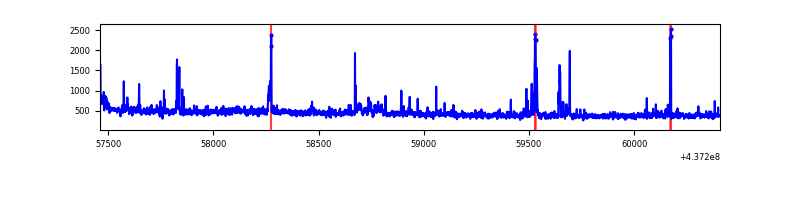 |
| C | 2947 | 2947 | 4 | 4 | 0.14% | 0.14% | 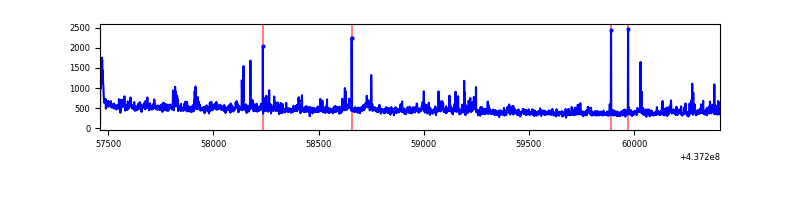 |
| D | 2947 | 2947 | 55 | 55 | 1.87% | 1.87% | 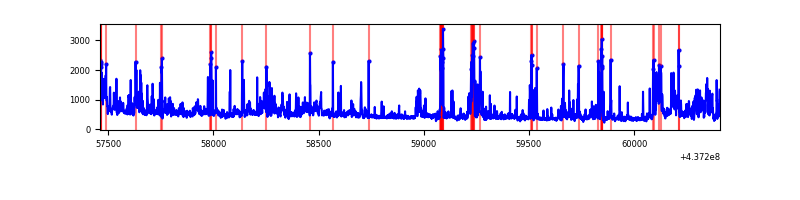 |
Top three noisy pixels from each quadrant. If the there are fewer than three noisy pixels in the level2.evt file, extra rows are filled as -1
| Pixel properties | Quadrant properties | ||||||
|---|---|---|---|---|---|---|---|
| Quadrant | DetID | PixID | Counts | Sigma | Mean | Median | Sigma |
| A | 15 | 223 | 607101 | 9414.26 | 300 | 293 | 64.5 |
| A | 15 | 222 | 538814 | 8354.83 | 300 | 293 | 64.5 |
| A | 10 | 83 | 489370 | 7587.74 | 300 | 293 | 64.5 |
| B | 10 | 245 | 35655 | 561.67 | 311 | 300 | 62.9 |
| B | 4 | 170 | 35286 | 555.8 | 311 | 300 | 62.9 |
| B | 5 | 172 | 21900 | 343.15 | 311 | 300 | 62.9 |
| C | 3 | 233 | 112700 | 1501.8 | 309 | 311 | 74.8 |
| C | 14 | 254 | 37724 | 499.93 | 309 | 311 | 74.8 |
| C | 15 | 174 | 19210 | 252.54 | 309 | 311 | 74.8 |
| D | 12 | 233 | 181248 | 2320.34 | 304 | 294 | 78.0 |
| D | 2 | 249 | 127026 | 1625.06 | 304 | 294 | 78.0 |
| D | 1 | 52 | 98821 | 1263.39 | 304 | 294 | 78.0 |
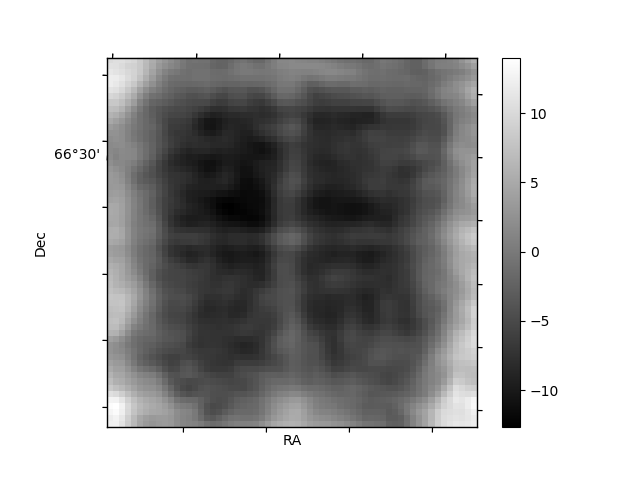
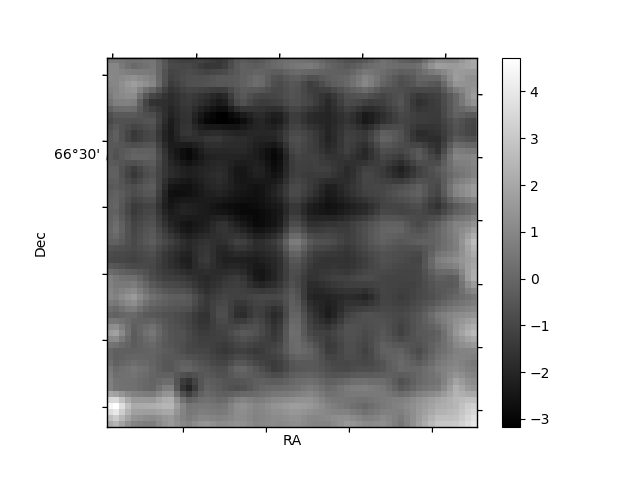
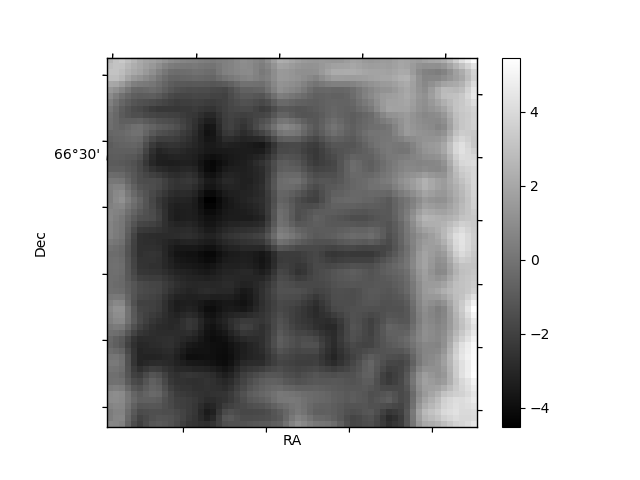
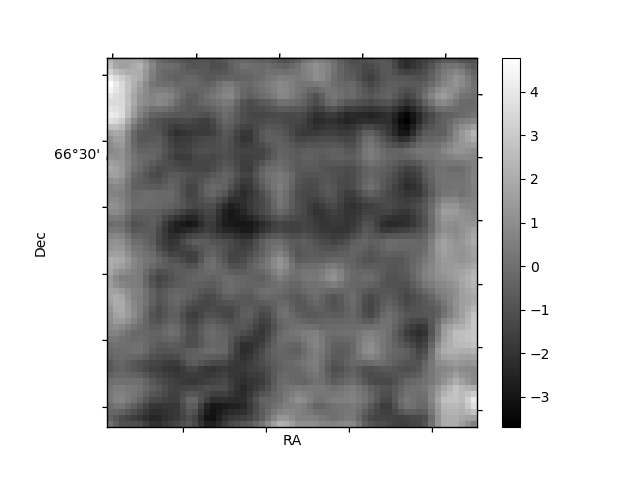
Histogram calculated using DETX and DETY for each event in the final _common_clean file
| Quadrant A | 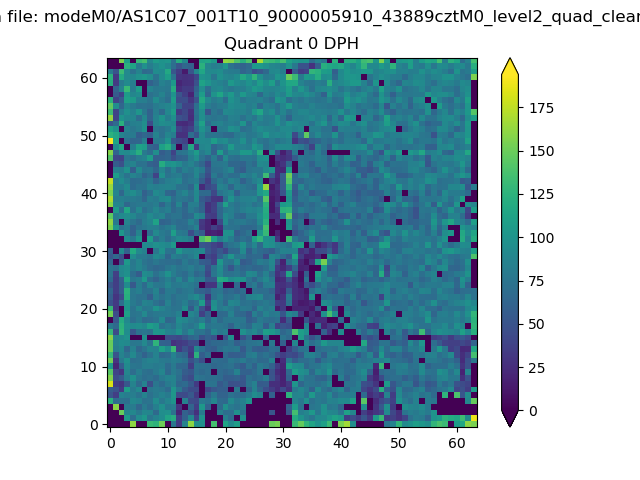 |
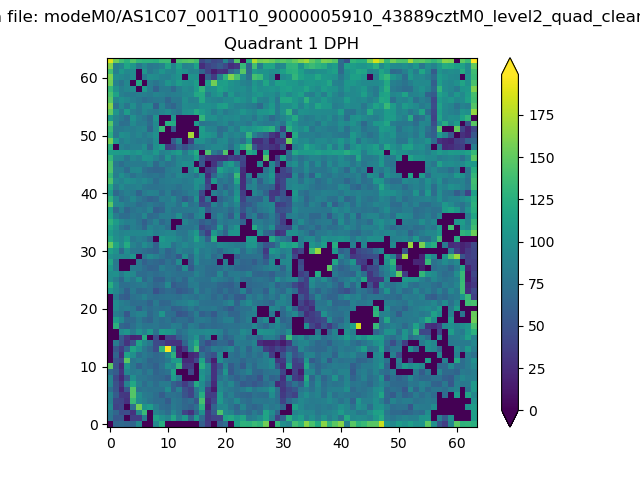 |
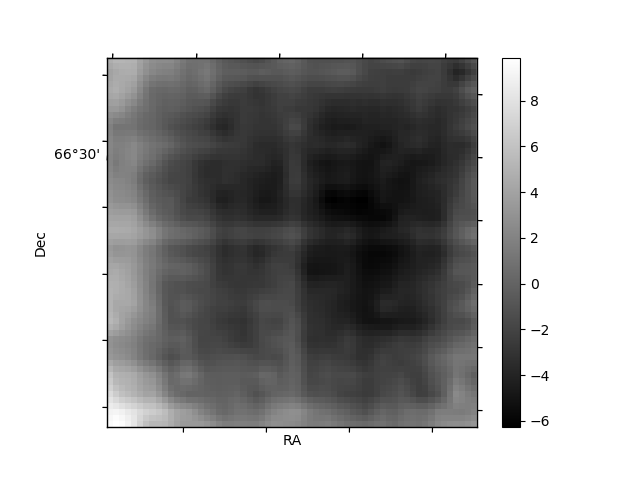
Quadrant B |
|---|---|---|---|
| Quadrant D | 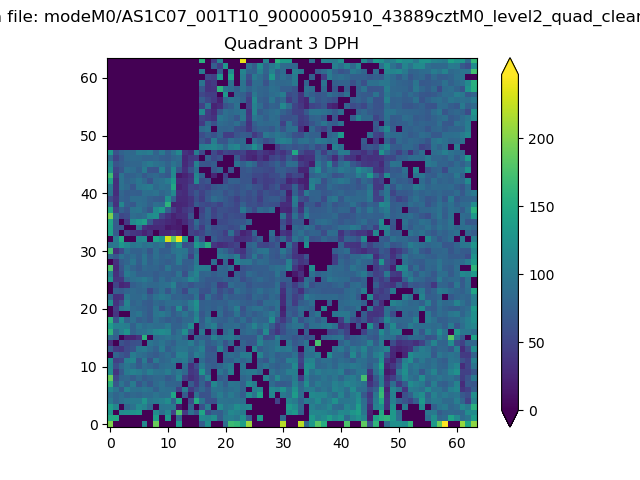 |
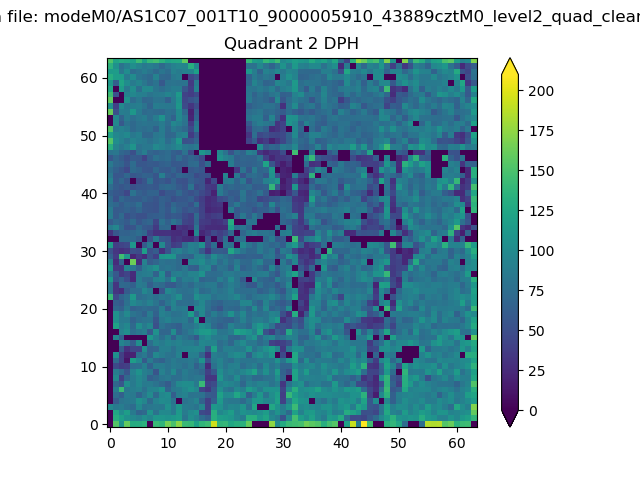 |
Quadrant C |
| Plot type | Count rate plots | Images |
|---|---|---|
| Comparison with Poisson distribution Blue bars denote a histogram of data divided into 1 sec bins. Red curve is a Poisson curve with rate = median count rate of data. |
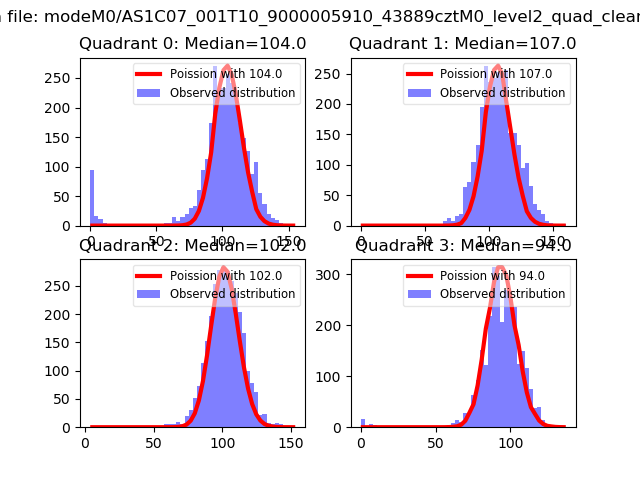 |
 |
| Quadrant-wise count rates Data is divided into 100 sec bins |
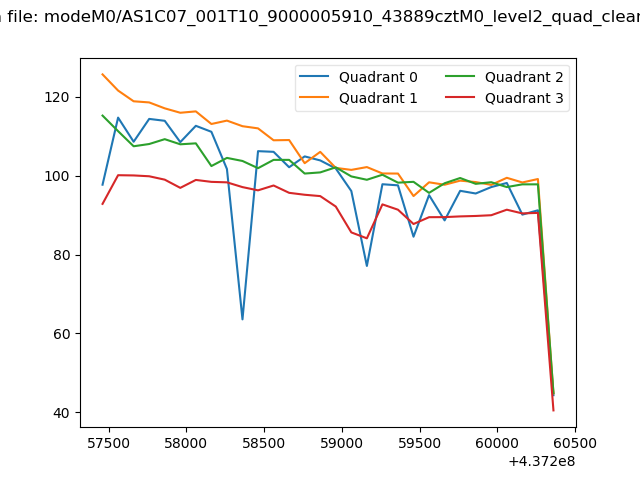 |
|
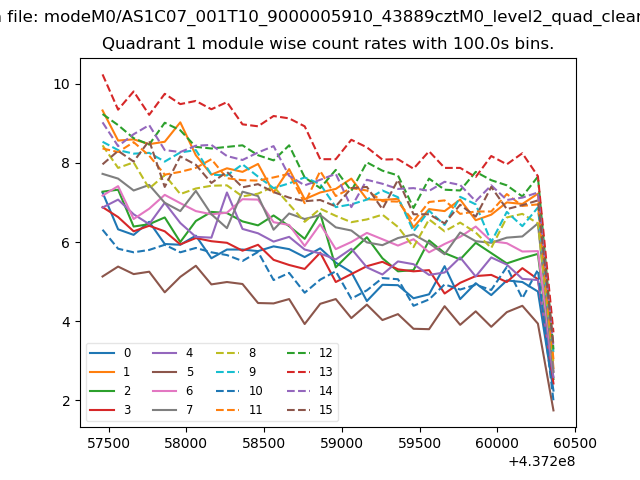
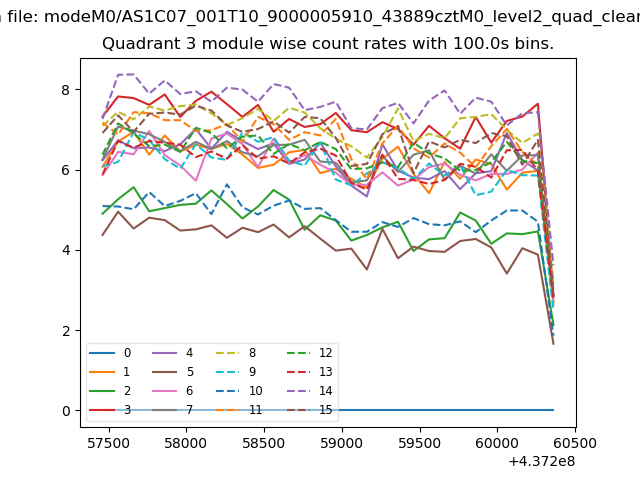
| Module-wise count rates for Quadrant A Data is divided into 100 sec bins |
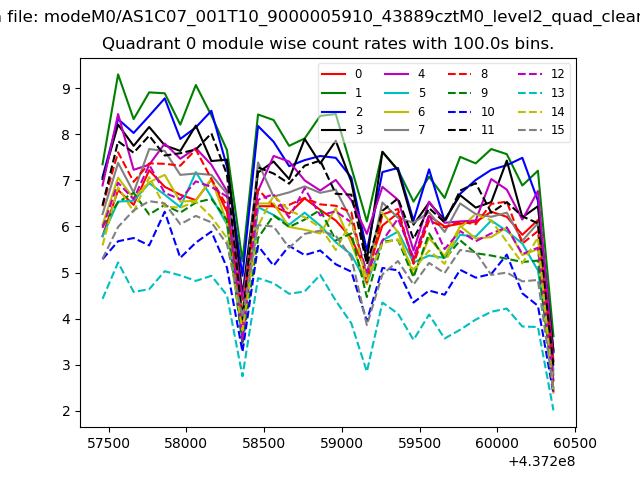 |
 |
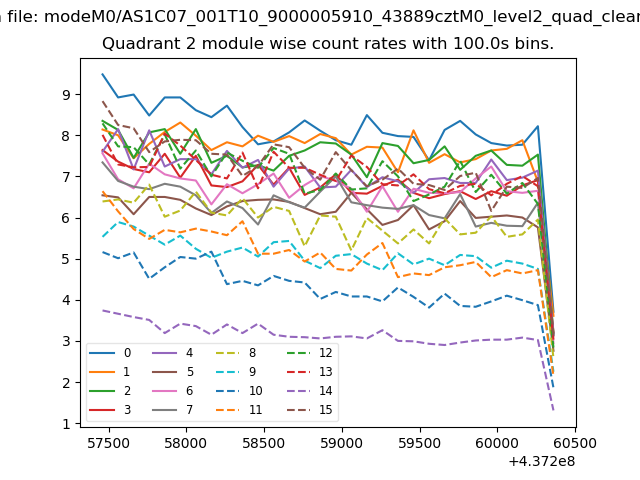
| Module-wise count rates for Quadrant B Data is divided into 100 sec bins |
 |
 |
| Module-wise count rates for Quadrant C Data is divided into 100 sec bins |
 |
 |
| Module-wise count rates for Quadrant D Data is divided into 100 sec bins |
 |
 |
| Parameter | Plot |
|---|---|
| CZT HV Monitor | 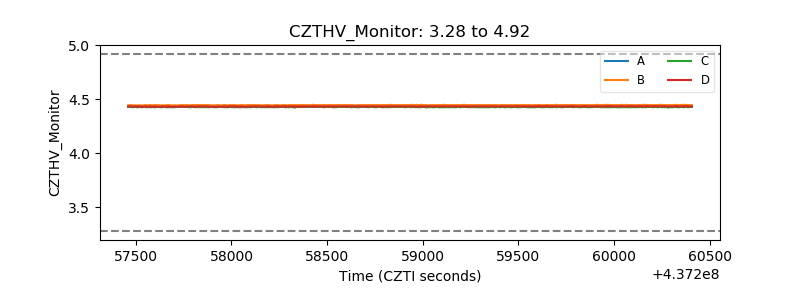 |
| D_VDD | 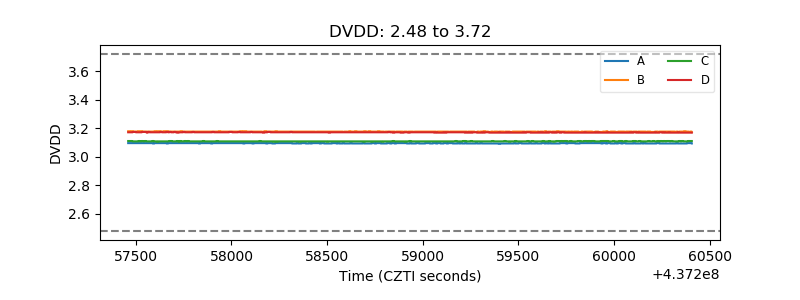 |
| Temperature 1 |  |
| Veto HV Monitor | 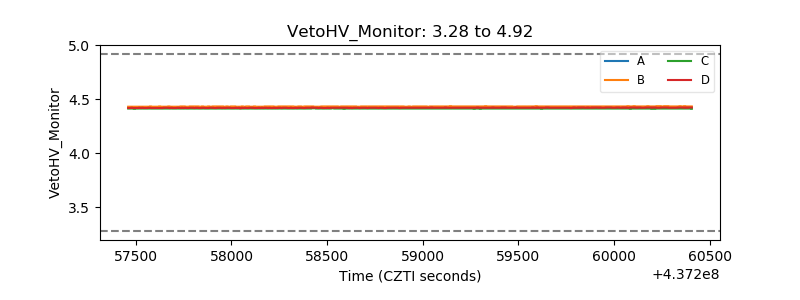 |
| Veto LLD | 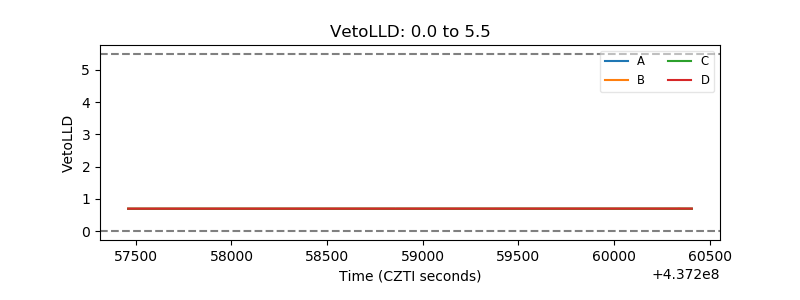 |
| Alpha Counter | 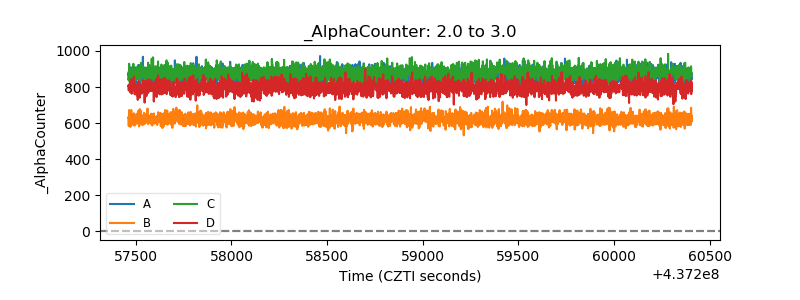 |
| _CPM_Rate | 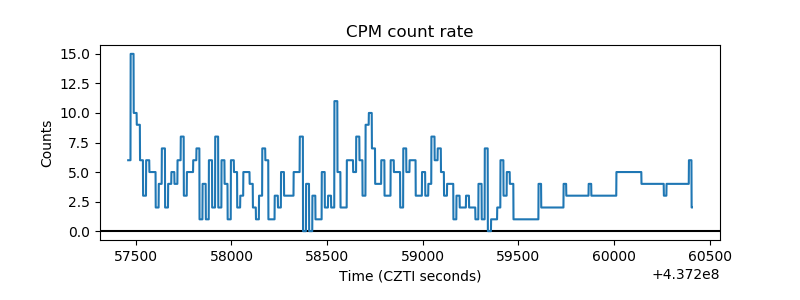 |
| CZT Counter | 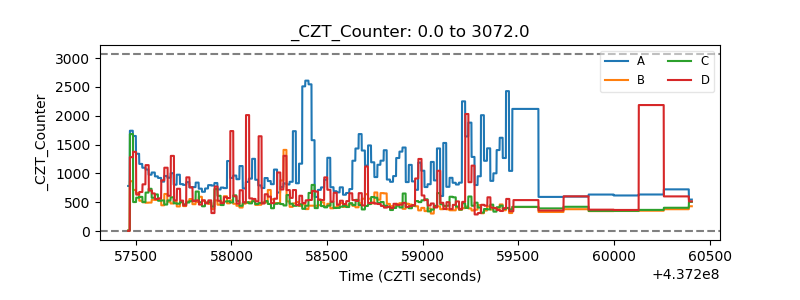 |
| +2.5 Volts monitor | 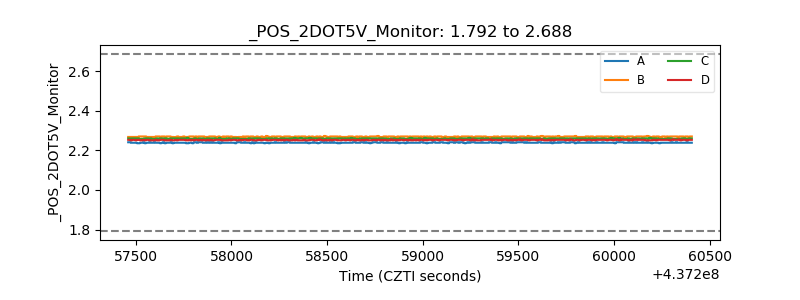 |
| +5 Volts monitor | 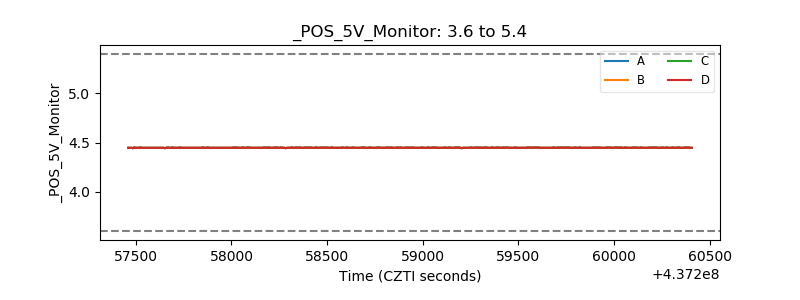 |
| _ROLL_ROT | 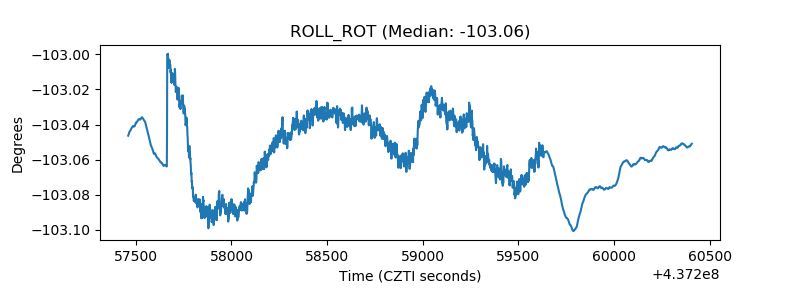 |
| _Roll_DEC | 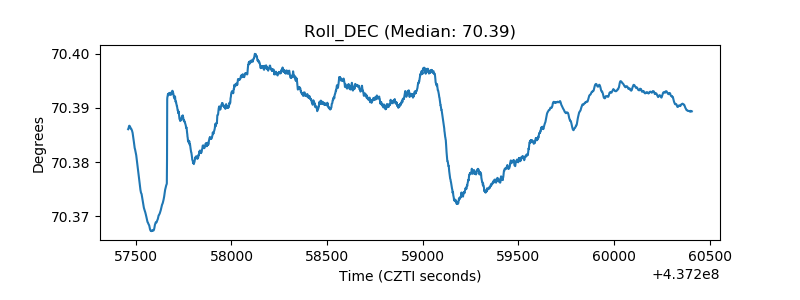 |
| _Roll_RA | 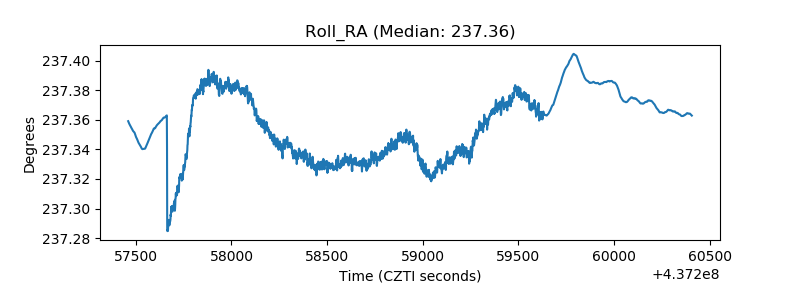 |
| Veto Counter | 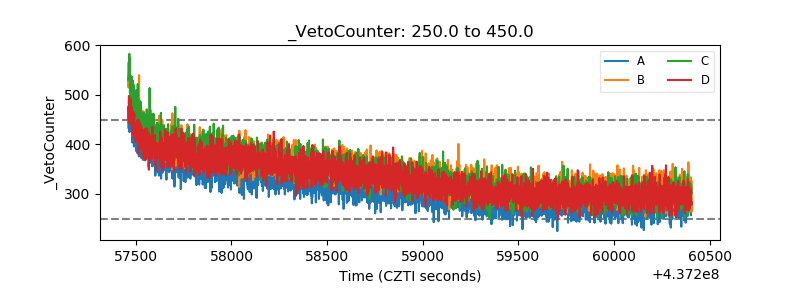 |