| Param | Original file | Final file |
|---|---|---|
| Filename | modeM0/AS1A13_009T02_9000005914_43894cztM0_level2.fits | modeM0/AS1A13_009T02_9000005914_43894cztM0_level2_quad_clean.evt |
| Size (bytes) | 459,852,480 | 111,075,840 |
| Size | 438.5 MB | 105.9 MB |
| Events in quadrant A | 5,593,835 | 717,534 |
| Events in quadrant B | 3,591,421 | 787,594 |
| Events in quadrant C | 3,131,096 | 747,120 |
| Events in quadrant D | 4,203,588 | 660,676 |
| Mode M9 | |||
|---|---|---|---|
| Quadrant | BADHDUFLAG | Total packets | Discarded packets |
| A | 0 | 12 | 0 |
| B | 0 | 12 | 0 |
| C | 0 | 12 | 0 |
| D | 0 | 12 | 0 |
| Mode SS | |||
|---|---|---|---|
| Quadrant | BADHDUFLAG | Total packets | Discarded packets |
| A | 0 | 130 | 0 |
| B | 0 | 130 | 0 |
| C | 0 | 130 | 0 |
| D | 0 | 130 | 0 |
| Mode M0 | |||
|---|---|---|---|
| Quadrant | BADHDUFLAG | Total packets | Discarded packets |
| A | 0 | 21609 | 1 |
| B | 0 | 14874 | 1 |
| C | 0 | 13800 | 1 |
| D | 0 | 16971 | 1 |
| Quadrant | Total seconds | Saturated seconds | Saturation percentage |
|---|---|---|---|
| A | 6462 | 512 | 7.923244% |
| B | 6463 | 130 | 2.011450% |
| C | 6463 | 55 | 0.850998% |
| D | 6463 | 277 | 4.285935% |
Noise dominated data is calculated using 1-second bins in cleaned event files. If a bin has >2000 counts, and if more than 50% of those come from <1% of pixels, then it is considered to be noise-dominated and hence unusable.
| Quadrant | # 1 sec bins | Bins with >0 counts | Bins with >2000 counts | High rate bins dominated by noise | Noise dominated (total time) | Noise dominated (detector-on time) | Marked lightcurve |
|---|---|---|---|---|---|---|---|
| A | 7652 | 6463 | 429 | 429 | 5.61% | 6.64% | 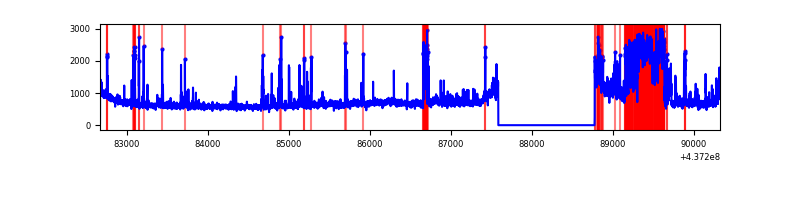 |
| B | 7653 | 6464 | 61 | 61 | 0.80% | 0.94% | 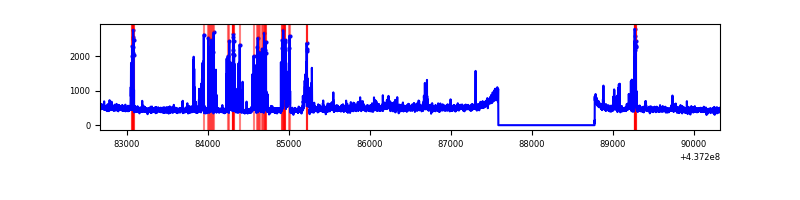 |
| C | 7653 | 6464 | 21 | 21 | 0.27% | 0.32% | 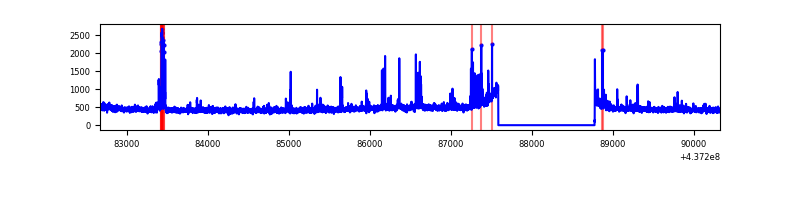 |
| D | 7653 | 6464 | 230 | 230 | 3.01% | 3.56% | 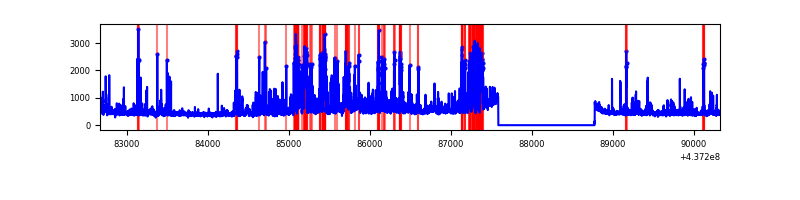 |
Top three noisy pixels from each quadrant. If the there are fewer than three noisy pixels in the level2.evt file, extra rows are filled as -1
| Pixel properties | Quadrant properties | ||||||
|---|---|---|---|---|---|---|---|
| Quadrant | DetID | PixID | Counts | Sigma | Mean | Median | Sigma |
| A | 10 | 83 | 1054517 | 6844.34 | 745 | 731 | 154.0 |
| A | 15 | 223 | 1022575 | 6636.87 | 745 | 731 | 154.0 |
| A | 15 | 222 | 411458 | 2667.67 | 745 | 731 | 154.0 |
| B | 7 | 205 | 394332 | 2684.41 | 752 | 730 | 146.6 |
| B | 5 | 172 | 114822 | 778.12 | 752 | 730 | 146.6 |
| B | 0 | 200 | 67542 | 455.67 | 752 | 730 | 146.6 |
| C | 14 | 254 | 113236 | 654.79 | 734 | 739 | 171.8 |
| C | 3 | 233 | 59926 | 344.5 | 734 | 739 | 171.8 |
| C | 15 | 158 | 43096 | 246.54 | 734 | 739 | 171.8 |
| D | 5 | 235 | 602912 | 3317.57 | 723 | 700 | 181.5 |
| D | 1 | 52 | 325641 | 1790.09 | 723 | 700 | 181.5 |
| D | 13 | 171 | 111492 | 610.35 | 723 | 700 | 181.5 |
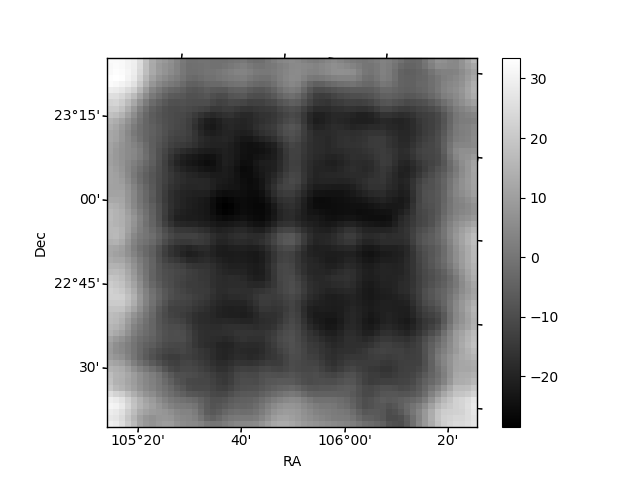
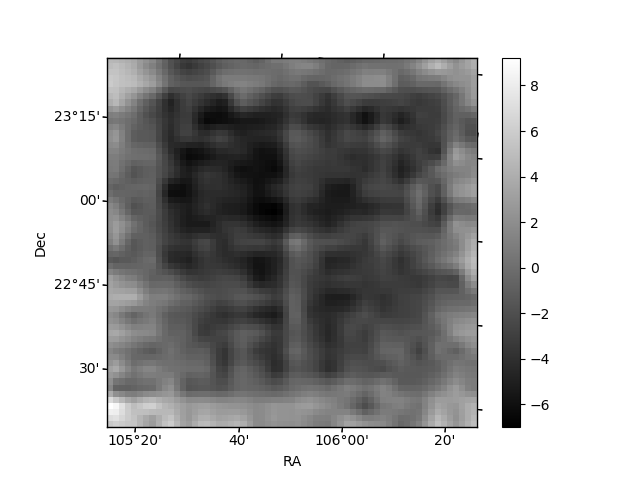
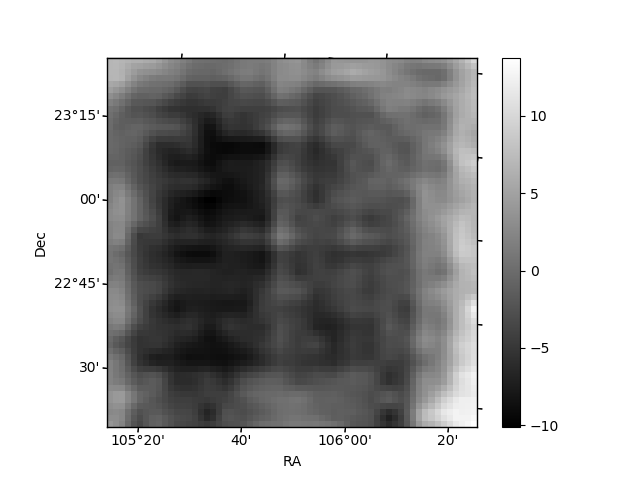
Histogram calculated using DETX and DETY for each event in the final _common_clean file
| Quadrant A | 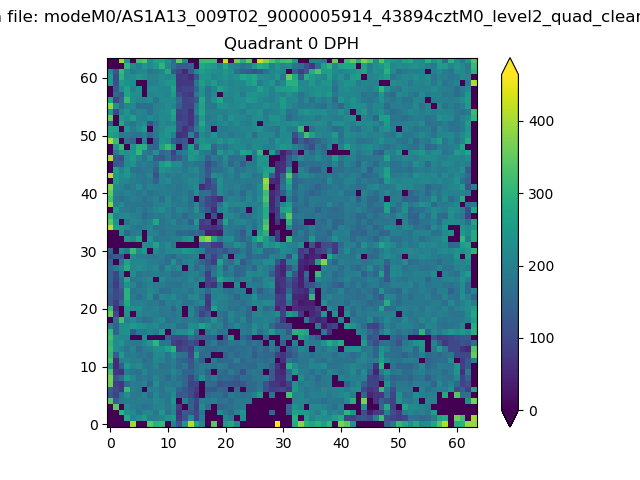 |
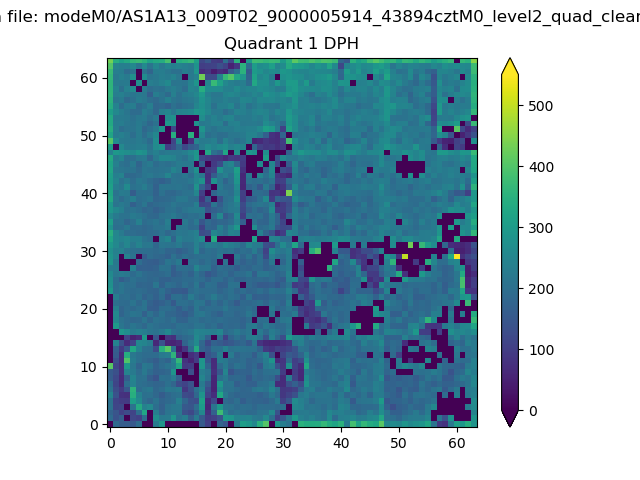 |
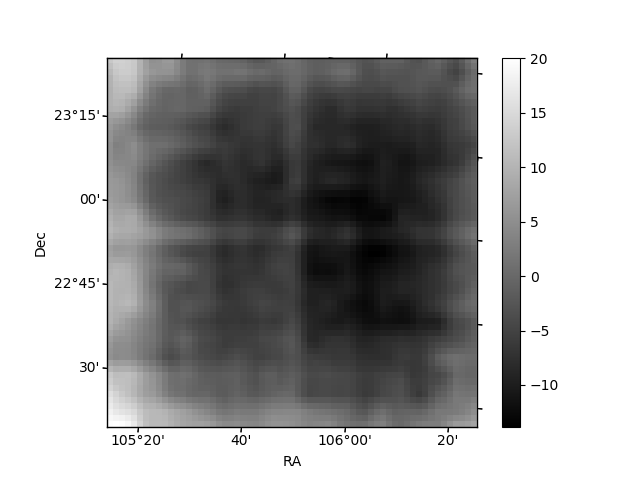
Quadrant B |
|---|---|---|---|
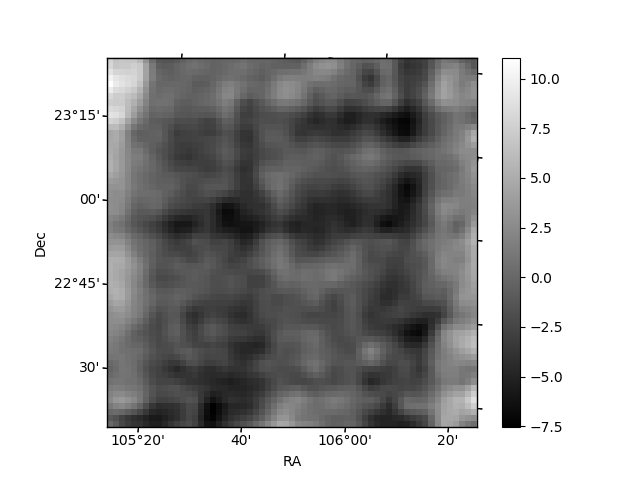
| Quadrant D | 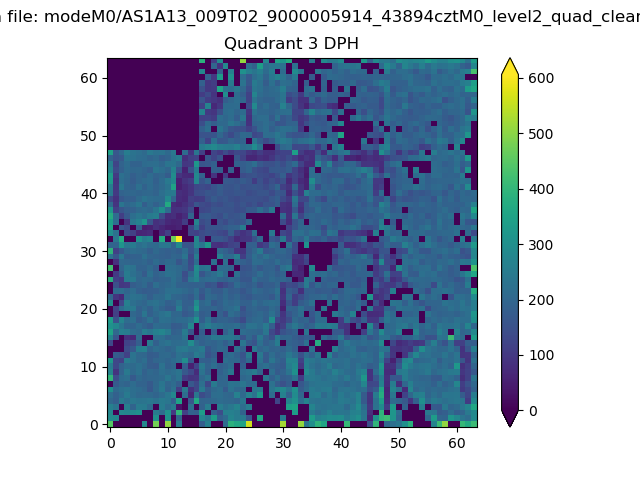 |
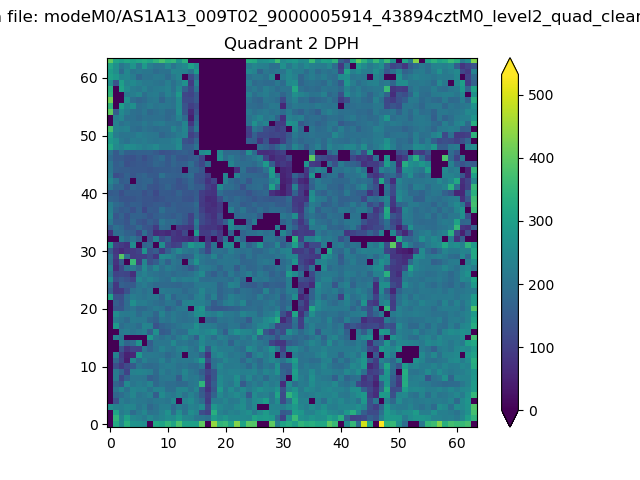 |
Quadrant C |
| Plot type | Count rate plots | Images |
|---|---|---|
| Comparison with Poisson distribution Blue bars denote a histogram of data divided into 1 sec bins. Red curve is a Poisson curve with rate = median count rate of data. |
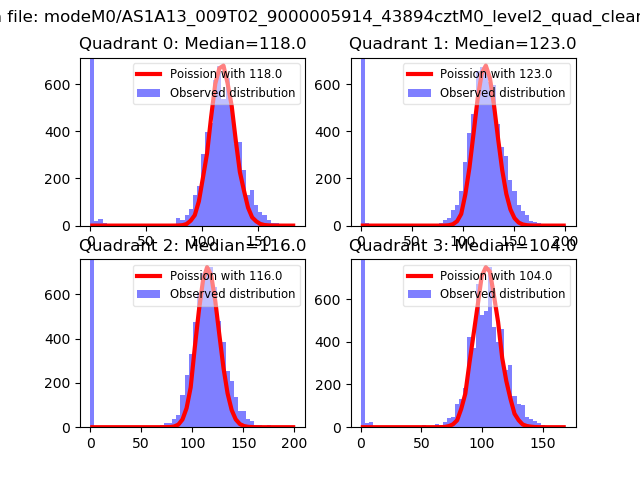 |
 |
| Quadrant-wise count rates Data is divided into 100 sec bins |
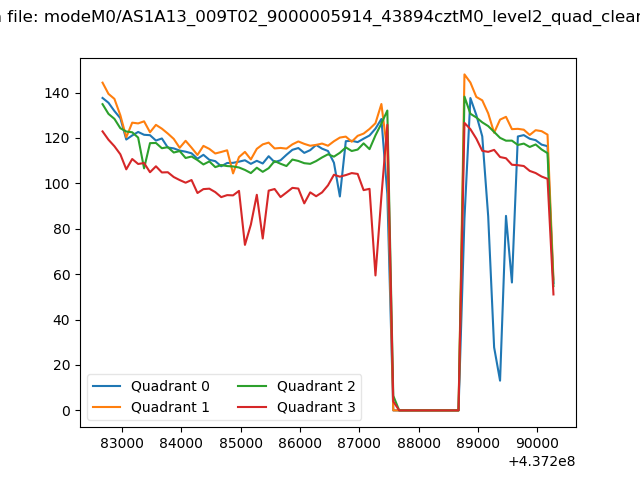 |
|
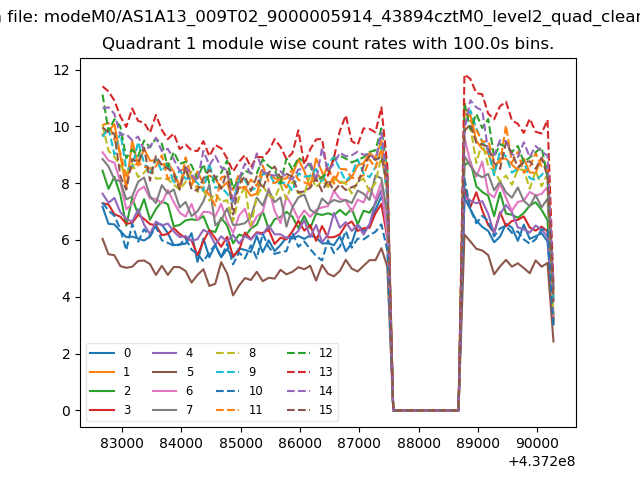
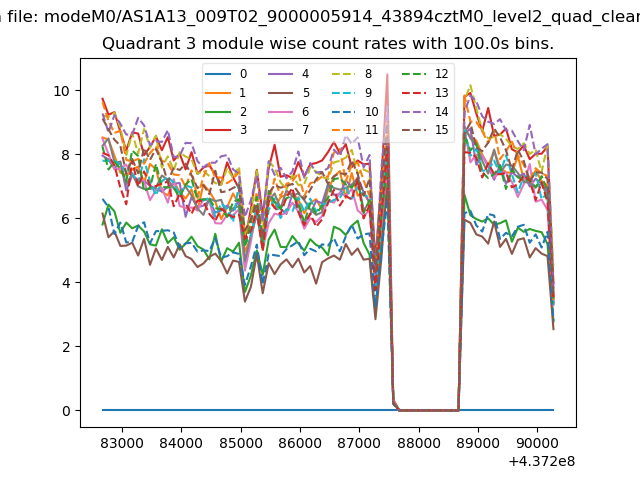
| Module-wise count rates for Quadrant A Data is divided into 100 sec bins |
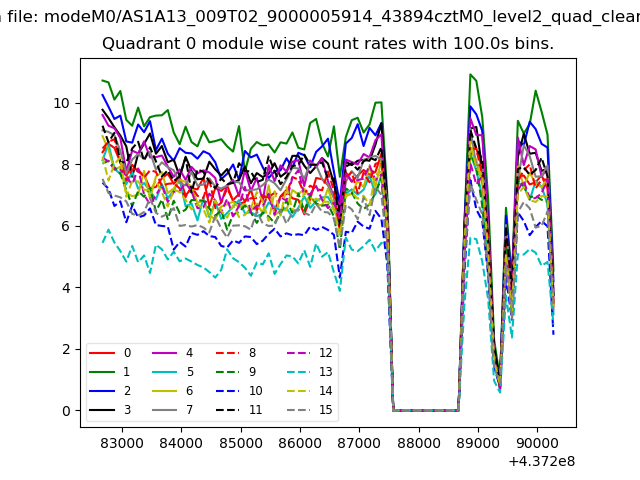 |
 |
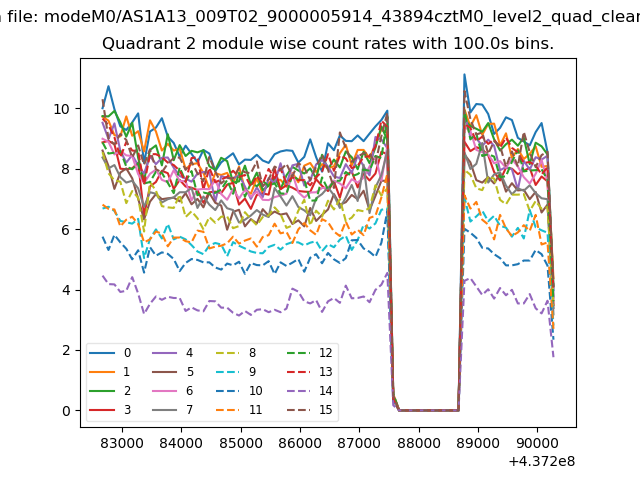
| Module-wise count rates for Quadrant B Data is divided into 100 sec bins |
 |
 |
| Module-wise count rates for Quadrant C Data is divided into 100 sec bins |
 |
 |
| Module-wise count rates for Quadrant D Data is divided into 100 sec bins |
 |
 |
| Parameter | Plot |
|---|---|
| CZT HV Monitor | 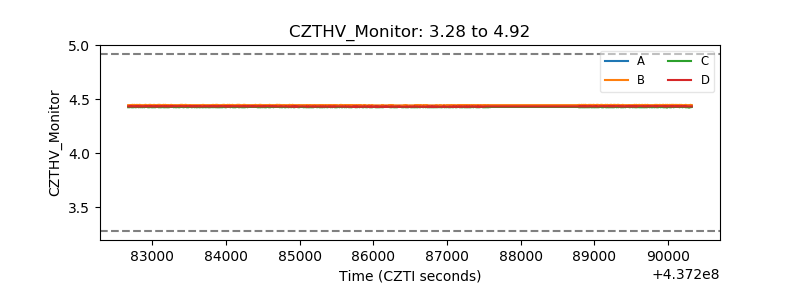 |
| D_VDD | 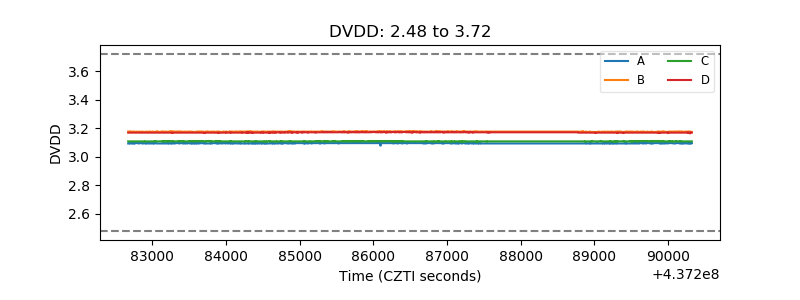 |
| Temperature 1 | 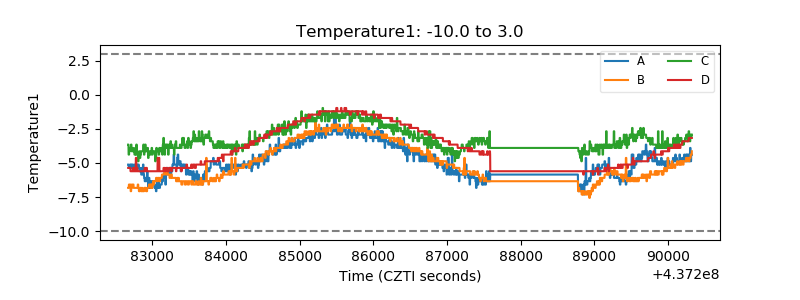 |
| Veto HV Monitor | 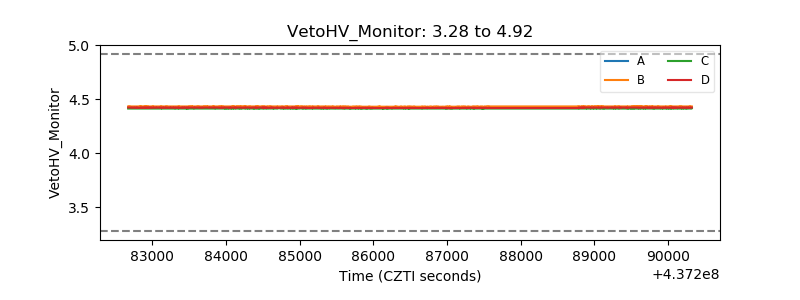 |
| Veto LLD | 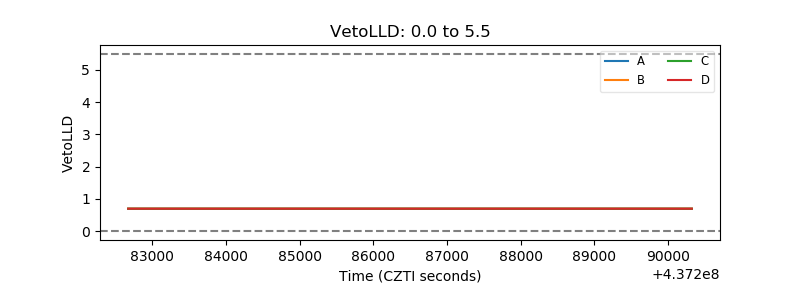 |
| Alpha Counter | 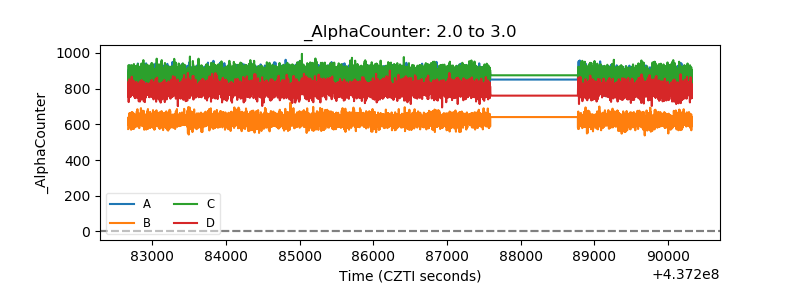 |
| _CPM_Rate | 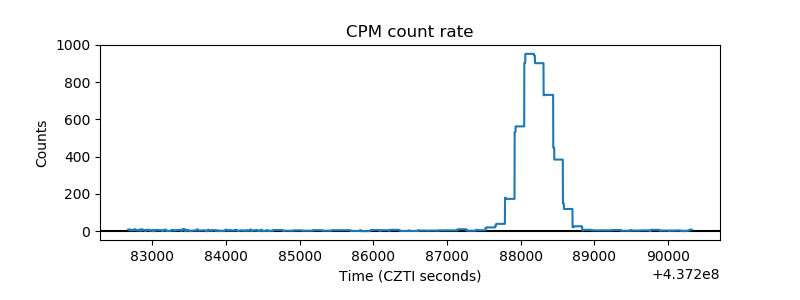 |
| CZT Counter | 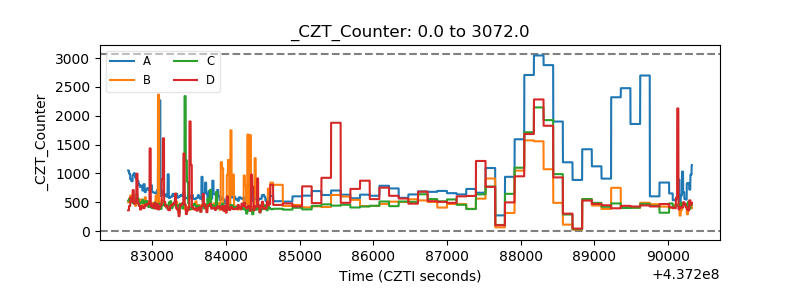 |
| +2.5 Volts monitor | 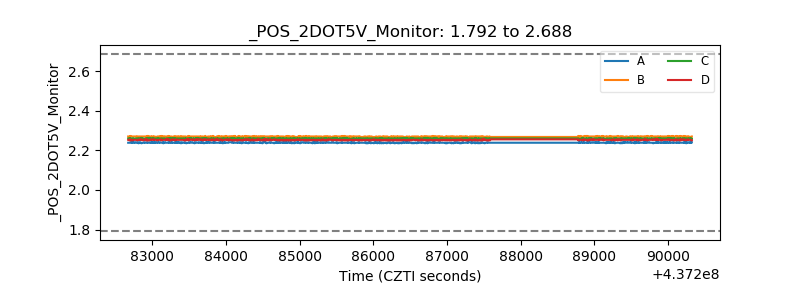 |
| +5 Volts monitor | 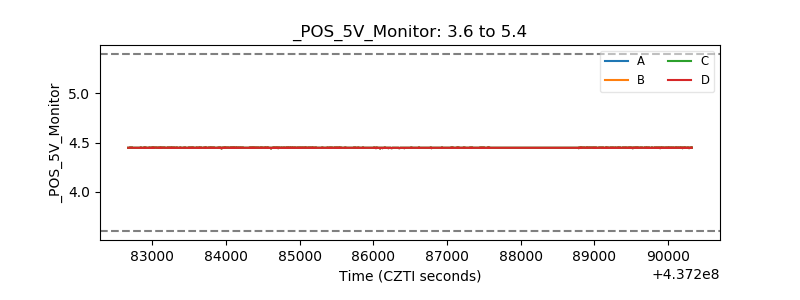 |
| _ROLL_ROT | 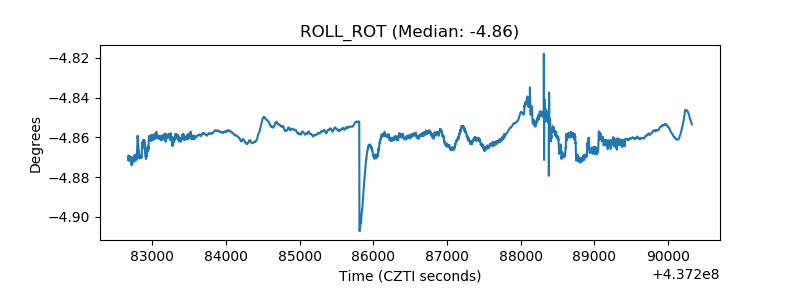 |
| _Roll_DEC | 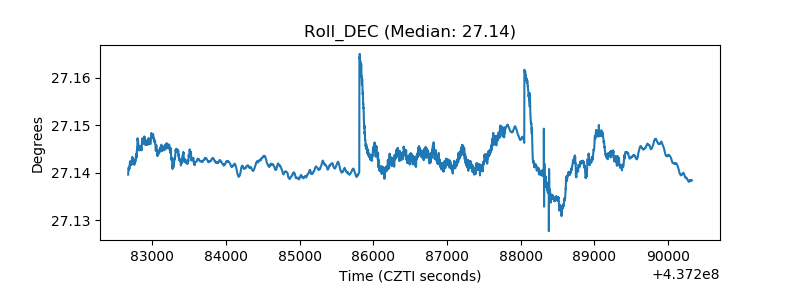 |
| _Roll_RA | 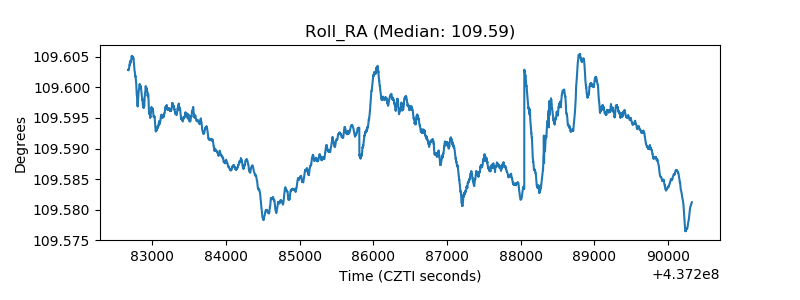 |
| Veto Counter | 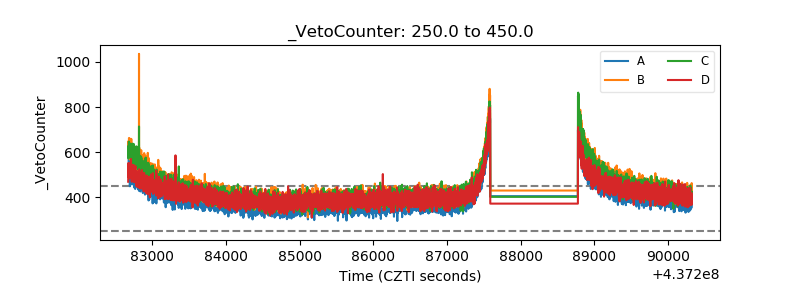 |