| Param | Original file | Final file |
|---|---|---|
| Filename | modeM0/AS1A13_009T02_9000005914_43895cztM0_level2.fits | modeM0/AS1A13_009T02_9000005914_43895cztM0_level2_quad_clean.evt |
| Size (bytes) | 515,344,320 | 108,256,320 |
| Size | 491.5 MB | 103.2 MB |
| Events in quadrant A | 6,399,156 | 705,894 |
| Events in quadrant B | 3,195,509 | 788,176 |
| Events in quadrant C | 3,058,368 | 744,835 |
| Events in quadrant D | 5,920,459 | 587,905 |
| Mode M9 | |||
|---|---|---|---|
| Quadrant | BADHDUFLAG | Total packets | Discarded packets |
| A | 0 | 15 | 0 |
| B | 0 | 16 | 0 |
| C | 0 | 16 | 0 |
| D | 0 | 16 | 0 |
| Mode SS | |||
|---|---|---|---|
| Quadrant | BADHDUFLAG | Total packets | Discarded packets |
| A | 0 | 130 | 0 |
| B | 0 | 130 | 0 |
| C | 0 | 130 | 0 |
| D | 0 | 130 | 0 |
| Mode M0 | |||
|---|---|---|---|
| Quadrant | BADHDUFLAG | Total packets | Discarded packets |
| A | 0 | 24159 | 2 |
| B | 0 | 13671 | 2 |
| C | 0 | 13514 | 2 |
| D | 0 | 21999 | 2 |
| Quadrant | Total seconds | Saturated seconds | Saturation percentage |
|---|---|---|---|
| A | 6474 | 642 | 9.916589% |
| B | 6474 | 92 | 1.421069% |
| C | 6474 | 40 | 0.617856% |
| D | 6474 | 1034 | 15.971579% |
Noise dominated data is calculated using 1-second bins in cleaned event files. If a bin has >2000 counts, and if more than 50% of those come from <1% of pixels, then it is considered to be noise-dominated and hence unusable.
| Quadrant | # 1 sec bins | Bins with >0 counts | Bins with >2000 counts | High rate bins dominated by noise | Noise dominated (total time) | Noise dominated (detector-on time) | Marked lightcurve |
|---|---|---|---|---|---|---|---|
| A | 7624 | 6475 | 473 | 473 | 6.20% | 7.31% | 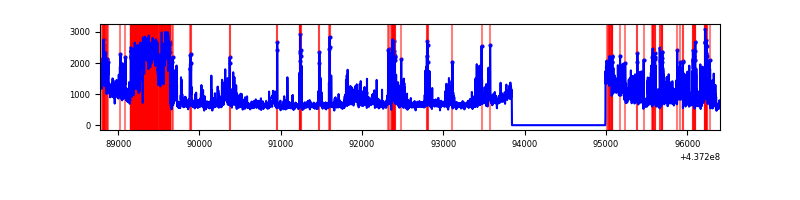 |
| B | 7624 | 6475 | 9 | 9 | 0.12% | 0.14% | 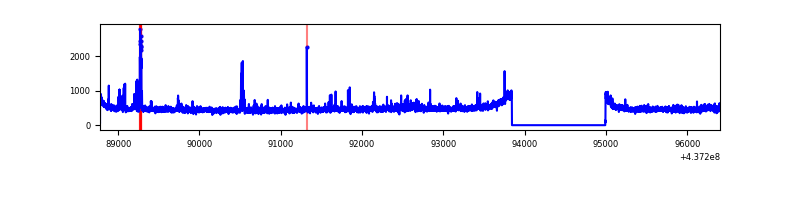 |
| C | 7624 | 6475 | 5 | 5 | 0.07% | 0.08% | 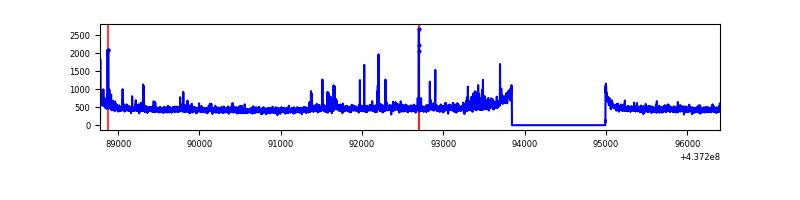 |
| D | 7624 | 6475 | 896 | 896 | 11.75% | 13.84% | 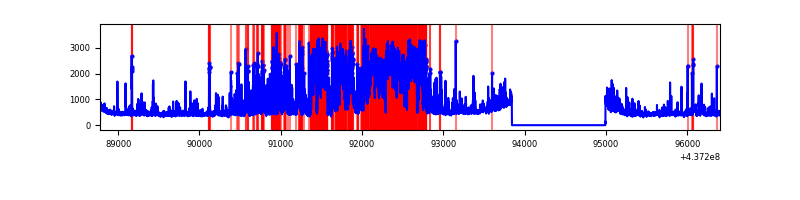 |
Top three noisy pixels from each quadrant. If the there are fewer than three noisy pixels in the level2.evt file, extra rows are filled as -1
| Pixel properties | Quadrant properties | ||||||
|---|---|---|---|---|---|---|---|
| Quadrant | DetID | PixID | Counts | Sigma | Mean | Median | Sigma |
| A | 15 | 223 | 1645593 | 10692.98 | 747 | 733 | 153.8 |
| A | 10 | 83 | 1104390 | 7174.7 | 747 | 733 | 153.8 |
| A | 13 | 248 | 348329 | 2259.67 | 747 | 733 | 153.8 |
| B | 5 | 172 | 72729 | 486.26 | 758 | 735 | 148.1 |
| B | 0 | 200 | 34971 | 231.24 | 758 | 735 | 148.1 |
| B | 0 | 199 | 31141 | 205.37 | 758 | 735 | 148.1 |
| C | 3 | 233 | 83710 | 476.97 | 739 | 744 | 173.9 |
| C | 14 | 254 | 44174 | 249.68 | 739 | 744 | 173.9 |
| C | 15 | 157 | 18078 | 99.65 | 739 | 744 | 173.9 |
| D | 5 | 235 | 1922201 | 11150.55 | 682 | 660 | 172.3 |
| D | 12 | 233 | 393654 | 2280.51 | 682 | 660 | 172.3 |
| D | 13 | 171 | 196612 | 1137.09 | 682 | 660 | 172.3 |
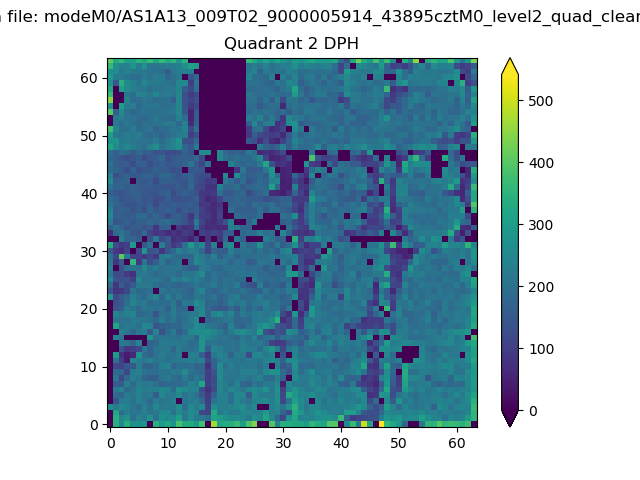
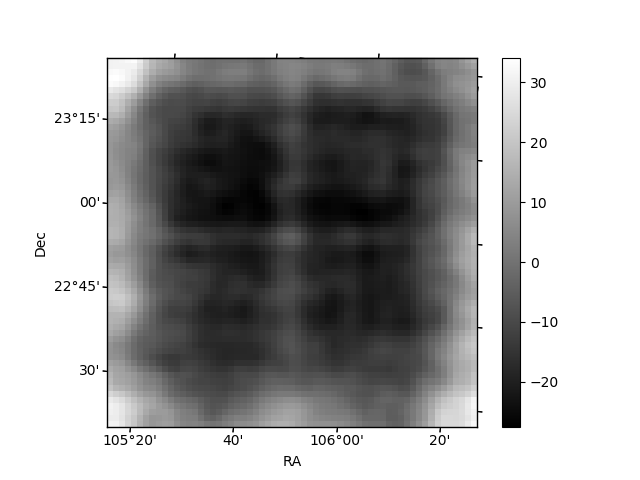
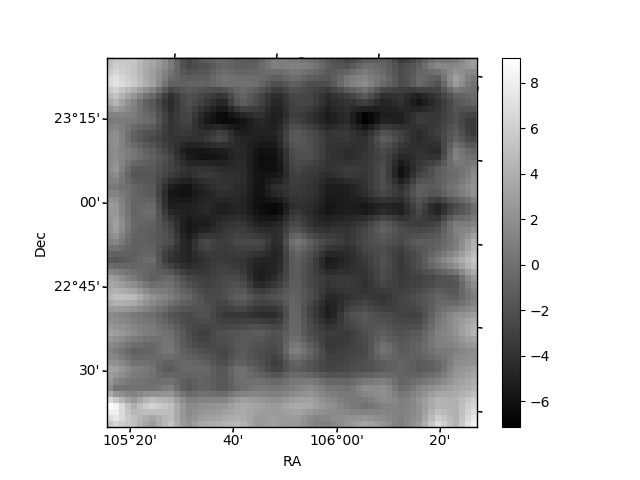
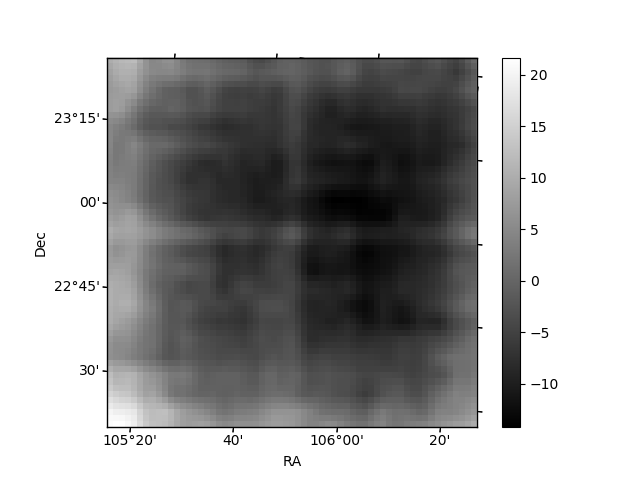
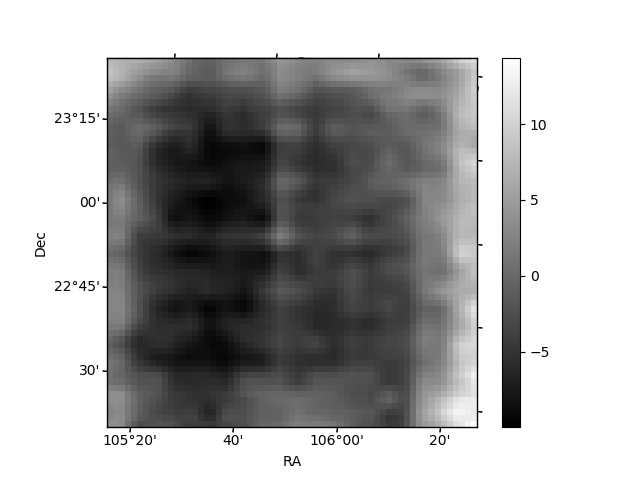
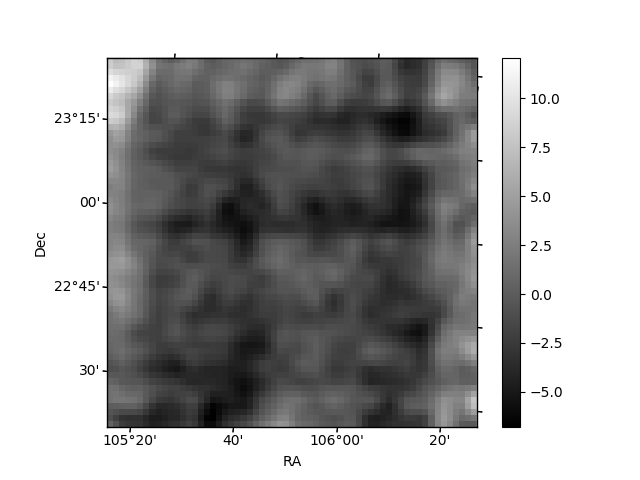
Histogram calculated using DETX and DETY for each event in the final _common_clean file
| Quadrant A | 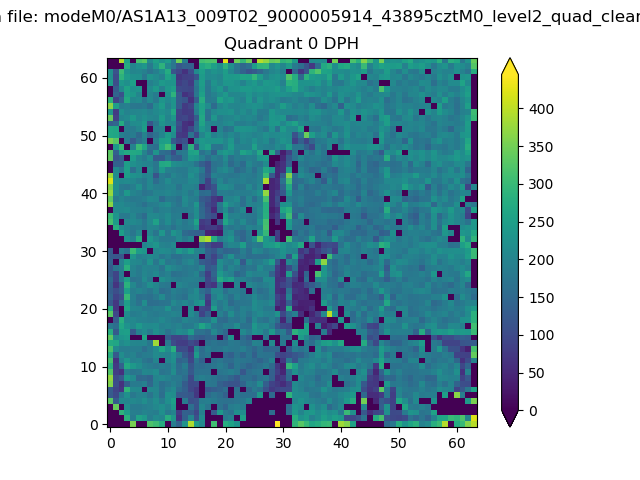 |
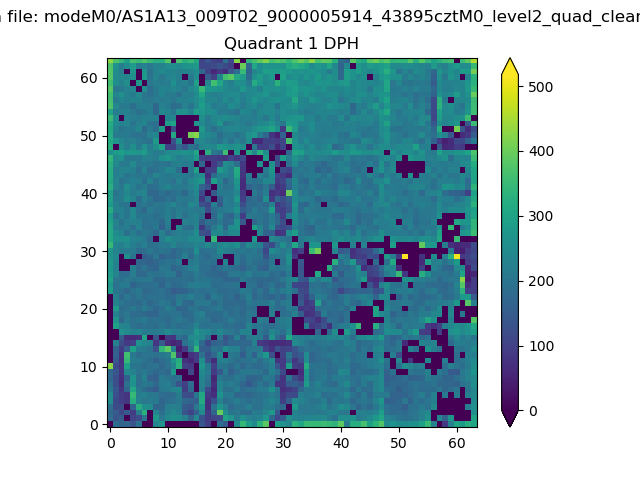 |
Quadrant B |
|---|---|---|---|
| Quadrant D | 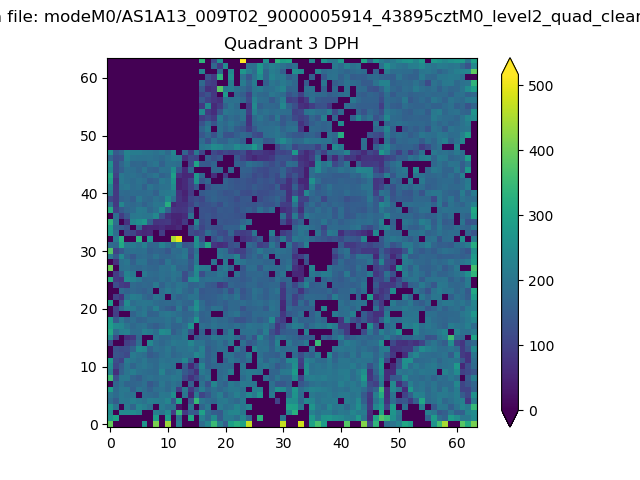 |
 |
Quadrant C |
| Plot type | Count rate plots | Images |
|---|---|---|
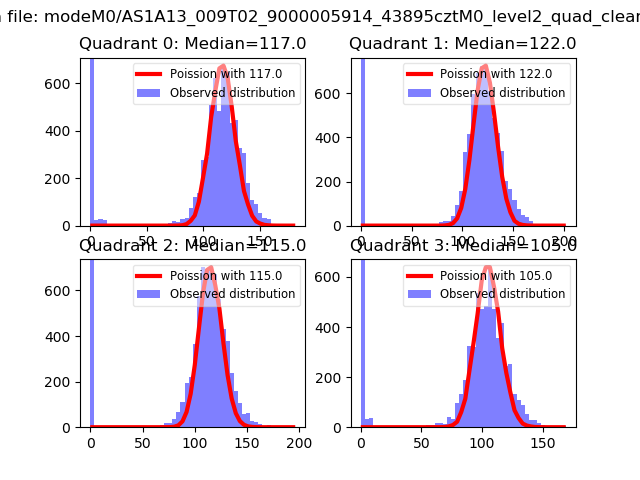
| Comparison with Poisson distribution Blue bars denote a histogram of data divided into 1 sec bins. Red curve is a Poisson curve with rate = median count rate of data. |
 |
 |
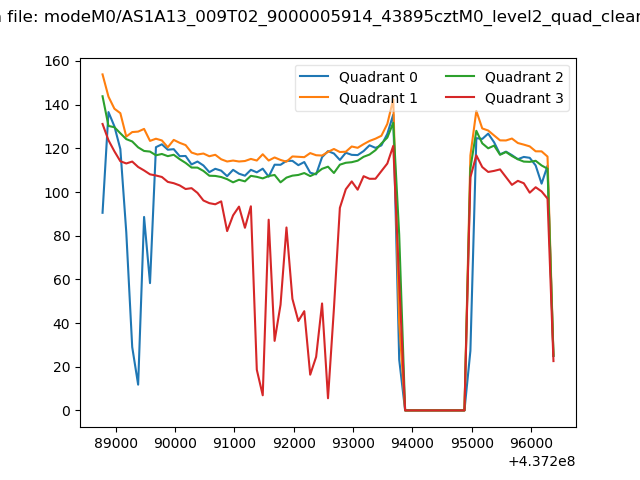
| Quadrant-wise count rates Data is divided into 100 sec bins |
 |
|
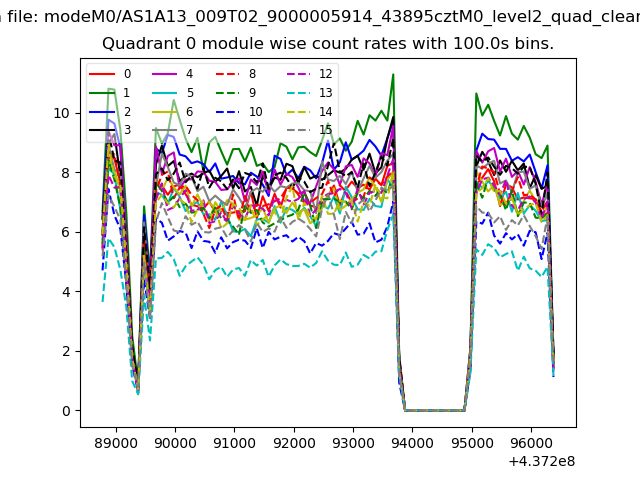
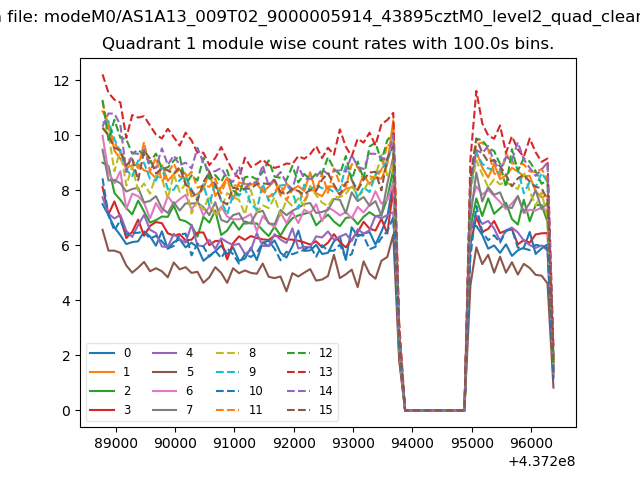
| Module-wise count rates for Quadrant A Data is divided into 100 sec bins |
 |
 |
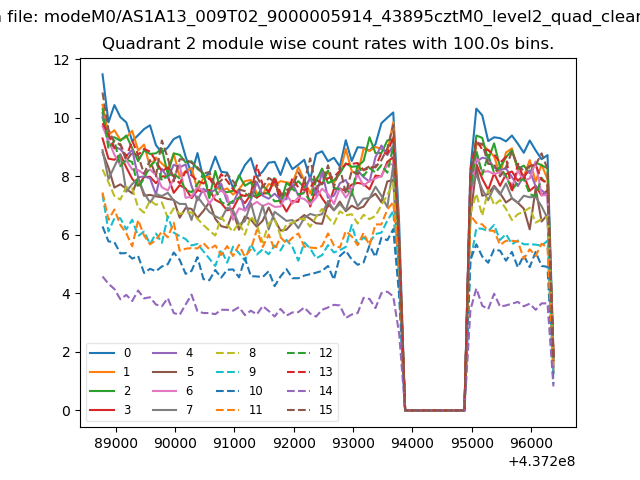
| Module-wise count rates for Quadrant B Data is divided into 100 sec bins |
 |
 |
| Module-wise count rates for Quadrant C Data is divided into 100 sec bins |
 |
 |
| Module-wise count rates for Quadrant D Data is divided into 100 sec bins |
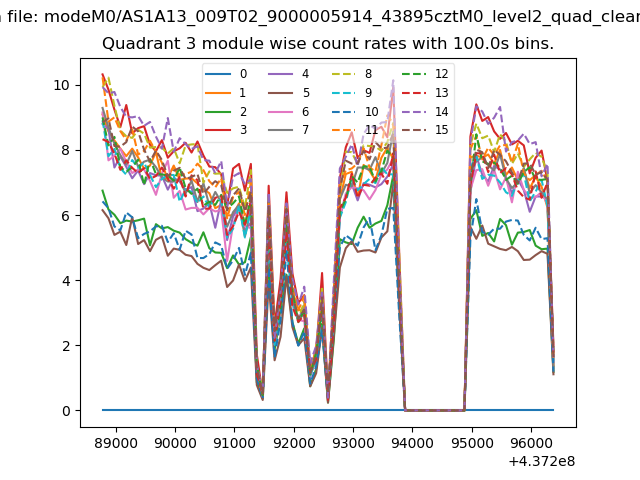 |
 |
| Parameter | Plot |
|---|---|
| CZT HV Monitor | 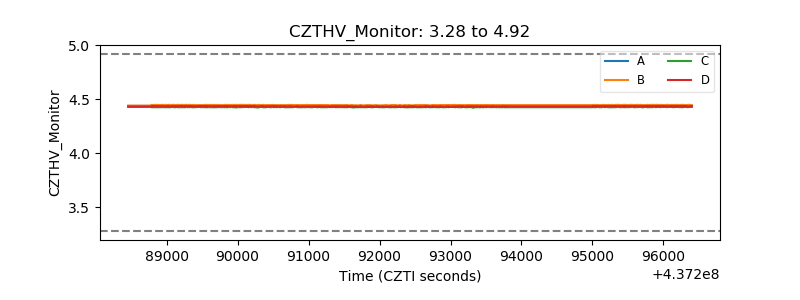 |
| D_VDD | 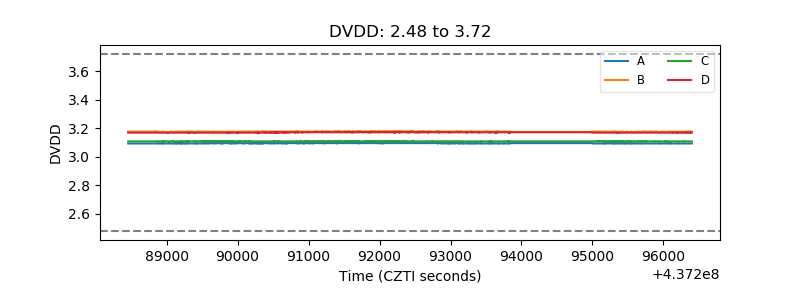 |
| Temperature 1 |  |
| Veto HV Monitor | 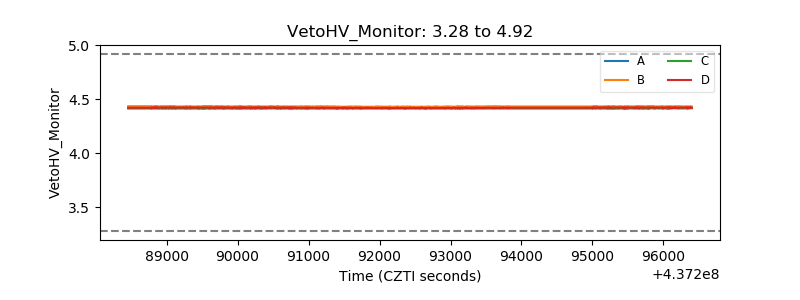 |
| Veto LLD | 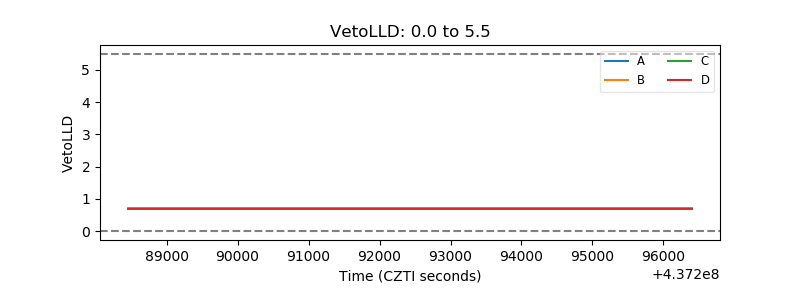 |
| Alpha Counter | 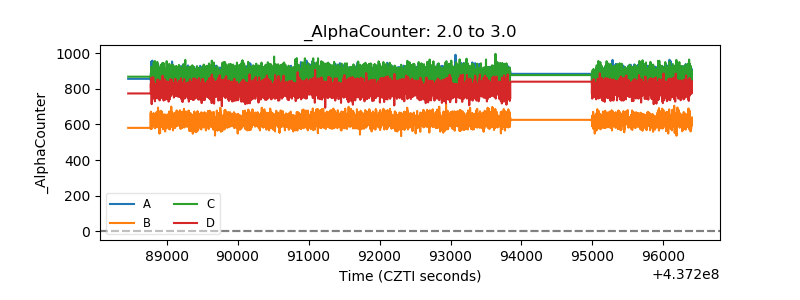 |
| _CPM_Rate | 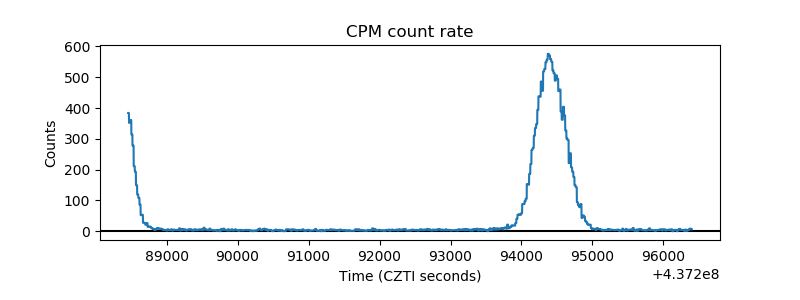 |
| CZT Counter | 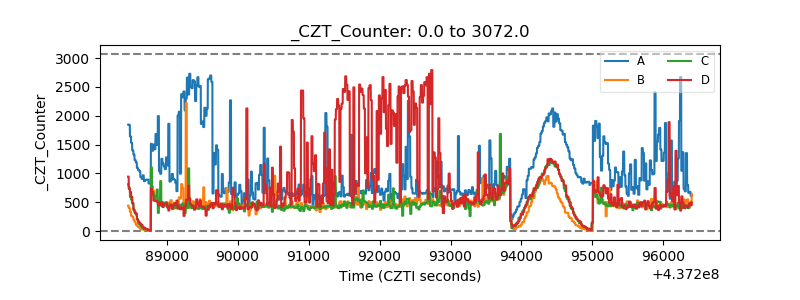 |
| +2.5 Volts monitor | 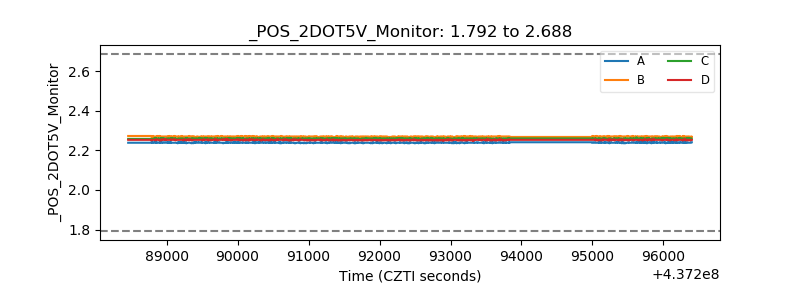 |
| +5 Volts monitor | 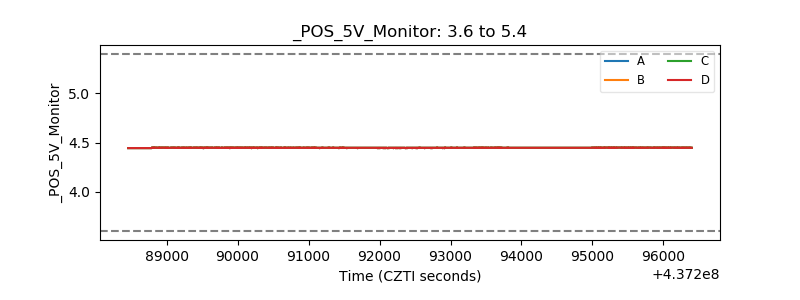 |
| _ROLL_ROT | 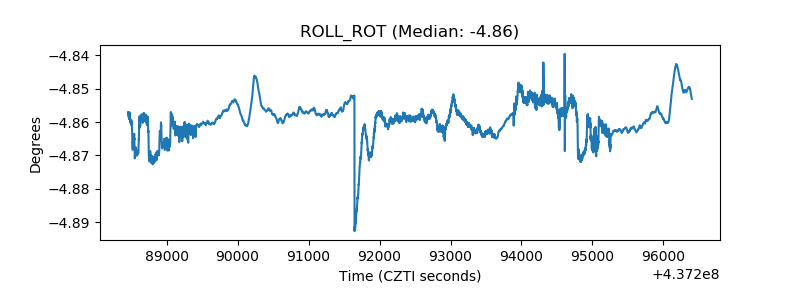 |
| _Roll_DEC | 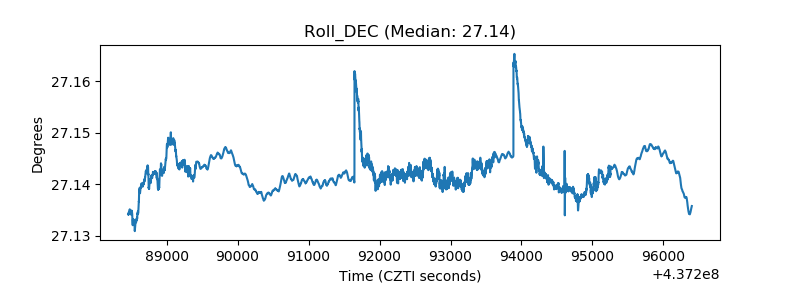 |
| _Roll_RA | 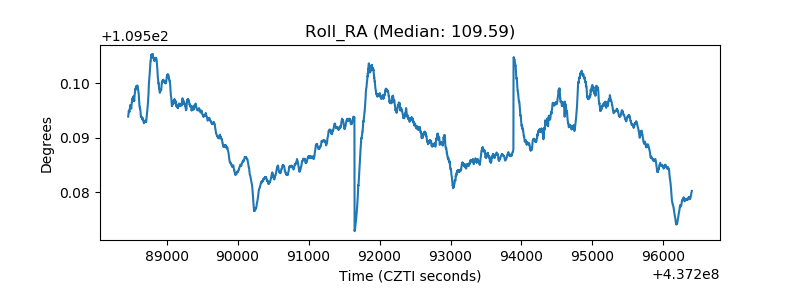 |
| Veto Counter | 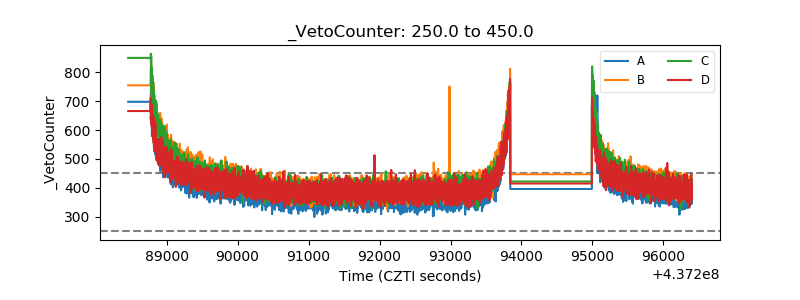 |