| Param | Original file | Final file |
|---|---|---|
| Filename | modeM0/AS1A13_009T02_9000005914_43896cztM0_level2.fits | modeM0/AS1A13_009T02_9000005914_43896cztM0_level2_quad_clean.evt |
| Size (bytes) | 478,840,320 | 99,342,720 |
| Size | 456.7 MB | 94.7 MB |
| Events in quadrant A | 6,549,695 | 622,283 |
| Events in quadrant B | 3,171,324 | 706,273 |
| Events in quadrant C | 2,842,811 | 674,221 |
| Events in quadrant D | 4,685,165 | 577,290 |
| Mode M9 | |||
|---|---|---|---|
| Quadrant | BADHDUFLAG | Total packets | Discarded packets |
| A | 0 | 10 | 0 |
| B | 0 | 10 | 0 |
| C | 0 | 10 | 0 |
| D | 0 | 10 | 0 |
| Mode SS | |||
|---|---|---|---|
| Quadrant | BADHDUFLAG | Total packets | Discarded packets |
| A | 0 | 126 | 0 |
| B | 0 | 126 | 0 |
| C | 0 | 126 | 0 |
| D | 0 | 126 | 0 |
| Mode M0 | |||
|---|---|---|---|
| Quadrant | BADHDUFLAG | Total packets | Discarded packets |
| A | 0 | 24200 | 1 |
| B | 0 | 13348 | 1 |
| C | 0 | 12703 | 1 |
| D | 0 | 18043 | 1 |
| Quadrant | Total seconds | Saturated seconds | Saturation percentage |
|---|---|---|---|
| A | 6126 | 806 | 13.157036% |
| B | 6127 | 146 | 2.382895% |
| C | 6127 | 49 | 0.799739% |
| D | 6127 | 501 | 8.176922% |
Noise dominated data is calculated using 1-second bins in cleaned event files. If a bin has >2000 counts, and if more than 50% of those come from <1% of pixels, then it is considered to be noise-dominated and hence unusable.
| Quadrant | # 1 sec bins | Bins with >0 counts | Bins with >2000 counts | High rate bins dominated by noise | Noise dominated (total time) | Noise dominated (detector-on time) | Marked lightcurve |
|---|---|---|---|---|---|---|---|
| A | 7141 | 6127 | 542 | 542 | 7.59% | 8.85% | 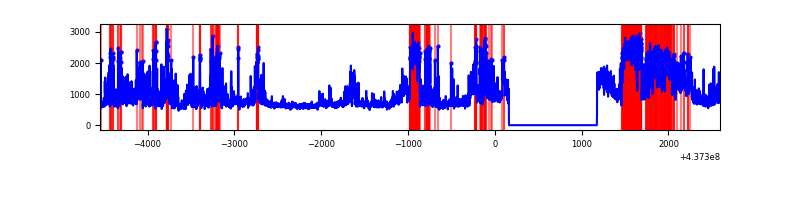 |
| B | 7142 | 6128 | 39 | 39 | 0.55% | 0.64% | 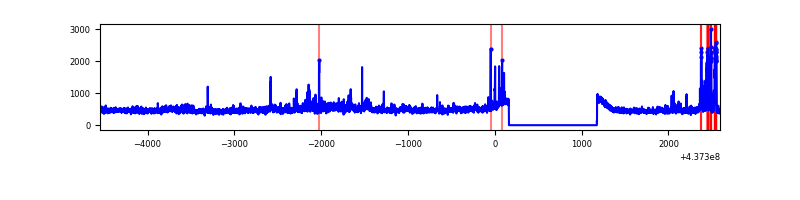 |
| C | 7142 | 6128 | 6 | 6 | 0.08% | 0.10% | 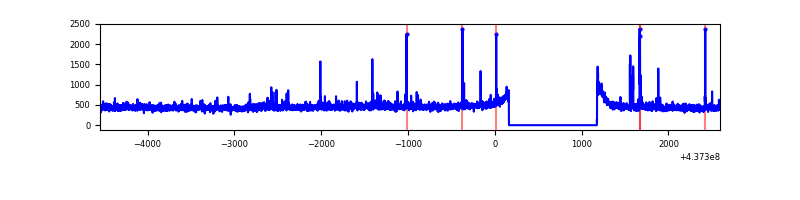 |
| D | 7142 | 6128 | 404 | 404 | 5.66% | 6.59% | 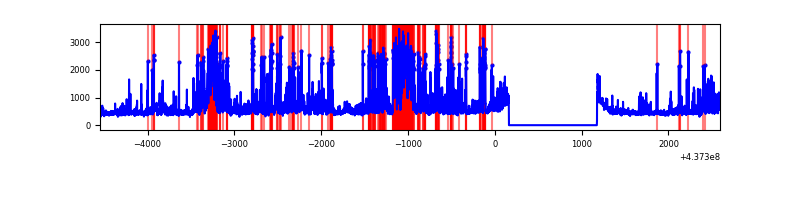 |
Top three noisy pixels from each quadrant. If the there are fewer than three noisy pixels in the level2.evt file, extra rows are filled as -1
| Pixel properties | Quadrant properties | ||||||
|---|---|---|---|---|---|---|---|
| Quadrant | DetID | PixID | Counts | Sigma | Mean | Median | Sigma |
| A | 15 | 223 | 2592189 | 18361.48 | 682 | 667 | 141.1 |
| A | 10 | 83 | 904785 | 6405.87 | 682 | 667 | 141.1 |
| A | 15 | 222 | 303805 | 2147.8 | 682 | 667 | 141.1 |
| B | 5 | 172 | 172264 | 1242.69 | 701 | 679 | 138.1 |
| B | 0 | 200 | 93216 | 670.19 | 701 | 679 | 138.1 |
| B | 0 | 199 | 40165 | 285.97 | 701 | 679 | 138.1 |
| C | 3 | 233 | 68256 | 416.6 | 688 | 691 | 162.2 |
| C | 14 | 254 | 49594 | 301.53 | 688 | 691 | 162.2 |
| C | 11 | 16 | 18072 | 107.17 | 688 | 691 | 162.2 |
| D | 5 | 235 | 516760 | 3015.37 | 674 | 651 | 171.2 |
| D | 12 | 233 | 396618 | 2313.44 | 674 | 651 | 171.2 |
| D | 2 | 249 | 289062 | 1685.04 | 674 | 651 | 171.2 |
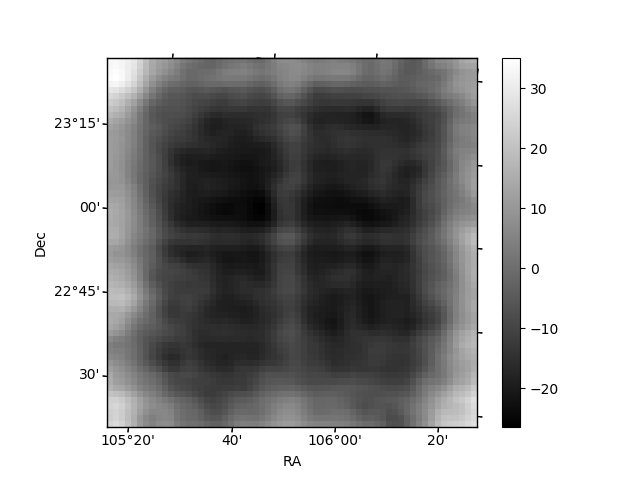
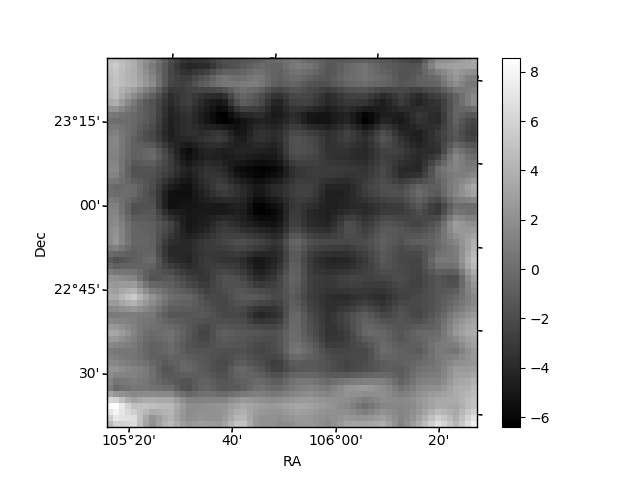
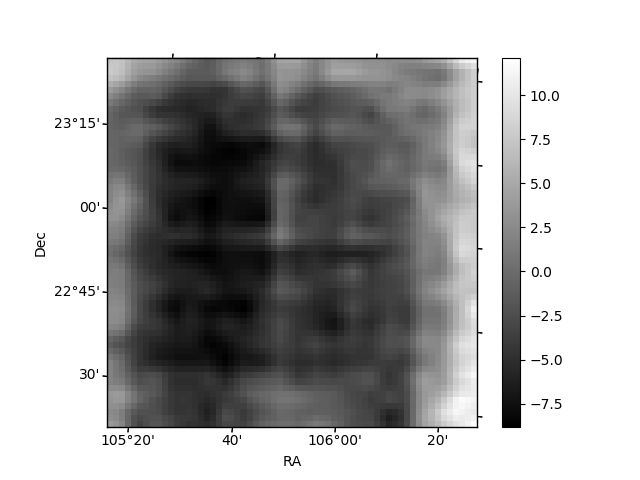
Histogram calculated using DETX and DETY for each event in the final _common_clean file
| Quadrant A | 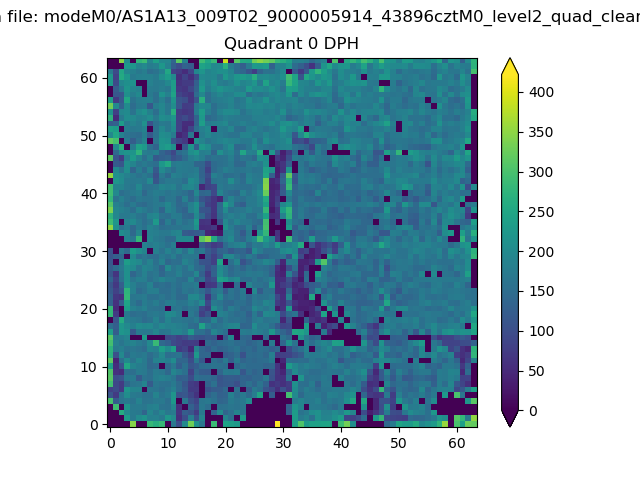 |
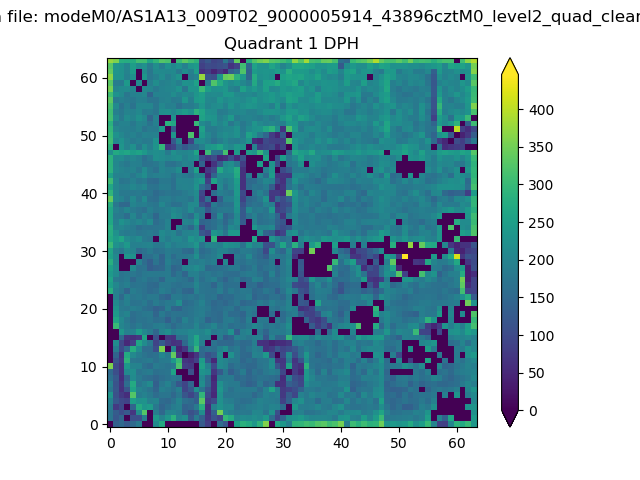 |
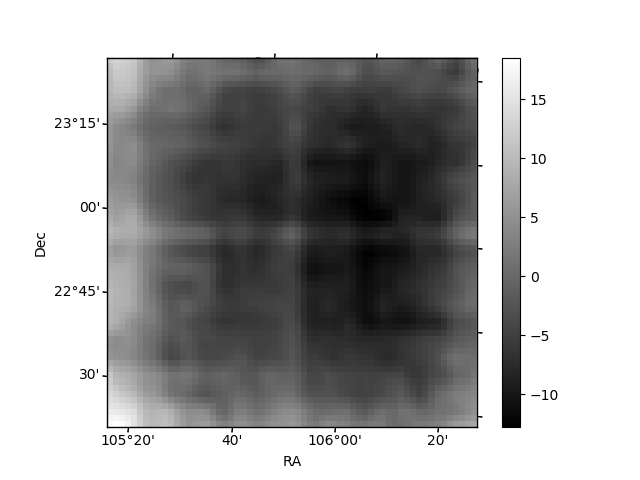
Quadrant B |
|---|---|---|---|
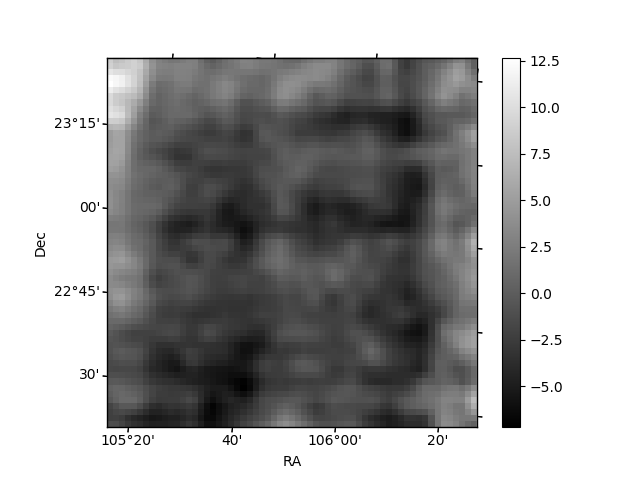
| Quadrant D | 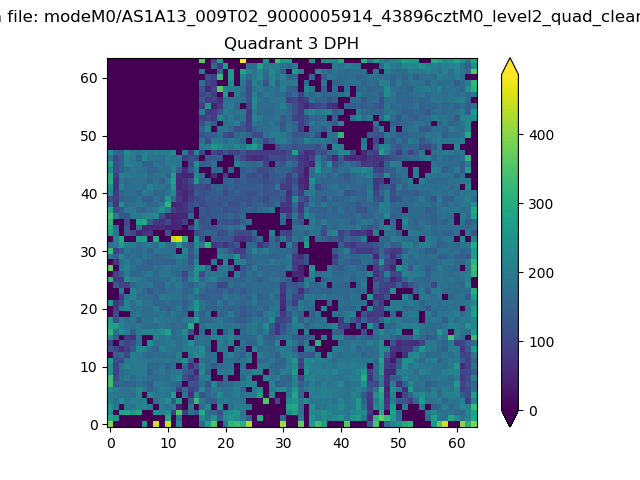 |
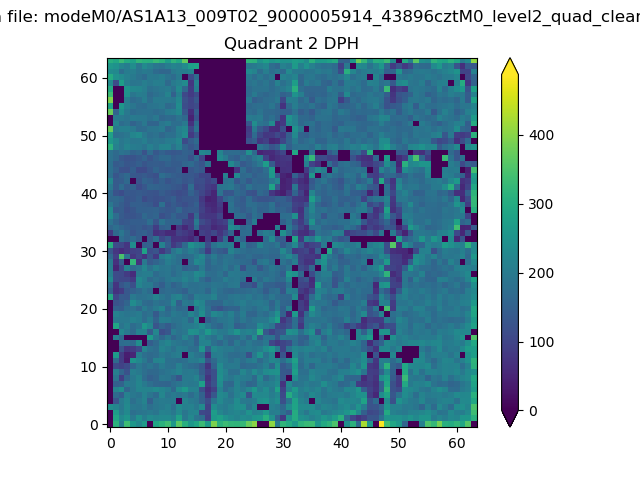 |
Quadrant C |
| Plot type | Count rate plots | Images |
|---|---|---|
| Comparison with Poisson distribution Blue bars denote a histogram of data divided into 1 sec bins. Red curve is a Poisson curve with rate = median count rate of data. |
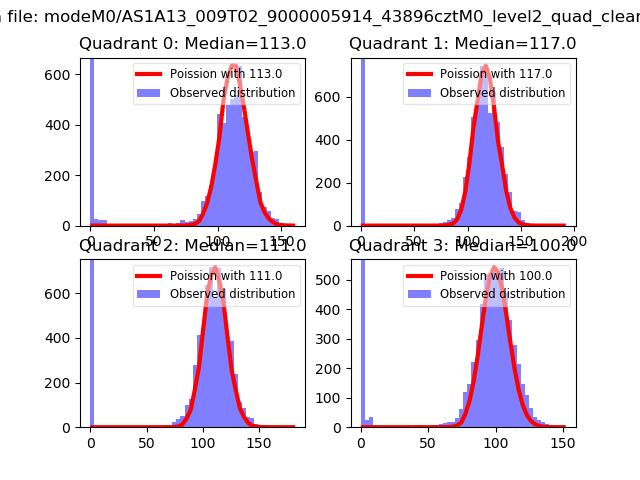 |
 |
| Quadrant-wise count rates Data is divided into 100 sec bins |
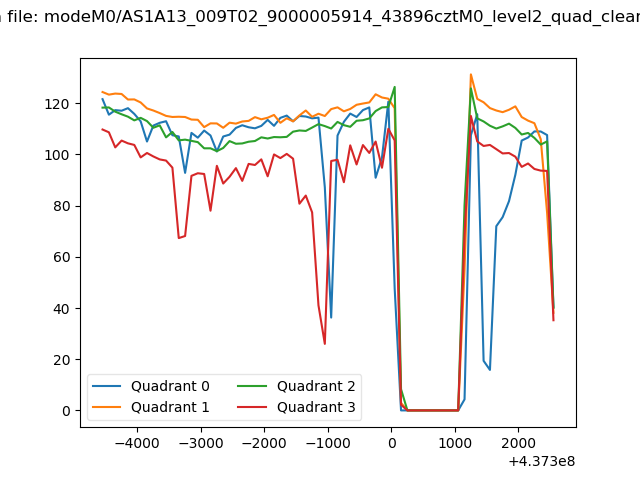 |
|
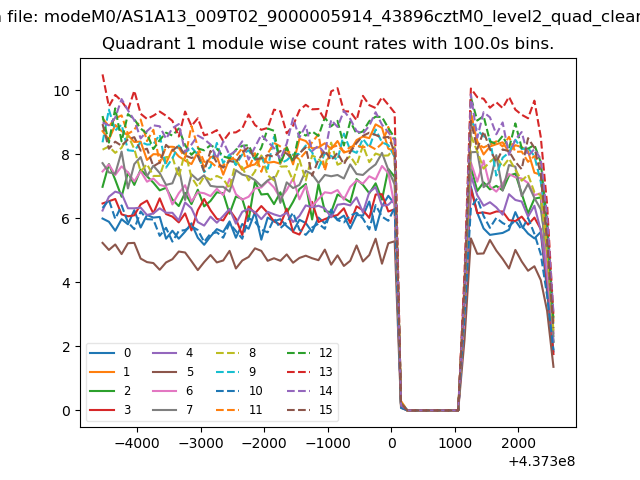
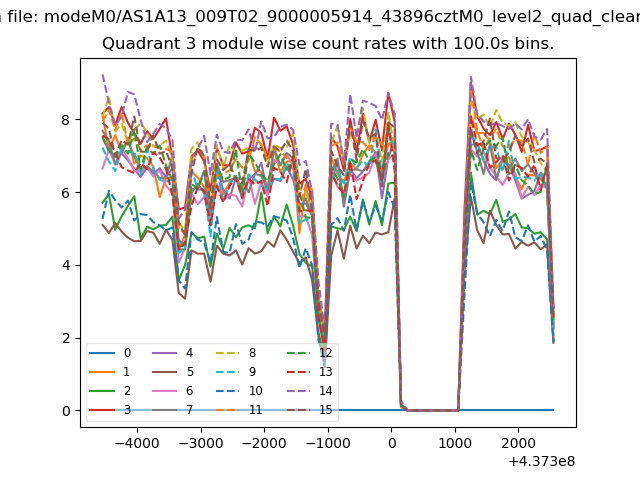
| Module-wise count rates for Quadrant A Data is divided into 100 sec bins |
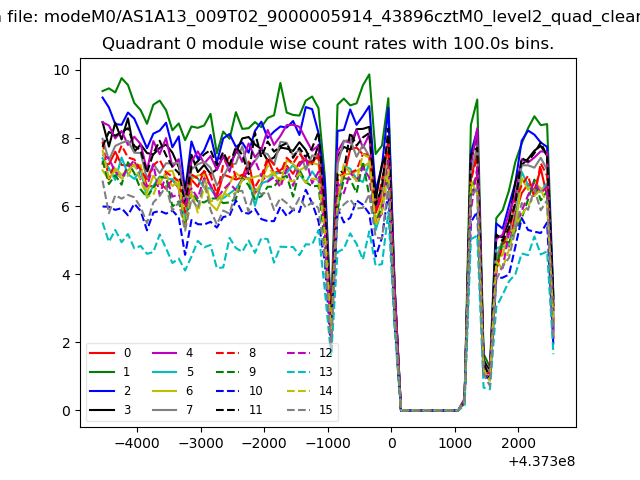 |
 |
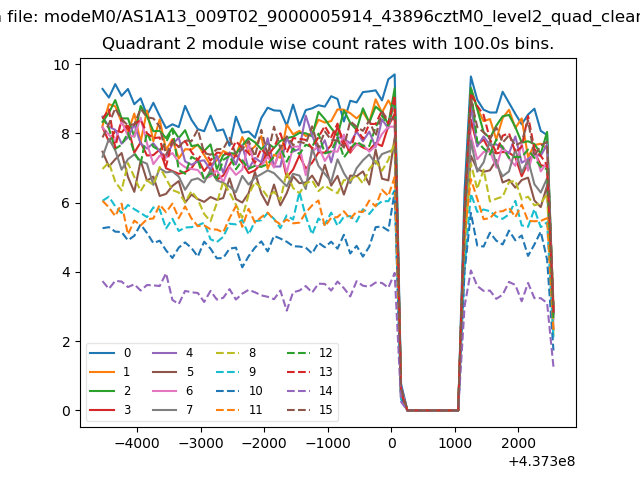
| Module-wise count rates for Quadrant B Data is divided into 100 sec bins |
 |
 |
| Module-wise count rates for Quadrant C Data is divided into 100 sec bins |
 |
 |
| Module-wise count rates for Quadrant D Data is divided into 100 sec bins |
 |
 |
| Parameter | Plot |
|---|---|
| CZT HV Monitor | 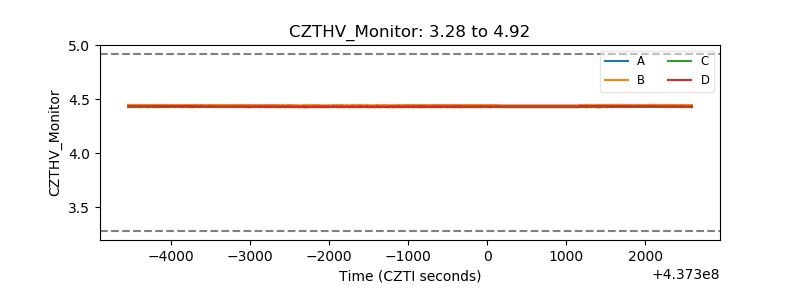 |
| D_VDD | 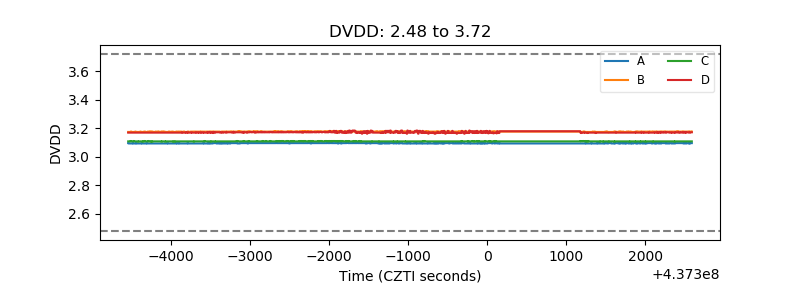 |
| Temperature 1 | 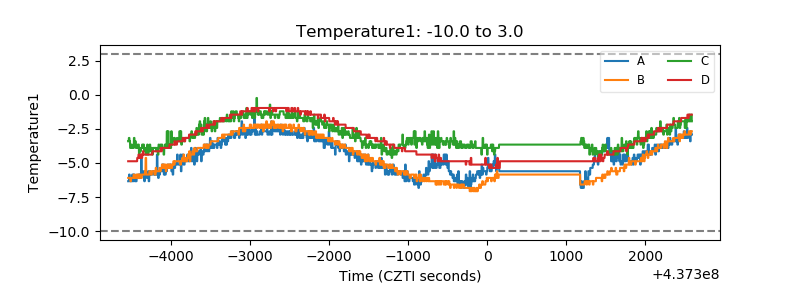 |
| Veto HV Monitor | 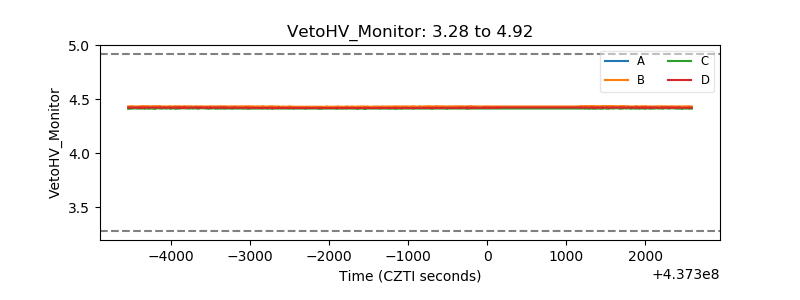 |
| Veto LLD | 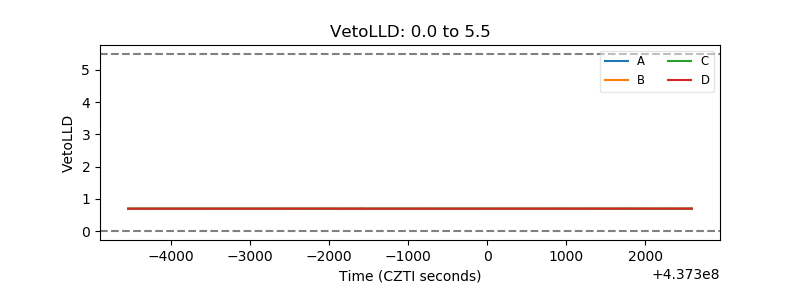 |
| Alpha Counter | 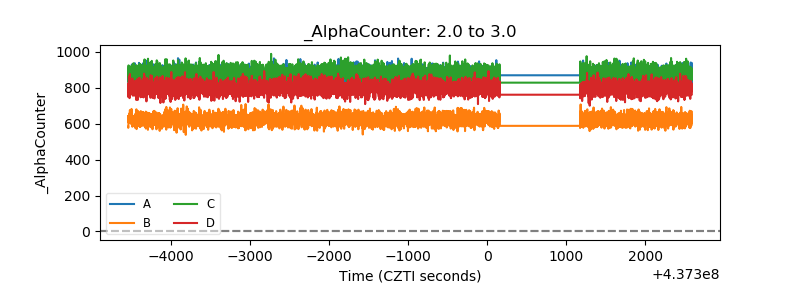 |
| _CPM_Rate | 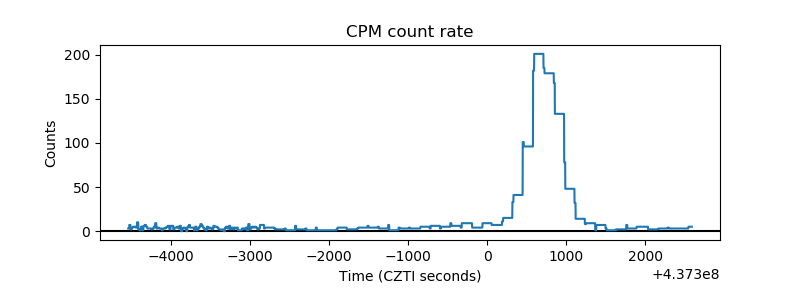 |
| CZT Counter | 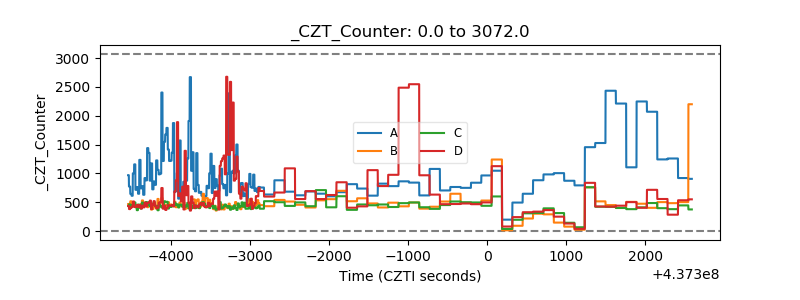 |
| +2.5 Volts monitor | 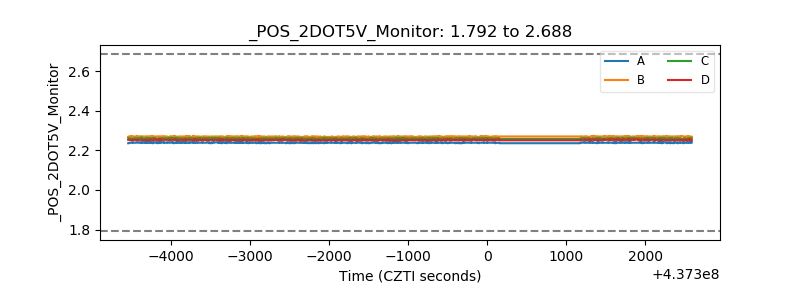 |
| +5 Volts monitor | 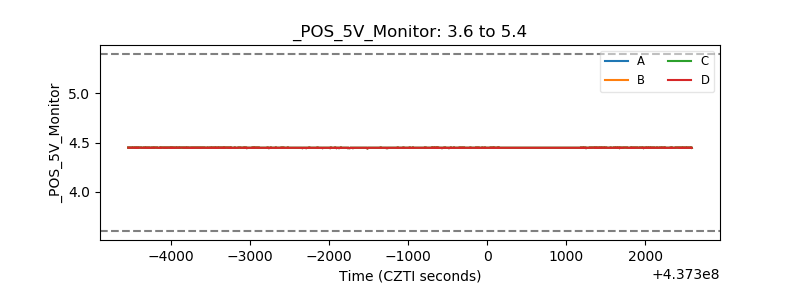 |
| _ROLL_ROT | 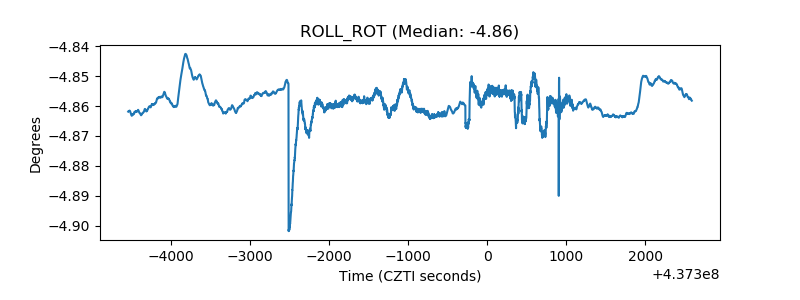 |
| _Roll_DEC | 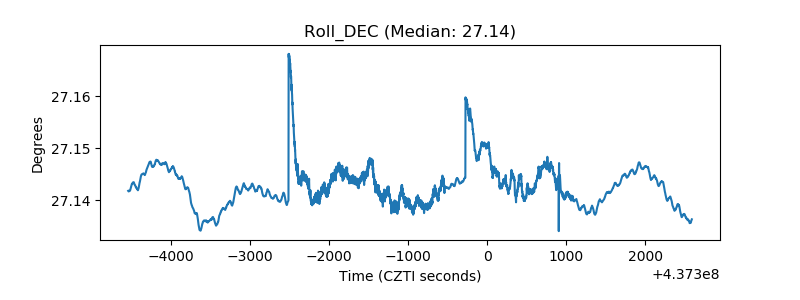 |
| _Roll_RA | 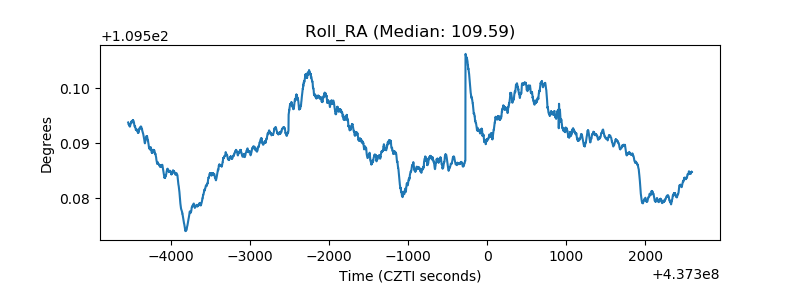 |
| Veto Counter | 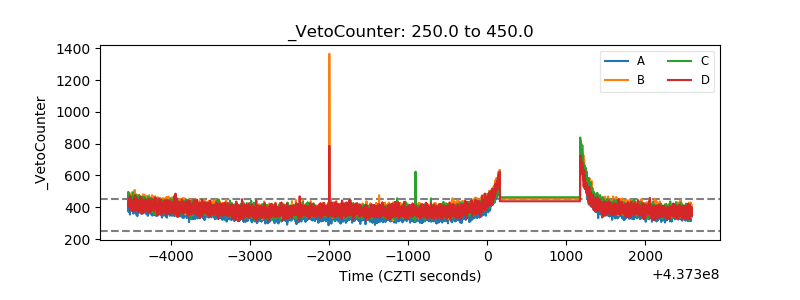 |