| Param | Original file | Final file |
|---|---|---|
| Filename | modeM0/AS1A13_009T02_9000005914_43897cztM0_level2.fits | modeM0/AS1A13_009T02_9000005914_43897cztM0_level2_quad_clean.evt |
| Size (bytes) | 521,294,400 | 106,462,080 |
| Size | 497.1 MB | 101.5 MB |
| Events in quadrant A | 6,967,527 | 661,817 |
| Events in quadrant B | 3,615,622 | 750,183 |
| Events in quadrant C | 3,165,378 | 714,422 |
| Events in quadrant D | 5,026,173 | 628,184 |
| Mode M9 | |||
|---|---|---|---|
| Quadrant | BADHDUFLAG | Total packets | Discarded packets |
| A | 0 | 7 | 0 |
| B | 0 | 7 | 0 |
| C | 0 | 7 | 0 |
| D | 0 | 7 | 0 |
| Mode SS | |||
|---|---|---|---|
| Quadrant | BADHDUFLAG | Total packets | Discarded packets |
| A | 0 | 138 | 0 |
| B | 0 | 138 | 0 |
| C | 0 | 138 | 0 |
| D | 0 | 138 | 0 |
| Mode M0 | |||
|---|---|---|---|
| Quadrant | BADHDUFLAG | Total packets | Discarded packets |
| A | 0 | 25897 | 1 |
| B | 0 | 15175 | 1 |
| C | 0 | 14177 | 1 |
| D | 0 | 19414 | 1 |
| Quadrant | Total seconds | Saturated seconds | Saturation percentage |
|---|---|---|---|
| A | 6722 | 847 | 12.600417% |
| B | 6723 | 147 | 2.186524% |
| C | 6723 | 67 | 0.996579% |
| D | 6723 | 412 | 6.128217% |
Noise dominated data is calculated using 1-second bins in cleaned event files. If a bin has >2000 counts, and if more than 50% of those come from <1% of pixels, then it is considered to be noise-dominated and hence unusable.
| Quadrant | # 1 sec bins | Bins with >0 counts | Bins with >2000 counts | High rate bins dominated by noise | Noise dominated (total time) | Noise dominated (detector-on time) | Marked lightcurve |
|---|---|---|---|---|---|---|---|
| A | 7442 | 6723 | 496 | 496 | 6.66% | 7.38% | 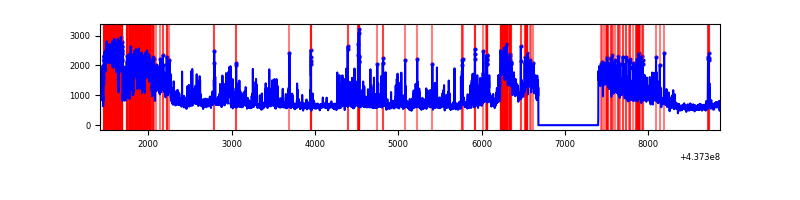 |
| B | 7443 | 6724 | 52 | 52 | 0.70% | 0.77% | 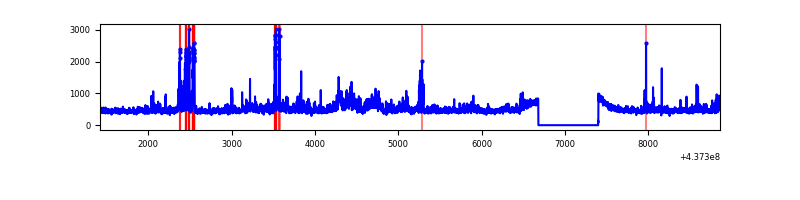 |
| C | 7443 | 6724 | 19 | 19 | 0.26% | 0.28% | 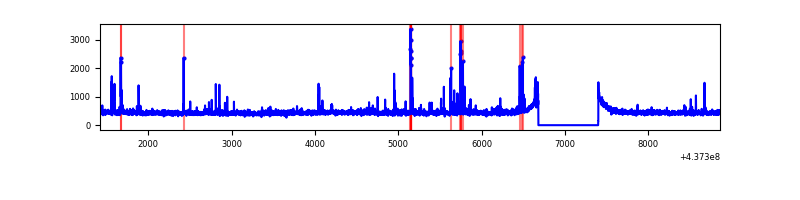 |
| D | 7443 | 6724 | 390 | 390 | 5.24% | 5.80% | 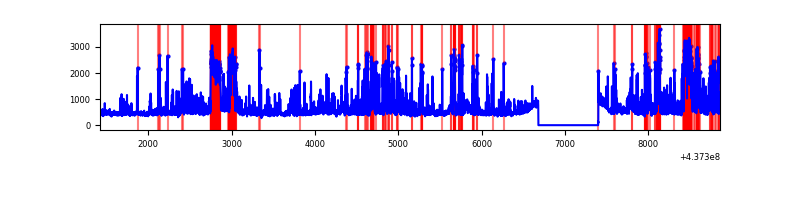 |
Top three noisy pixels from each quadrant. If the there are fewer than three noisy pixels in the level2.evt file, extra rows are filled as -1
| Pixel properties | Quadrant properties | ||||||
|---|---|---|---|---|---|---|---|
| Quadrant | DetID | PixID | Counts | Sigma | Mean | Median | Sigma |
| A | 15 | 223 | 2036370 | 13298.91 | 739 | 723 | 153.1 |
| A | 10 | 83 | 1030282 | 6726.12 | 739 | 723 | 153.1 |
| A | 15 | 222 | 976728 | 6376.26 | 739 | 723 | 153.1 |
| B | 0 | 200 | 173073 | 1152.25 | 758 | 735 | 149.6 |
| B | 5 | 172 | 165424 | 1101.11 | 758 | 735 | 149.6 |
| B | 5 | 235 | 109469 | 727.0 | 758 | 735 | 149.6 |
| C | 14 | 254 | 98535 | 553.98 | 745 | 749 | 176.5 |
| C | 3 | 233 | 72915 | 408.84 | 745 | 749 | 176.5 |
| C | 15 | 158 | 35628 | 197.6 | 745 | 749 | 176.5 |
| D | 5 | 235 | 607637 | 3253.45 | 737 | 714 | 186.5 |
| D | 7 | 80 | 480215 | 2570.4 | 737 | 714 | 186.5 |
| D | 1 | 52 | 319904 | 1711.04 | 737 | 714 | 186.5 |
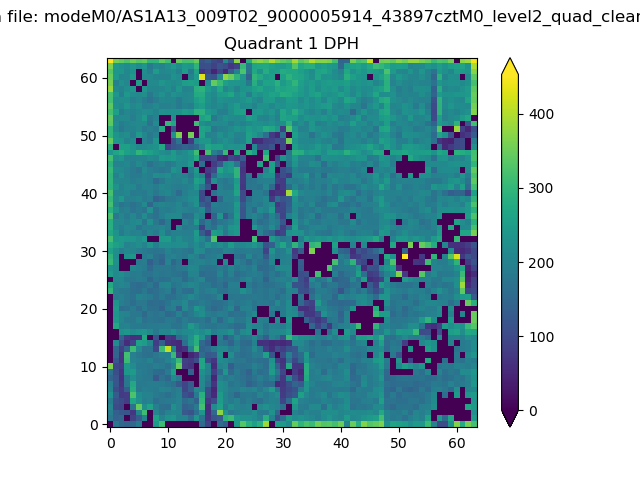
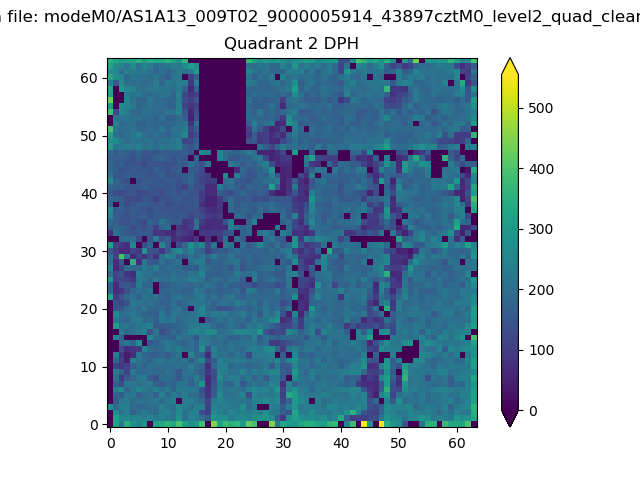
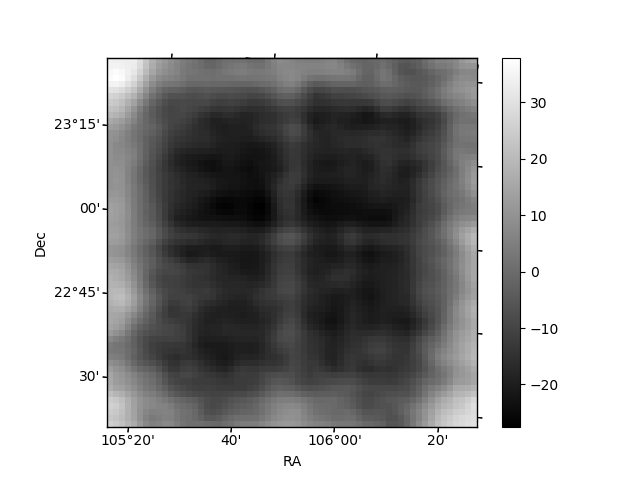
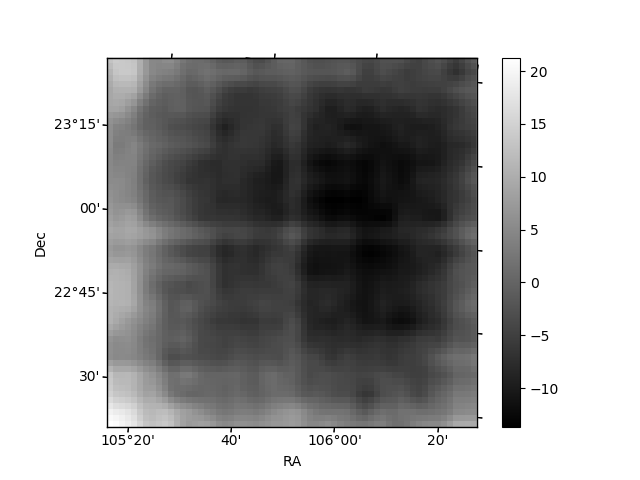
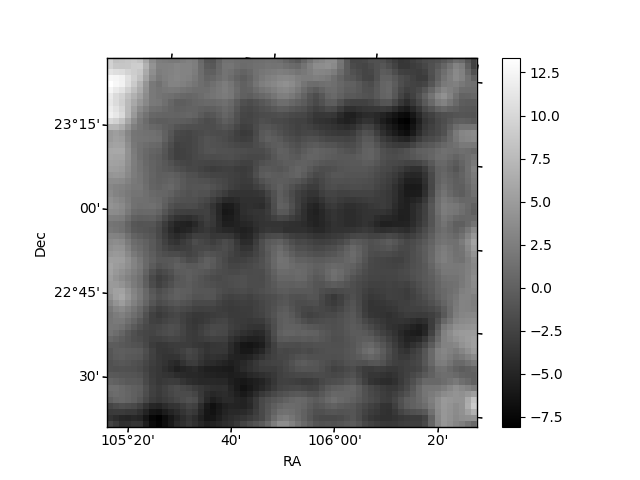
Histogram calculated using DETX and DETY for each event in the final _common_clean file
| Quadrant A |  |
 |
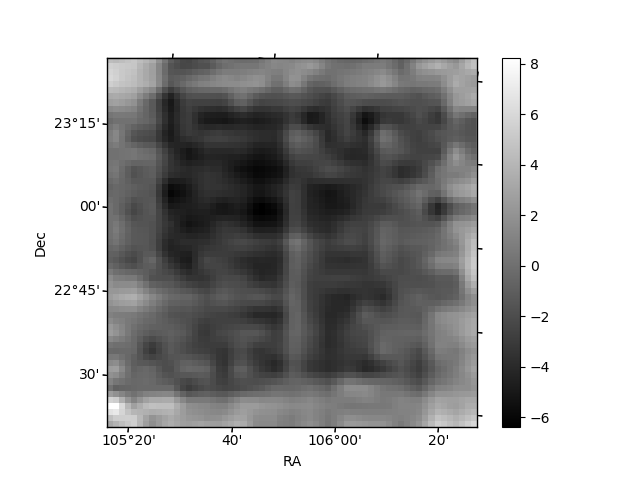
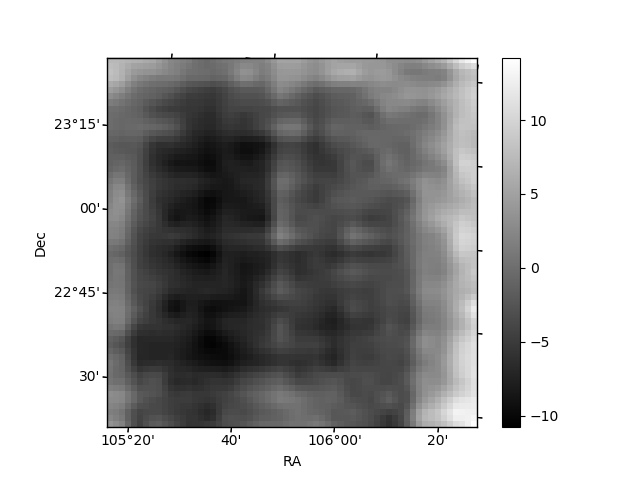
Quadrant B |
|---|---|---|---|
| Quadrant D | 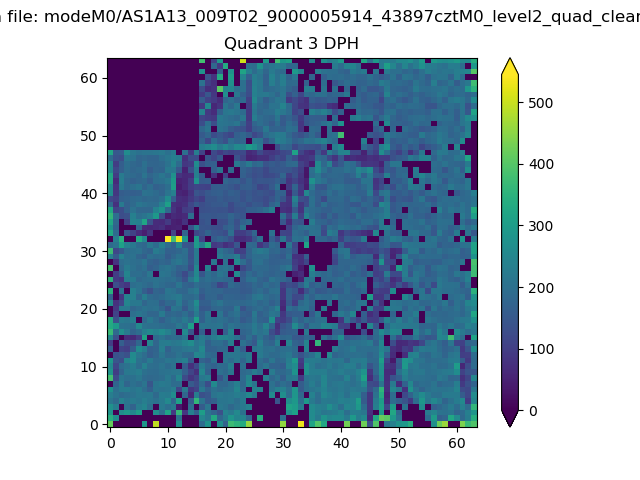 |
 |
Quadrant C |
| Plot type | Count rate plots | Images |
|---|---|---|
| Comparison with Poisson distribution Blue bars denote a histogram of data divided into 1 sec bins. Red curve is a Poisson curve with rate = median count rate of data. |
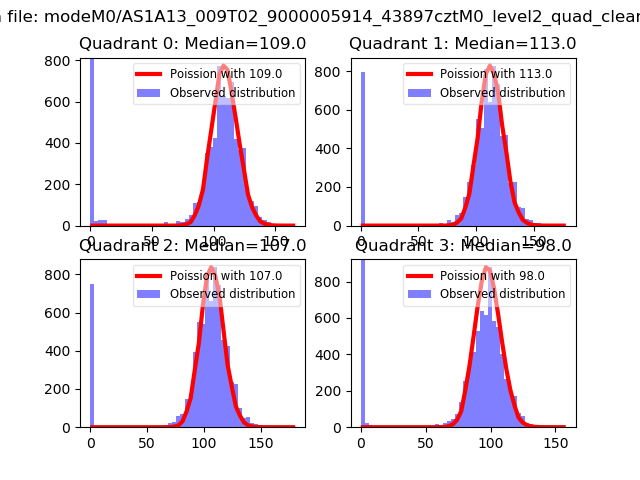 |
 |
| Quadrant-wise count rates Data is divided into 100 sec bins |
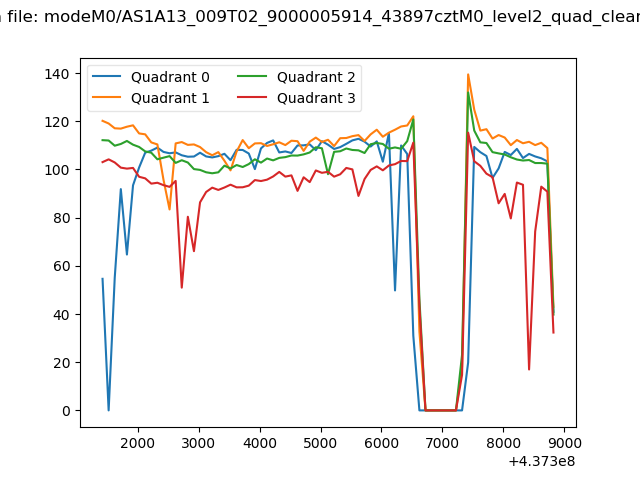 |
|
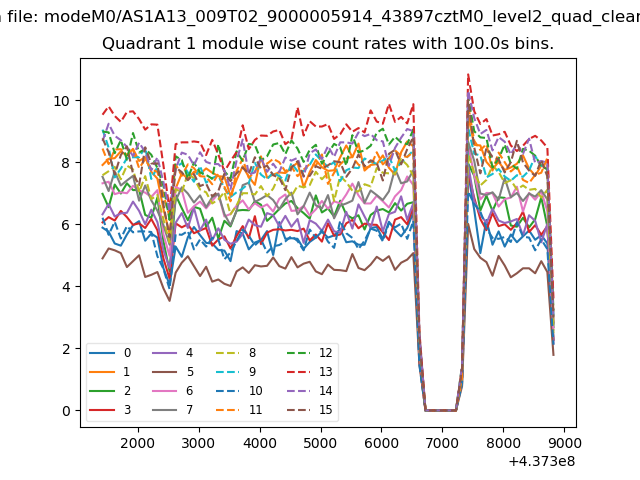
| Module-wise count rates for Quadrant A Data is divided into 100 sec bins |
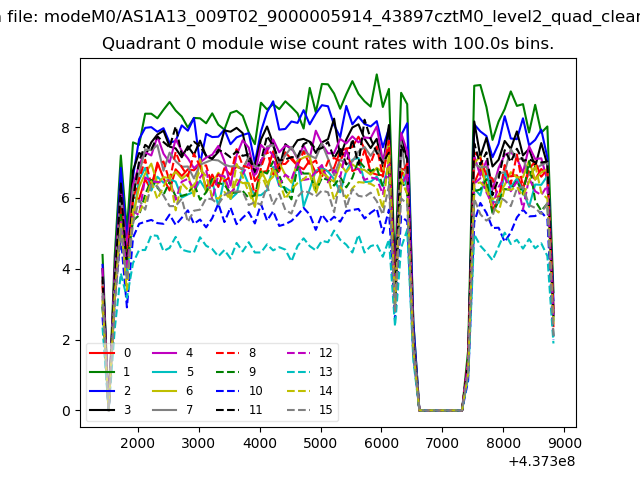 |
 |
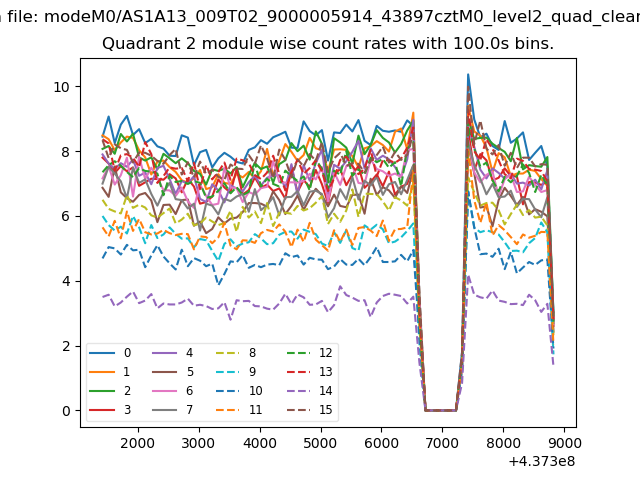
| Module-wise count rates for Quadrant B Data is divided into 100 sec bins |
 |
 |
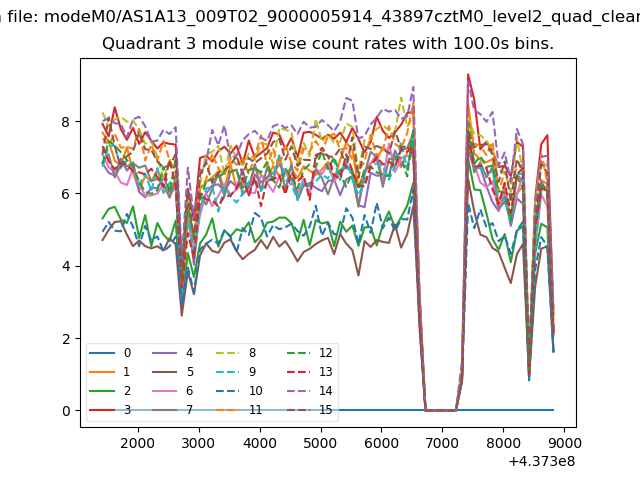
| Module-wise count rates for Quadrant C Data is divided into 100 sec bins |
 |
 |
| Module-wise count rates for Quadrant D Data is divided into 100 sec bins |
 |
 |
| Parameter | Plot |
|---|---|
| CZT HV Monitor | 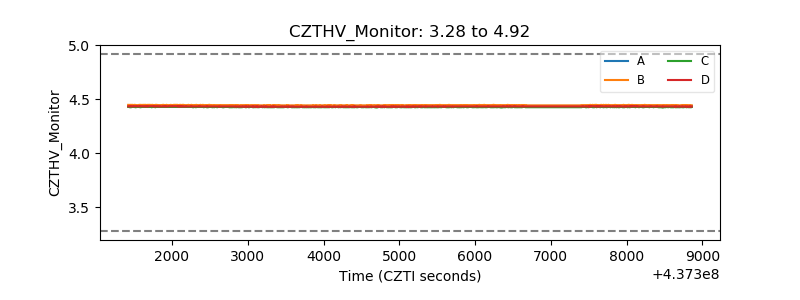 |
| D_VDD | 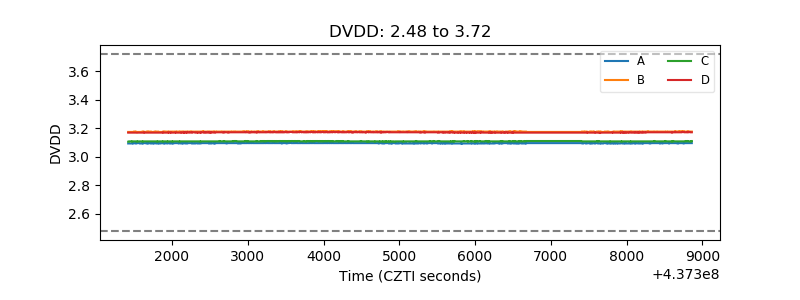 |
| Temperature 1 | 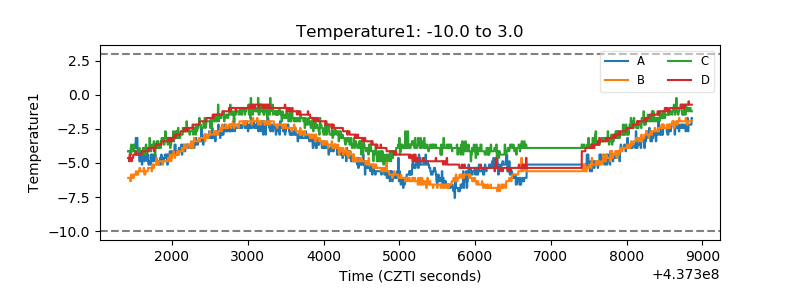 |
| Veto HV Monitor | 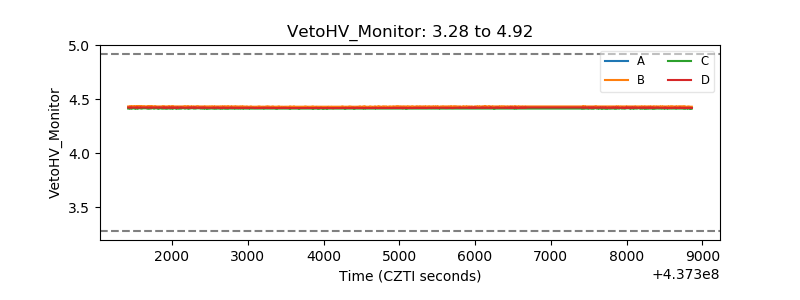 |
| Veto LLD | 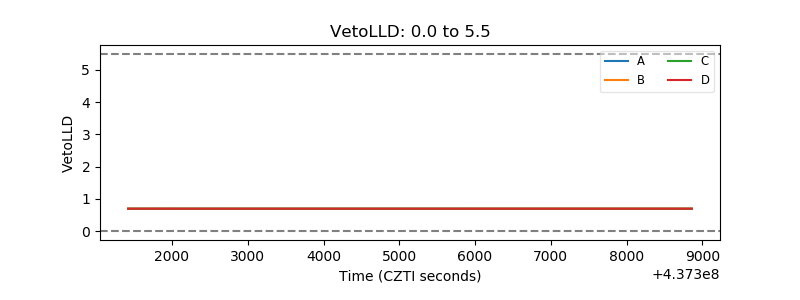 |
| Alpha Counter | 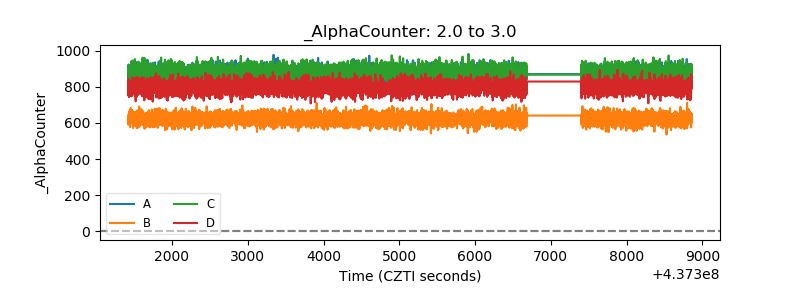 |
| _CPM_Rate | 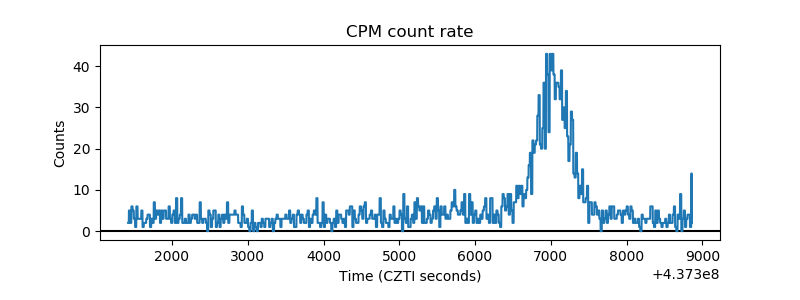 |
| CZT Counter | 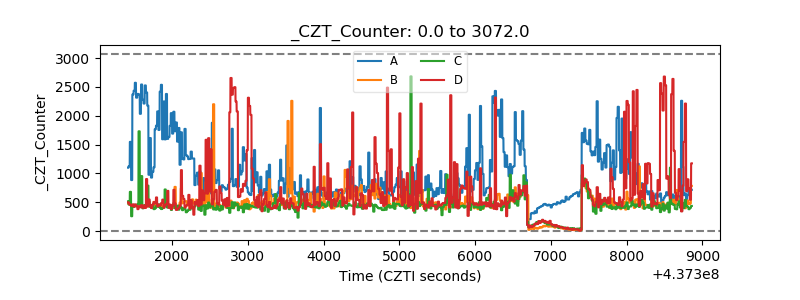 |
| +2.5 Volts monitor | 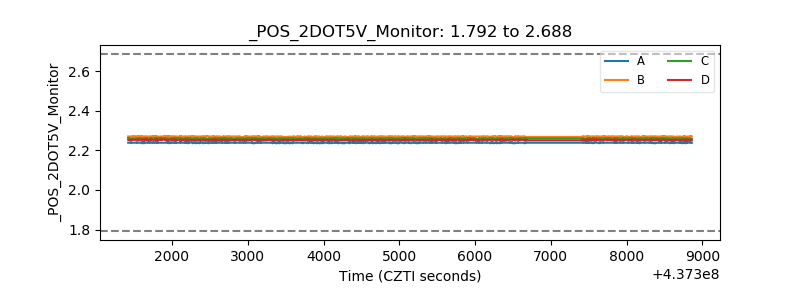 |
| +5 Volts monitor | 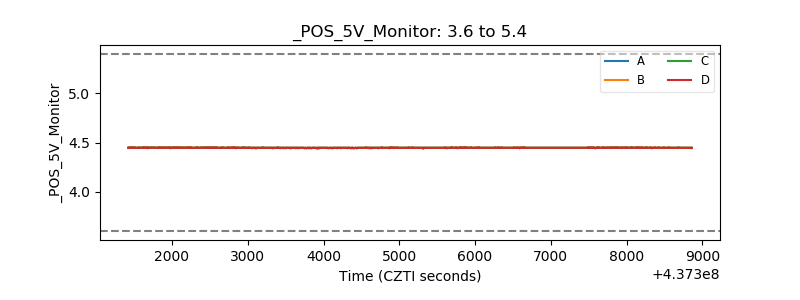 |
| _ROLL_ROT | 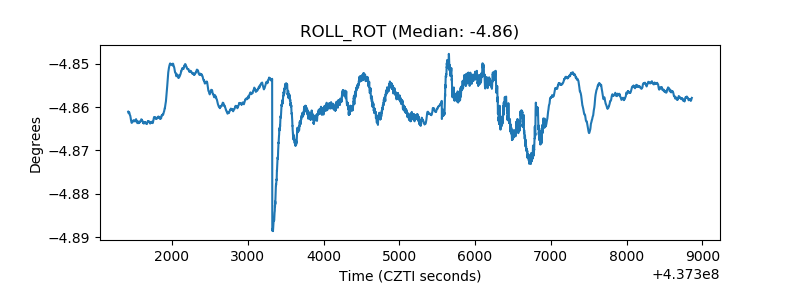 |
| _Roll_DEC | 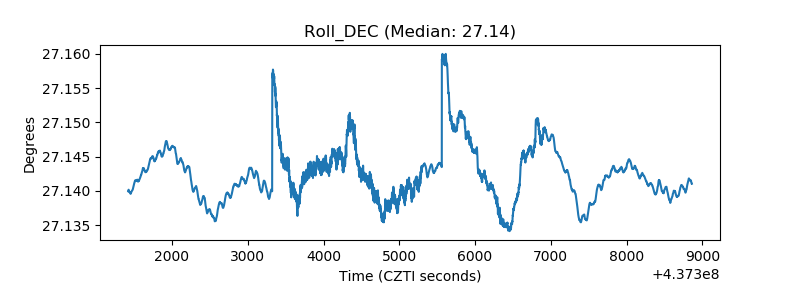 |
| _Roll_RA | 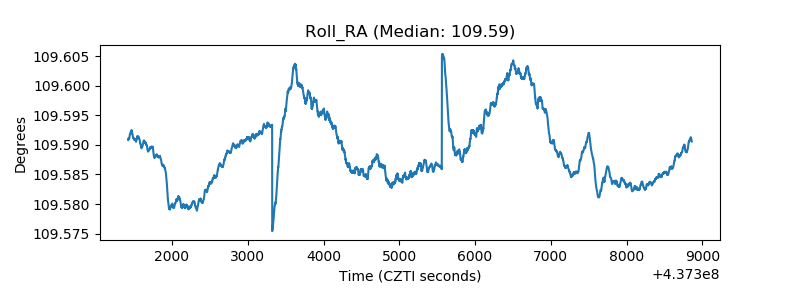 |
| Veto Counter | 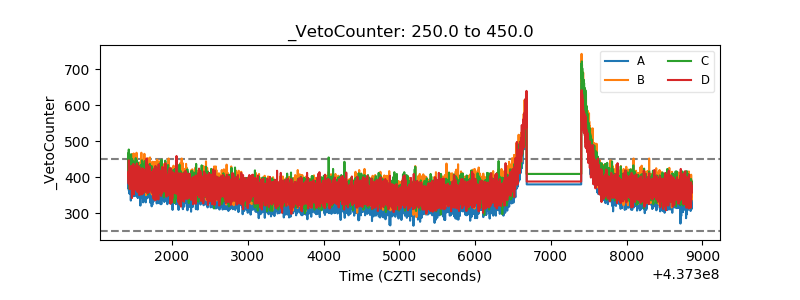 |