| Param | Original file | Final file |
|---|---|---|
| Filename | modeM0/AS1A13_009T02_9000005914_43898cztM0_level2.fits | modeM0/AS1A13_009T02_9000005914_43898cztM0_level2_quad_clean.evt |
| Size (bytes) | 622,440,000 | 124,280,640 |
| Size | 593.6 MB | 118.5 MB |
| Events in quadrant A | 7,188,983 | 776,137 |
| Events in quadrant B | 4,282,854 | 874,704 |
| Events in quadrant C | 4,078,887 | 837,405 |
| Events in quadrant D | 6,861,816 | 712,548 |
| Mode M9 | |||
|---|---|---|---|
| Quadrant | BADHDUFLAG | Total packets | Discarded packets |
| A | 0 | 1 | 0 |
| B | 0 | 2 | 0 |
| C | 0 | 2 | 0 |
| D | 0 | 2 | 0 |
| Mode SS | |||
|---|---|---|---|
| Quadrant | BADHDUFLAG | Total packets | Discarded packets |
| A | 0 | 162 | 0 |
| B | 0 | 162 | 0 |
| C | 0 | 162 | 0 |
| D | 0 | 162 | 0 |
| Mode M0 | |||
|---|---|---|---|
| Quadrant | BADHDUFLAG | Total packets | Discarded packets |
| A | 0 | 27326 | 2 |
| B | 0 | 17989 | 2 |
| C | 0 | 17827 | 2 |
| D | 0 | 25930 | 2 |
| Quadrant | Total seconds | Saturated seconds | Saturation percentage |
|---|---|---|---|
| A | 8094 | 1052 | 12.997282% |
| B | 8094 | 349 | 4.311836% |
| C | 8093 | 250 | 3.089089% |
| D | 8093 | 915 | 11.306067% |
Noise dominated data is calculated using 1-second bins in cleaned event files. If a bin has >2000 counts, and if more than 50% of those come from <1% of pixels, then it is considered to be noise-dominated and hence unusable.
| Quadrant | # 1 sec bins | Bins with >0 counts | Bins with >2000 counts | High rate bins dominated by noise | Noise dominated (total time) | Noise dominated (detector-on time) | Marked lightcurve |
|---|---|---|---|---|---|---|---|
| A | 8109 | 8095 | 428 | 428 | 5.28% | 5.29% | 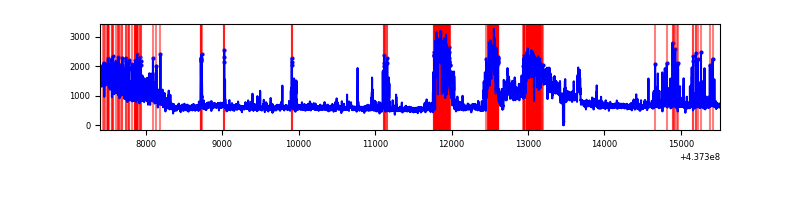 |
| B | 8109 | 8095 | 26 | 26 | 0.32% | 0.32% | 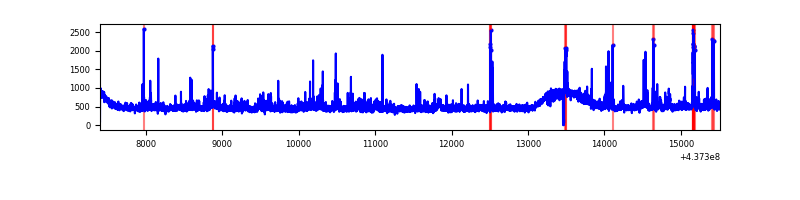 |
| C | 8108 | 8094 | 15 | 15 | 0.19% | 0.19% | 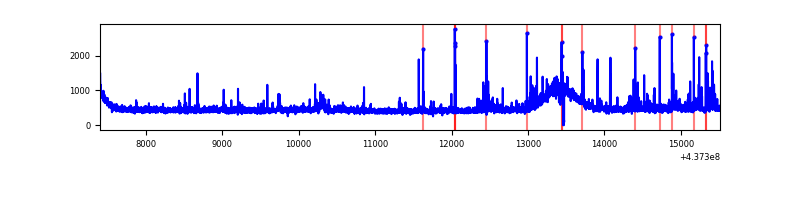 |
| D | 8108 | 8094 | 594 | 594 | 7.33% | 7.34% | 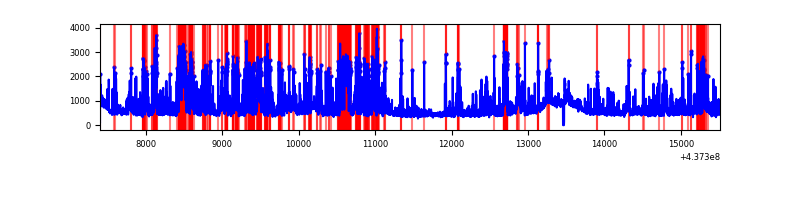 |
Top three noisy pixels from each quadrant. If the there are fewer than three noisy pixels in the level2.evt file, extra rows are filled as -1
| Pixel properties | Quadrant properties | ||||||
|---|---|---|---|---|---|---|---|
| Quadrant | DetID | PixID | Counts | Sigma | Mean | Median | Sigma |
| A | 15 | 223 | 2060371 | 10649.52 | 927 | 906 | 193.4 |
| A | 10 | 83 | 1202210 | 6211.96 | 927 | 906 | 193.4 |
| A | 15 | 222 | 216848 | 1116.64 | 927 | 906 | 193.4 |
| B | 0 | 200 | 151437 | 783.14 | 951 | 921 | 192.2 |
| B | 5 | 172 | 68496 | 351.59 | 951 | 921 | 192.2 |
| B | 5 | 235 | 66975 | 343.68 | 951 | 921 | 192.2 |
| C | 14 | 254 | 145172 | 645.1 | 942 | 945 | 223.6 |
| C | 3 | 233 | 135505 | 601.86 | 942 | 945 | 223.6 |
| C | 15 | 158 | 53610 | 235.56 | 942 | 945 | 223.6 |
| D | 5 | 235 | 995118 | 4251.48 | 916 | 884 | 233.9 |
| D | 13 | 171 | 581972 | 2484.81 | 916 | 884 | 233.9 |
| D | 1 | 52 | 404229 | 1724.76 | 916 | 884 | 233.9 |
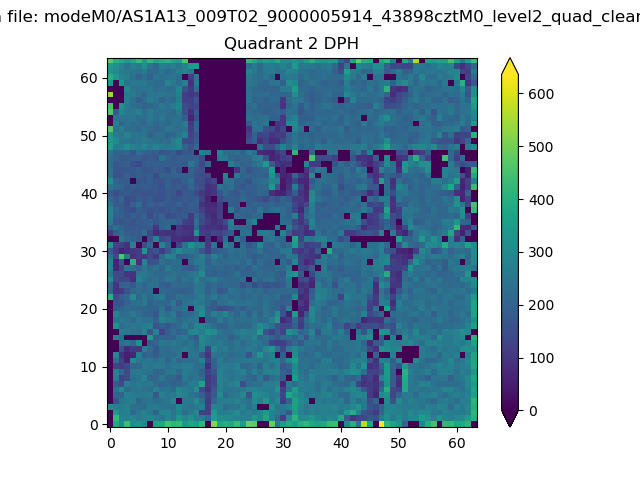
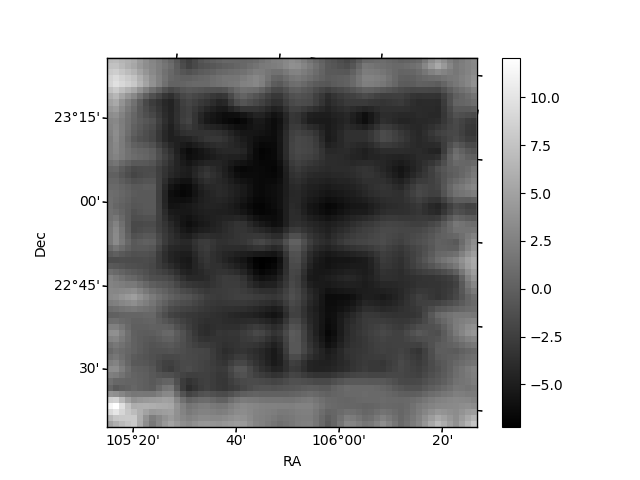
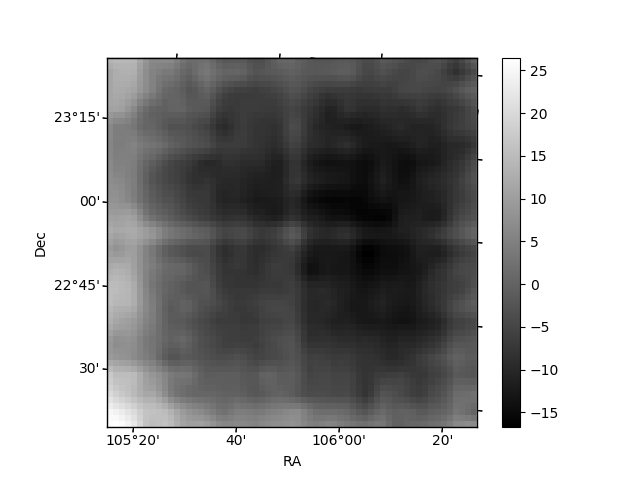
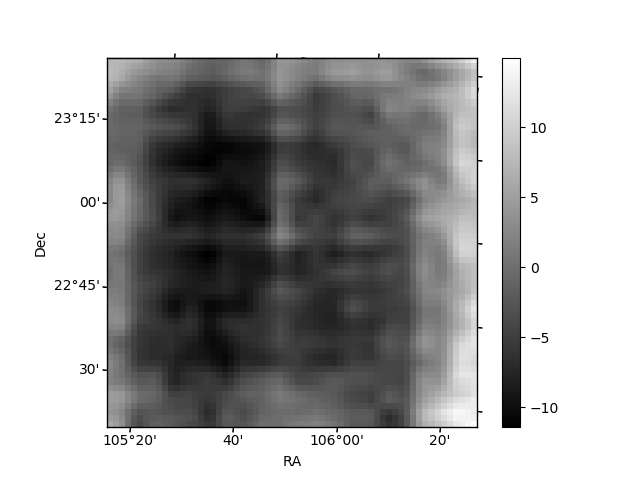
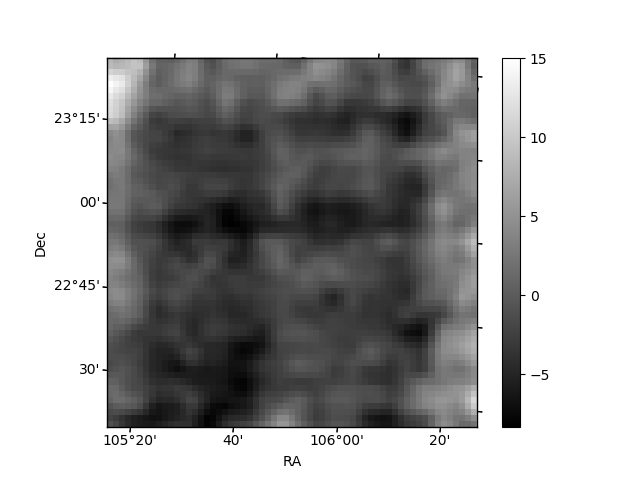
Histogram calculated using DETX and DETY for each event in the final _common_clean file
| Quadrant A | 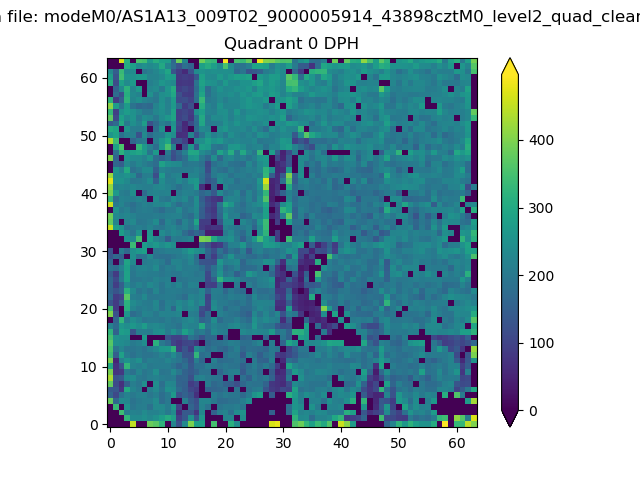 |
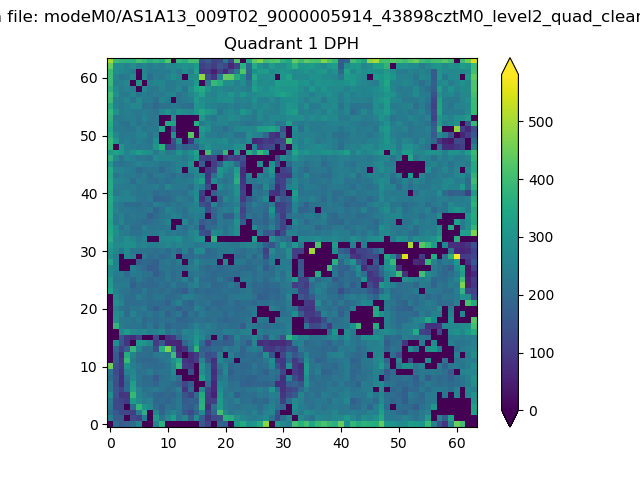 |
Quadrant B |
|---|---|---|---|
| Quadrant D | 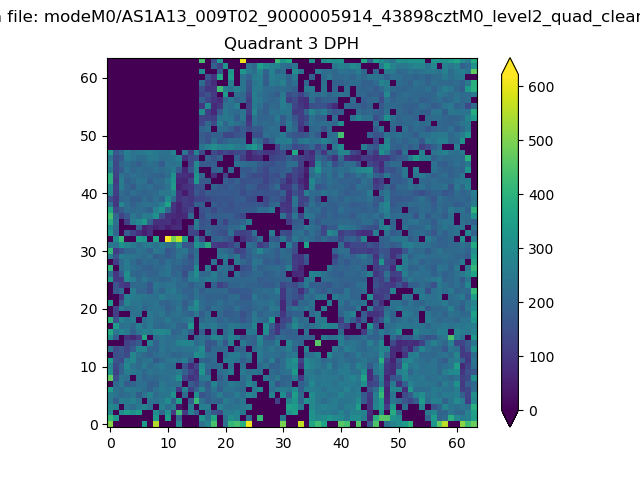 |
 |
Quadrant C |
| Plot type | Count rate plots | Images |
|---|---|---|
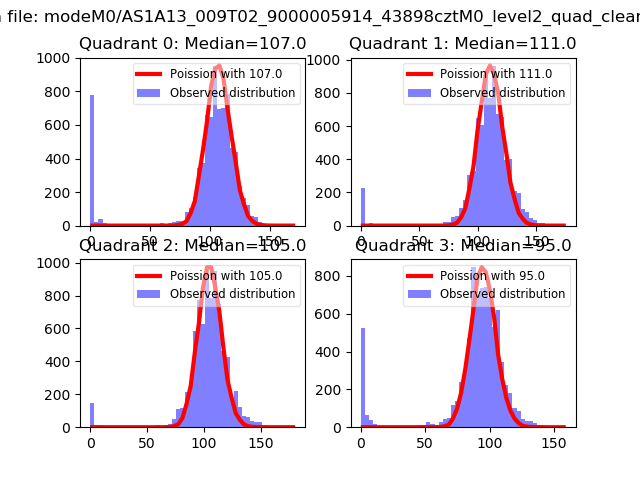
| Comparison with Poisson distribution Blue bars denote a histogram of data divided into 1 sec bins. Red curve is a Poisson curve with rate = median count rate of data. |
 |
 |
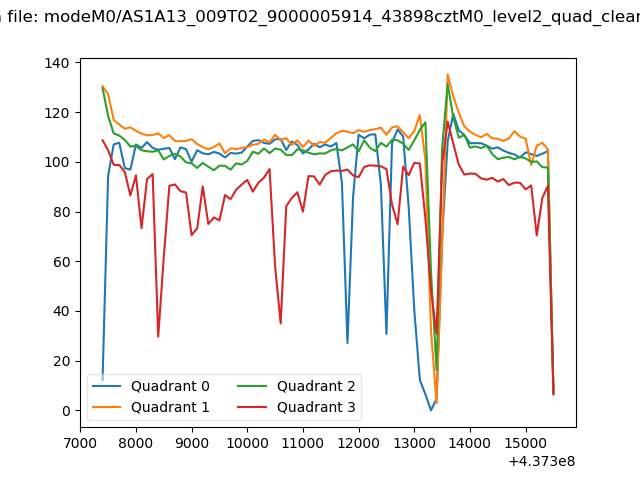
| Quadrant-wise count rates Data is divided into 100 sec bins |
 |
|
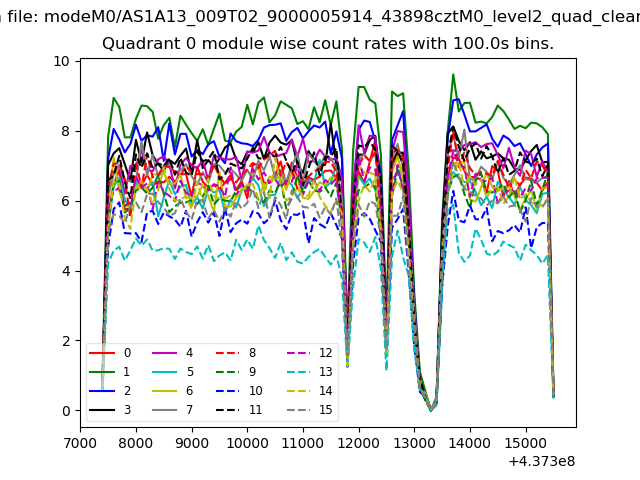
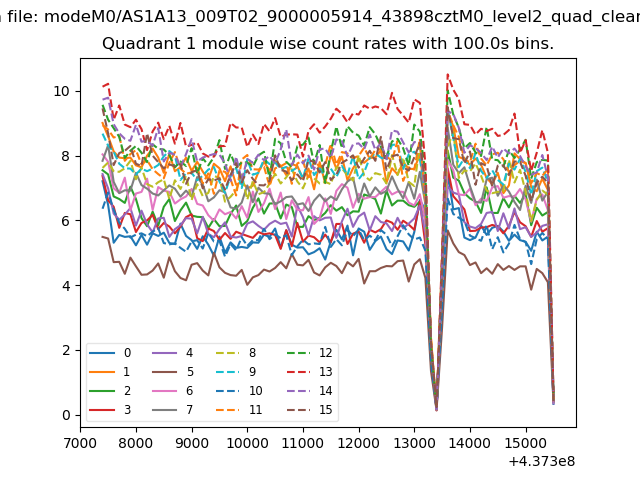
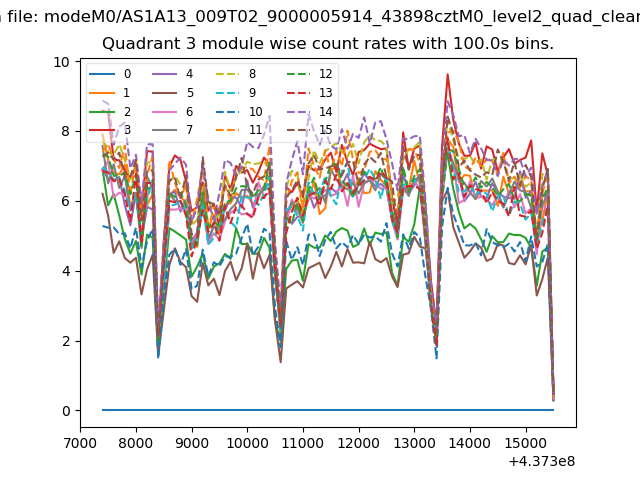
| Module-wise count rates for Quadrant A Data is divided into 100 sec bins |
 |
 |
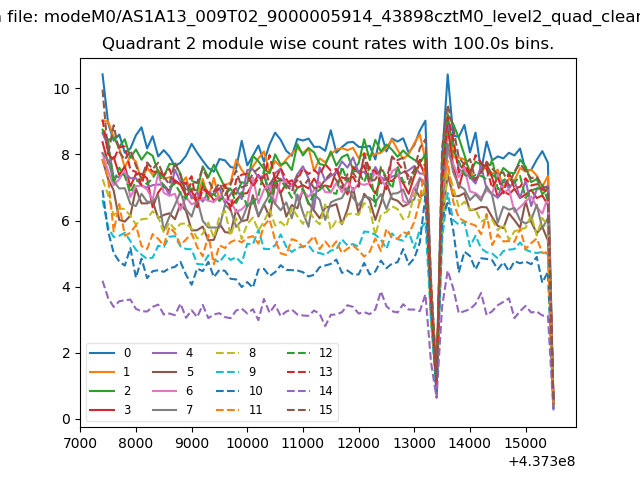
| Module-wise count rates for Quadrant B Data is divided into 100 sec bins |
 |
 |
| Module-wise count rates for Quadrant C Data is divided into 100 sec bins |
 |
 |
| Module-wise count rates for Quadrant D Data is divided into 100 sec bins |
 |
 |
| Parameter | Plot |
|---|---|
| CZT HV Monitor | 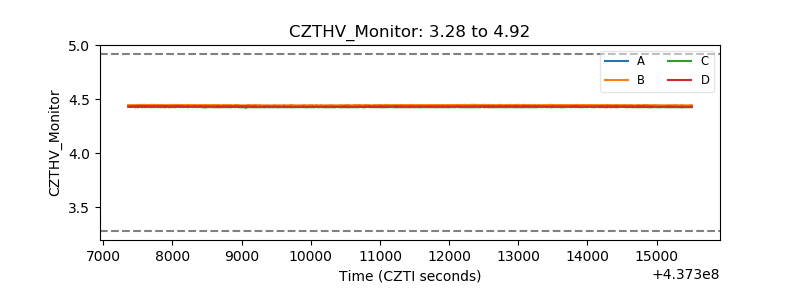 |
| D_VDD | 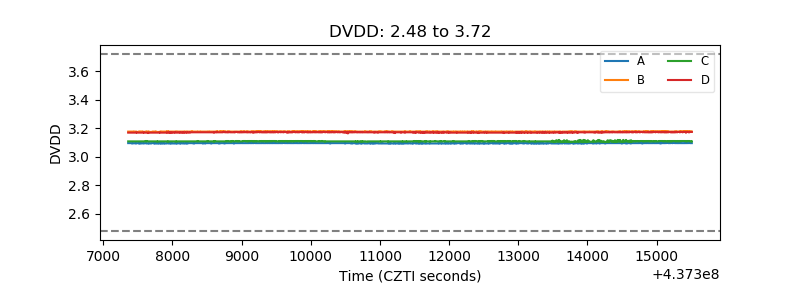 |
| Temperature 1 | 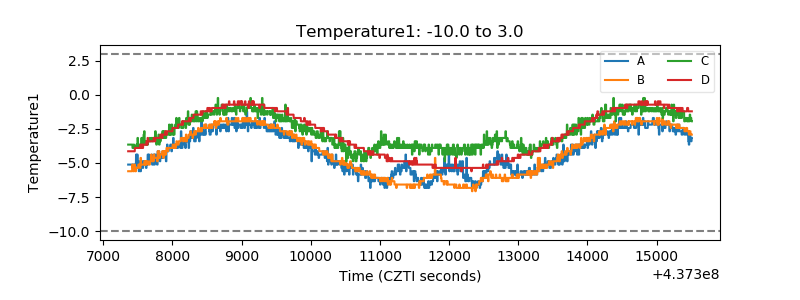 |
| Veto HV Monitor | 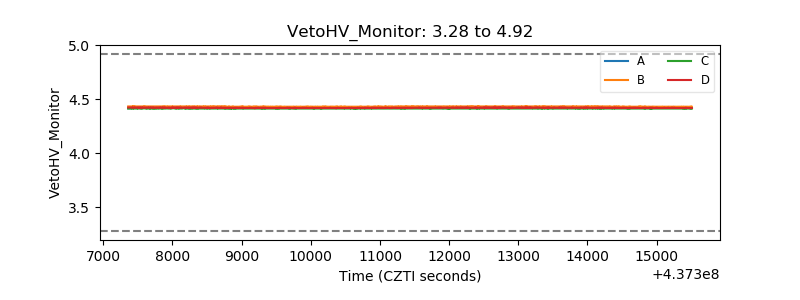 |
| Veto LLD | 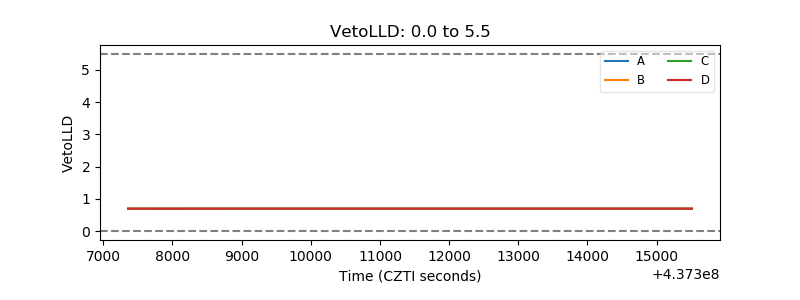 |
| Alpha Counter | 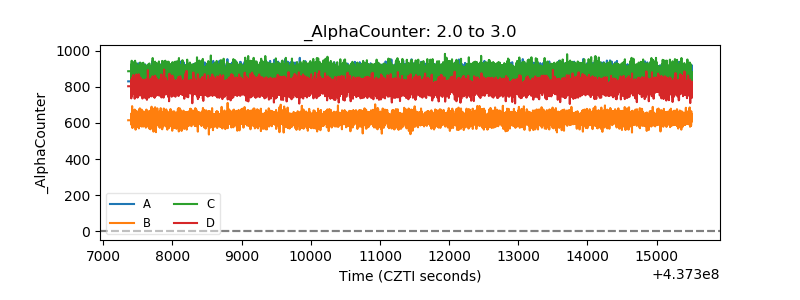 |
| _CPM_Rate | 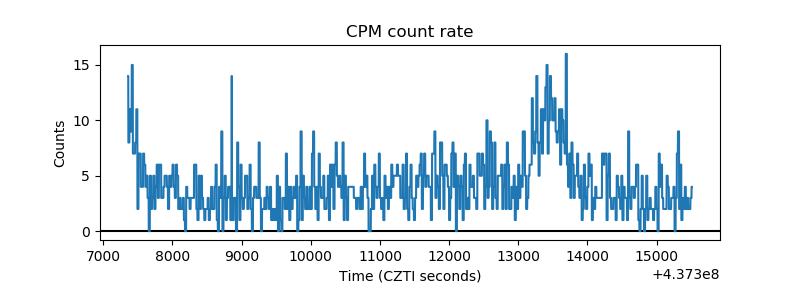 |
| CZT Counter | 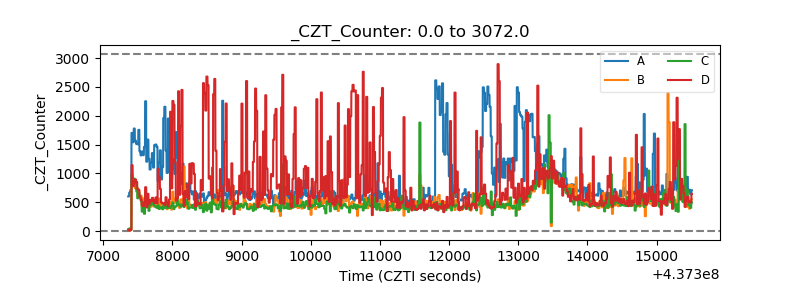 |
| +2.5 Volts monitor | 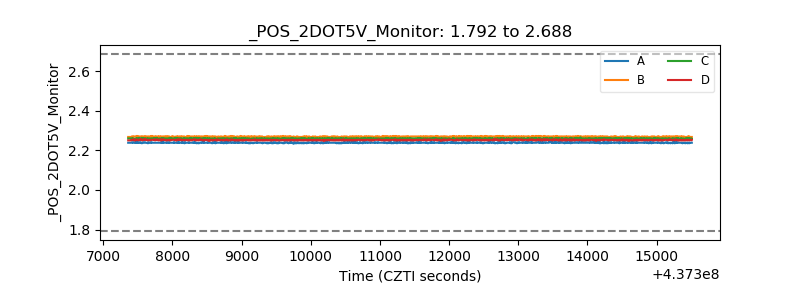 |
| +5 Volts monitor | 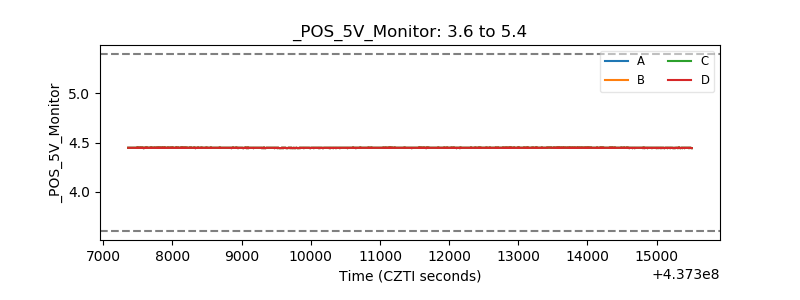 |
| _ROLL_ROT | 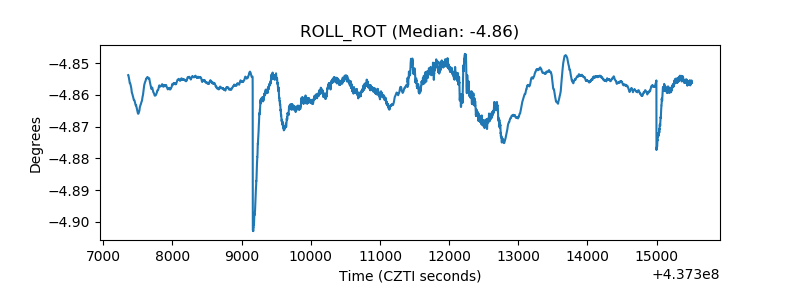 |
| _Roll_DEC | 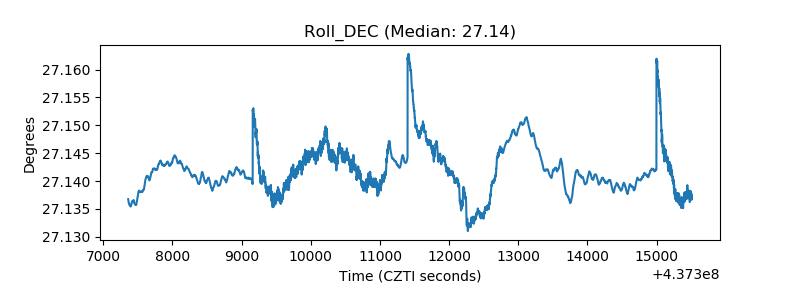 |
| _Roll_RA | 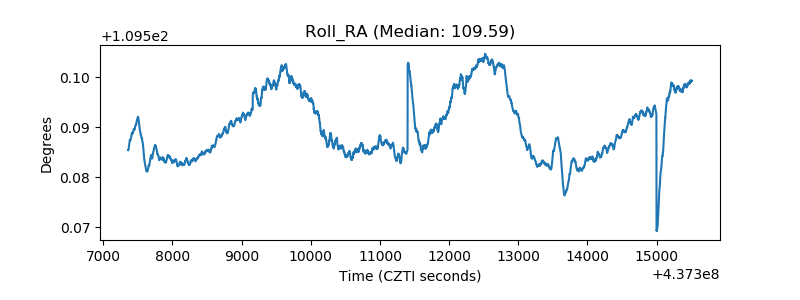 |
| Veto Counter | 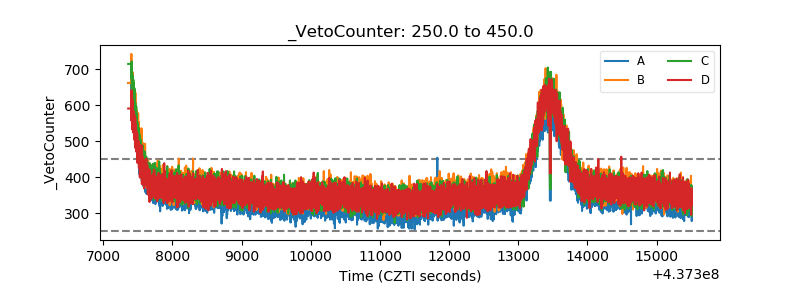 |