| Param | Original file | Final file |
|---|---|---|
| Filename | modeM0/AS1A13_009T02_9000005914_43899cztM0_level2.fits | modeM0/AS1A13_009T02_9000005914_43899cztM0_level2_quad_clean.evt |
| Size (bytes) | 602,118,720 | 122,806,080 |
| Size | 574.2 MB | 117.1 MB |
| Events in quadrant A | 7,300,347 | 793,694 |
| Events in quadrant B | 4,444,160 | 853,493 |
| Events in quadrant C | 4,580,988 | 808,469 |
| Events in quadrant D | 5,360,349 | 721,563 |
| Mode SS | |||
|---|---|---|---|
| Quadrant | BADHDUFLAG | Total packets | Discarded packets |
| A | 0 | 156 | 0 |
| B | 0 | 156 | 0 |
| C | 0 | 156 | 0 |
| D | 0 | 156 | 0 |
| Mode M0 | |||
|---|---|---|---|
| Quadrant | BADHDUFLAG | Total packets | Discarded packets |
| A | 0 | 27874 | 0 |
| B | 0 | 18405 | 0 |
| C | 0 | 18917 | 0 |
| D | 0 | 21300 | 0 |
| Quadrant | Total seconds | Saturated seconds | Saturation percentage |
|---|---|---|---|
| A | 7777 | 642 | 8.255111% |
| B | 7778 | 159 | 2.044227% |
| C | 7778 | 123 | 1.581383% |
| D | 7778 | 322 | 4.139882% |
Noise dominated data is calculated using 1-second bins in cleaned event files. If a bin has >2000 counts, and if more than 50% of those come from <1% of pixels, then it is considered to be noise-dominated and hence unusable.
| Quadrant | # 1 sec bins | Bins with >0 counts | Bins with >2000 counts | High rate bins dominated by noise | Noise dominated (total time) | Noise dominated (detector-on time) | Marked lightcurve |
|---|---|---|---|---|---|---|---|
| A | 7777 | 7777 | 537 | 537 | 6.90% | 6.90% |  |
| B | 7778 | 7778 | 89 | 89 | 1.14% | 1.14% | 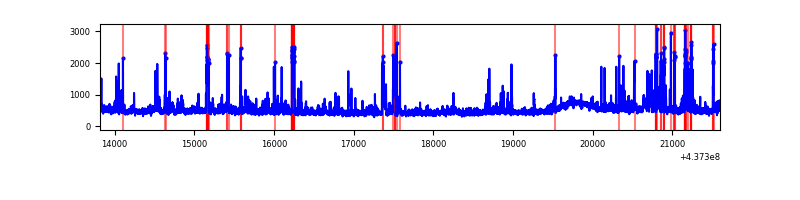 |
| C | 7778 | 7778 | 98 | 98 | 1.26% | 1.26% | 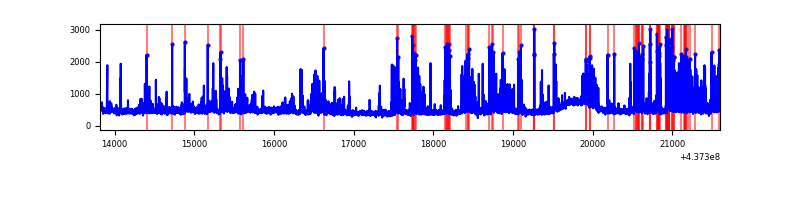 |
| D | 7778 | 7778 | 295 | 295 | 3.79% | 3.79% | 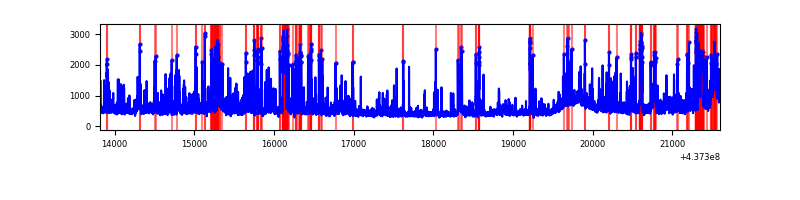 |
Top three noisy pixels from each quadrant. If the there are fewer than three noisy pixels in the level2.evt file, extra rows are filled as -1
| Pixel properties | Quadrant properties | ||||||
|---|---|---|---|---|---|---|---|
| Quadrant | DetID | PixID | Counts | Sigma | Mean | Median | Sigma |
| A | 15 | 223 | 1812703 | 9856.07 | 875 | 858 | 183.8 |
| A | 10 | 83 | 1119765 | 6086.63 | 875 | 858 | 183.8 |
| A | 15 | 222 | 903219 | 4908.66 | 875 | 858 | 183.8 |
| B | 5 | 235 | 333497 | 1911.15 | 881 | 853 | 174.1 |
| B | 0 | 200 | 200831 | 1148.94 | 881 | 853 | 174.1 |
| B | 7 | 205 | 151496 | 865.49 | 881 | 853 | 174.1 |
| C | 15 | 158 | 711702 | 3473.58 | 862 | 867 | 204.6 |
| C | 3 | 233 | 166535 | 809.56 | 862 | 867 | 204.6 |
| C | 15 | 157 | 147848 | 718.24 | 862 | 867 | 204.6 |
| D | 13 | 171 | 518577 | 2345.95 | 860 | 830 | 220.7 |
| D | 1 | 52 | 268390 | 1212.33 | 860 | 830 | 220.7 |
| D | 12 | 233 | 185622 | 837.31 | 860 | 830 | 220.7 |
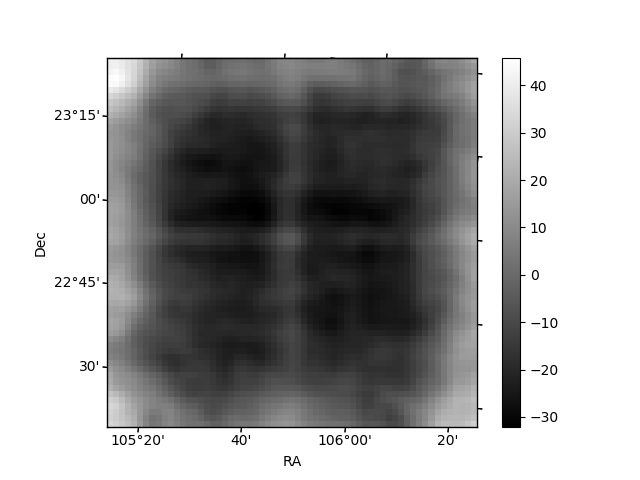
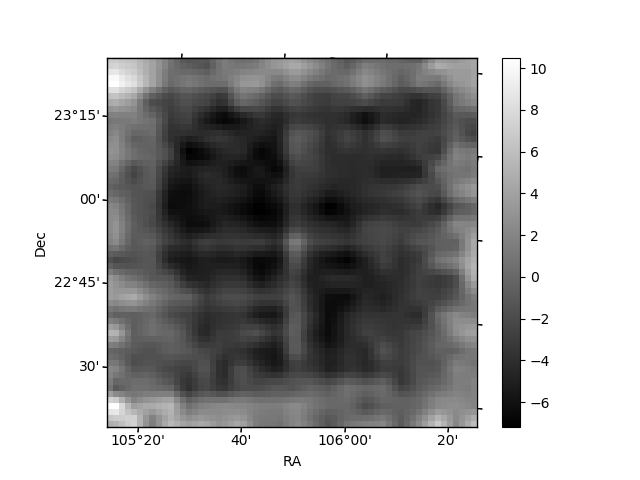
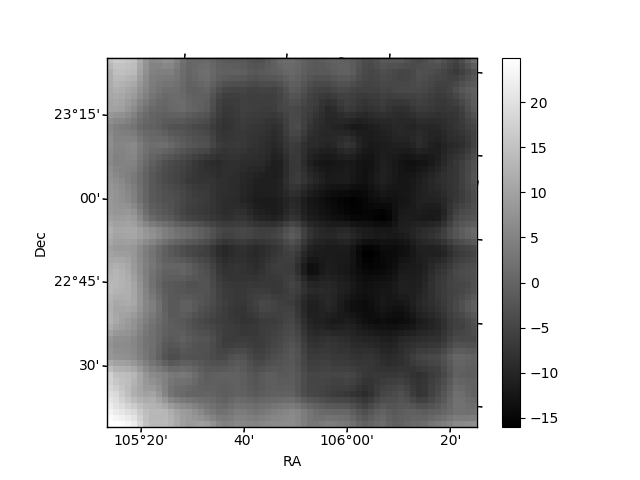
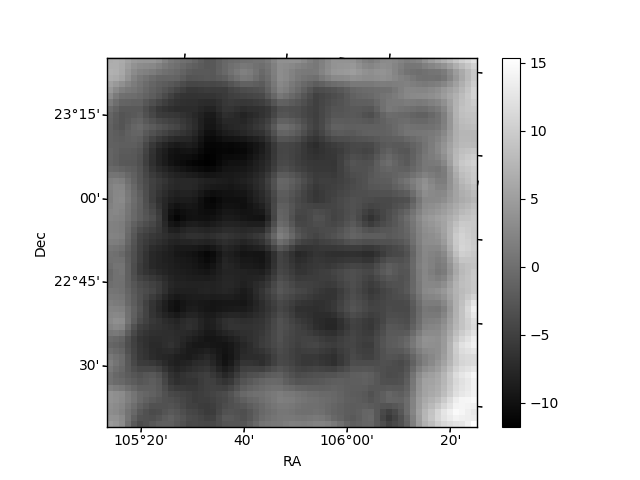
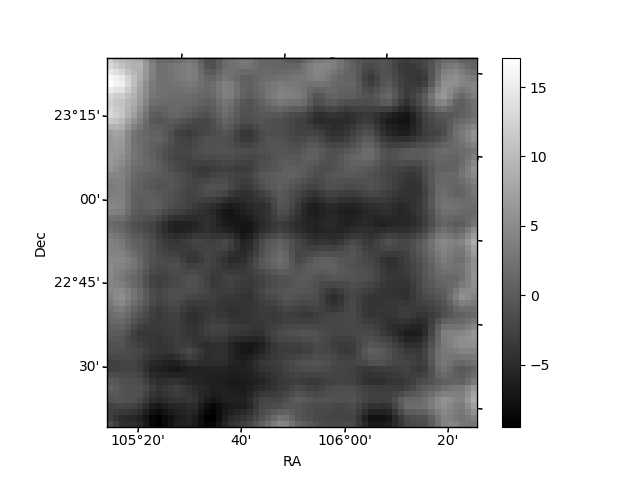
Histogram calculated using DETX and DETY for each event in the final _common_clean file
| Quadrant A | 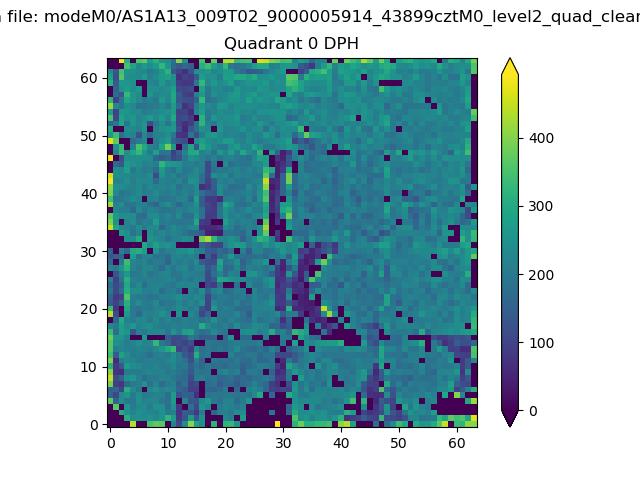 |
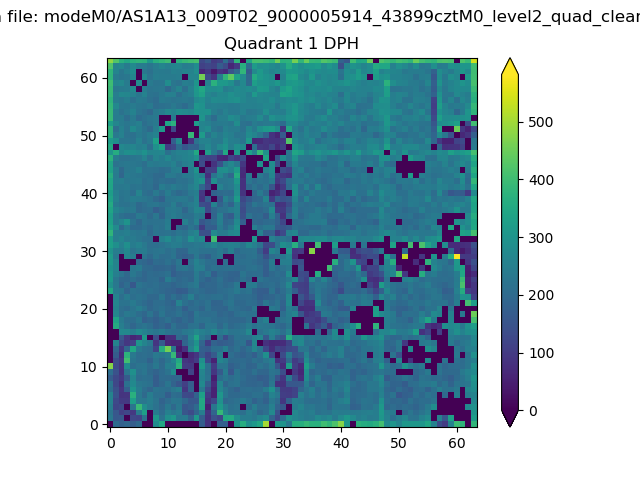 |
Quadrant B |
|---|---|---|---|
| Quadrant D | 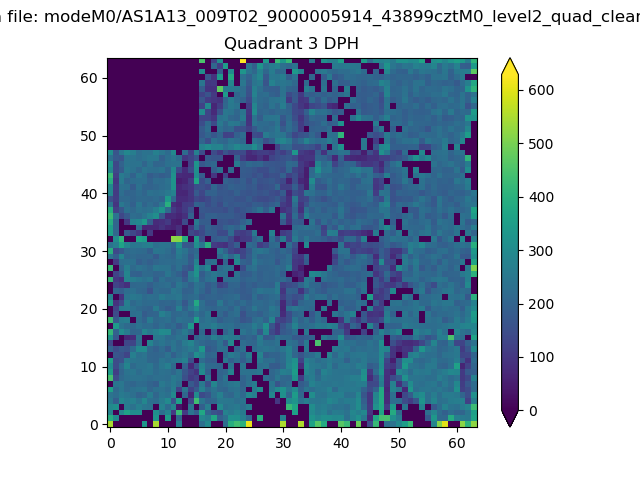 |
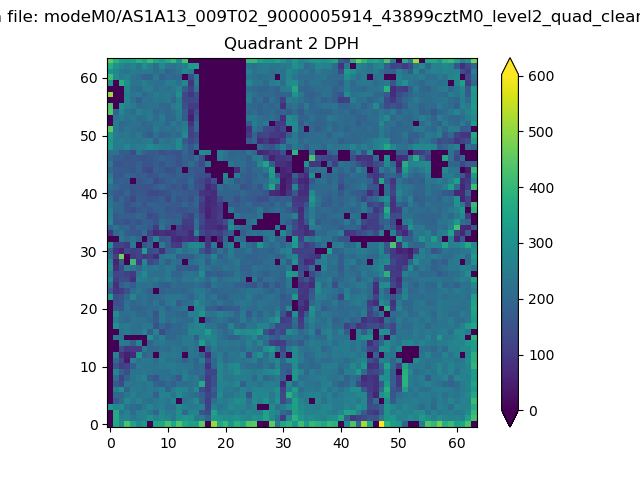 |
Quadrant C |
| Plot type | Count rate plots | Images |
|---|---|---|
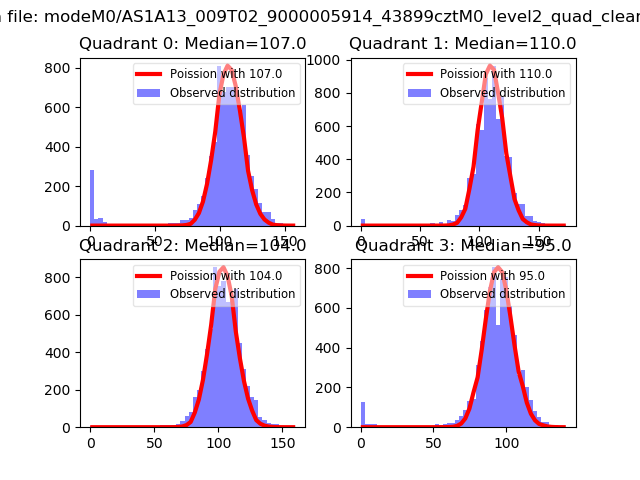
| Comparison with Poisson distribution Blue bars denote a histogram of data divided into 1 sec bins. Red curve is a Poisson curve with rate = median count rate of data. |
 |
 |
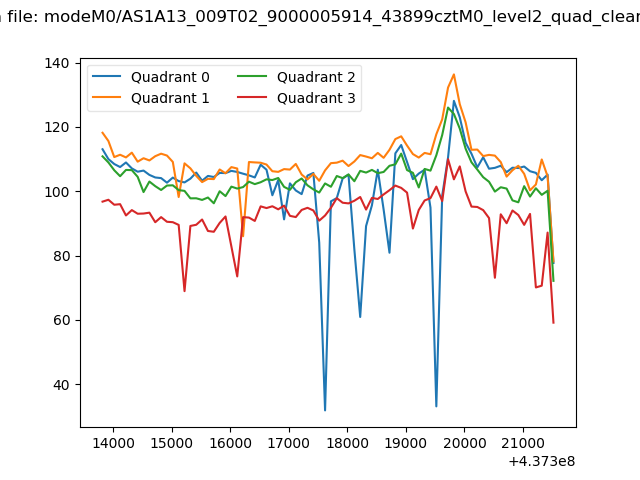
| Quadrant-wise count rates Data is divided into 100 sec bins |
 |
|
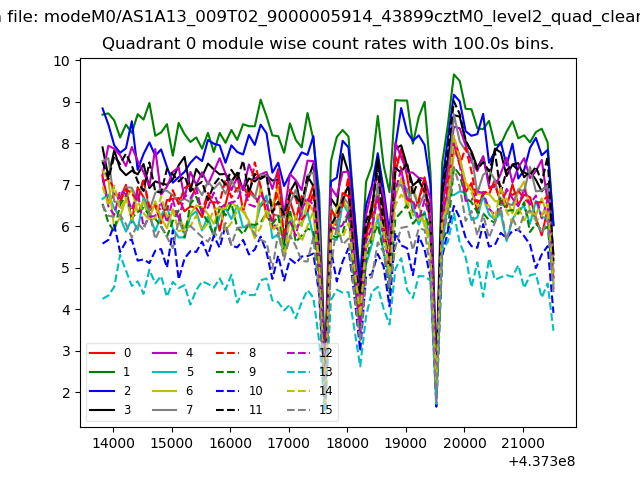
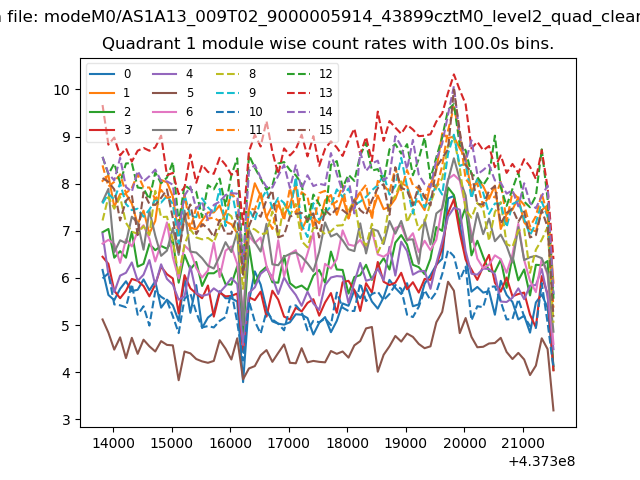
| Module-wise count rates for Quadrant A Data is divided into 100 sec bins |
 |
 |
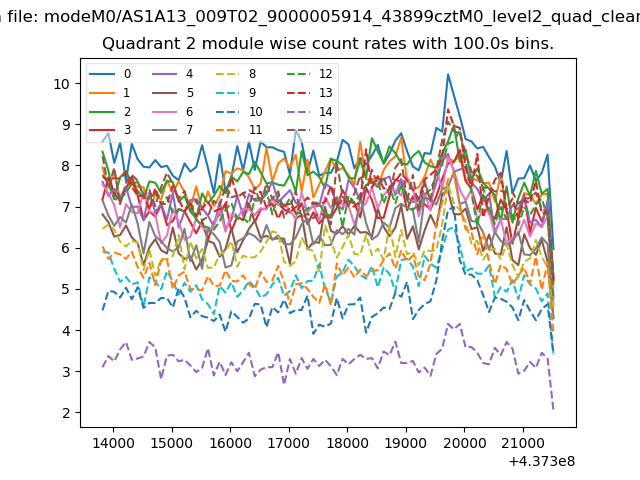
| Module-wise count rates for Quadrant B Data is divided into 100 sec bins |
 |
 |
| Module-wise count rates for Quadrant C Data is divided into 100 sec bins |
 |
 |
| Module-wise count rates for Quadrant D Data is divided into 100 sec bins |
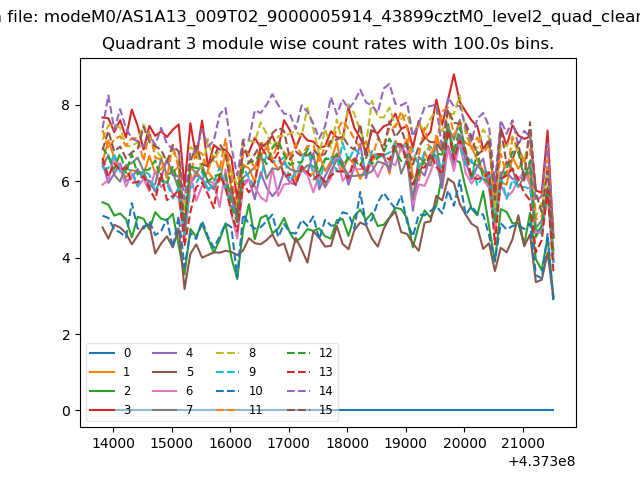 |
 |
| Parameter | Plot |
|---|---|
| CZT HV Monitor | 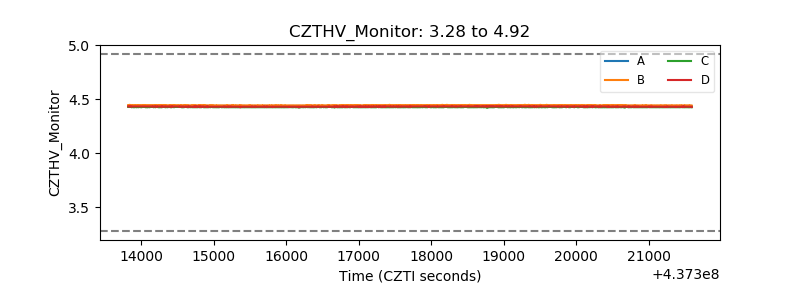 |
| D_VDD | 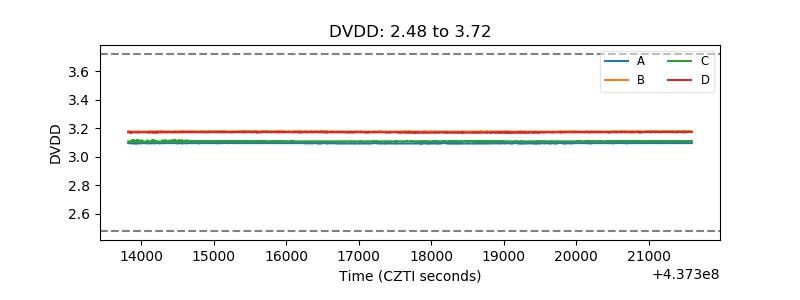 |
| Temperature 1 | 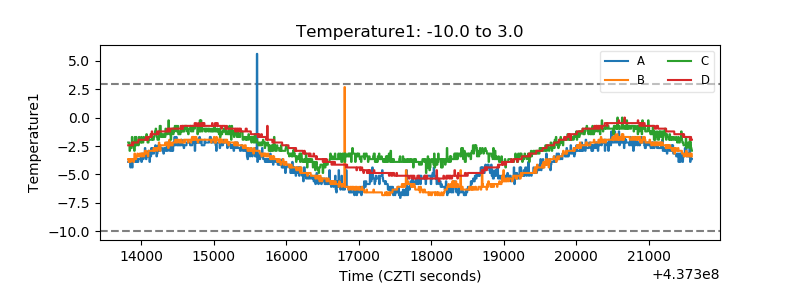 |
| Veto HV Monitor | 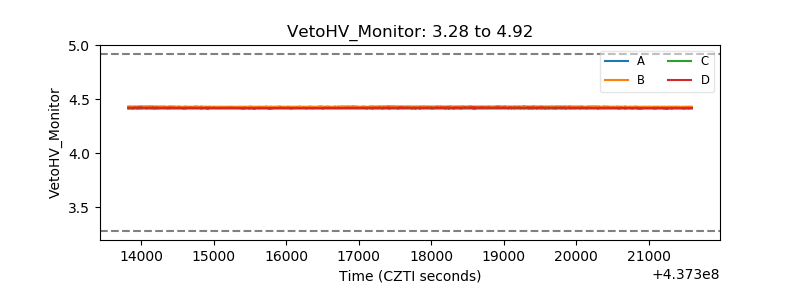 |
| Veto LLD | 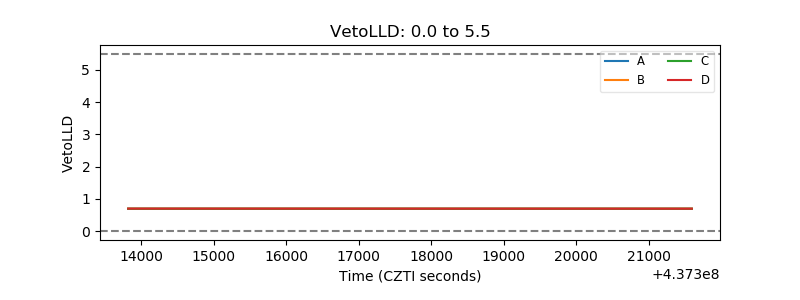 |
| Alpha Counter | 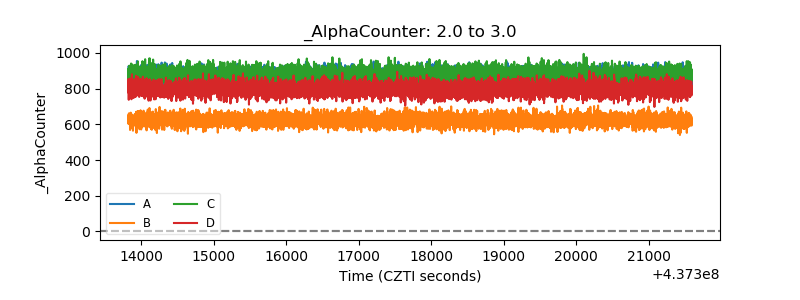 |
| _CPM_Rate | 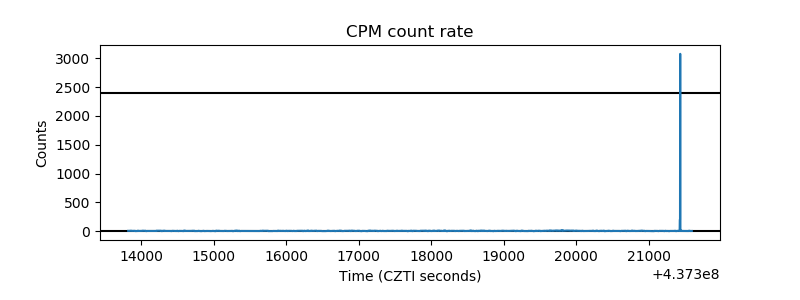 |
| CZT Counter | 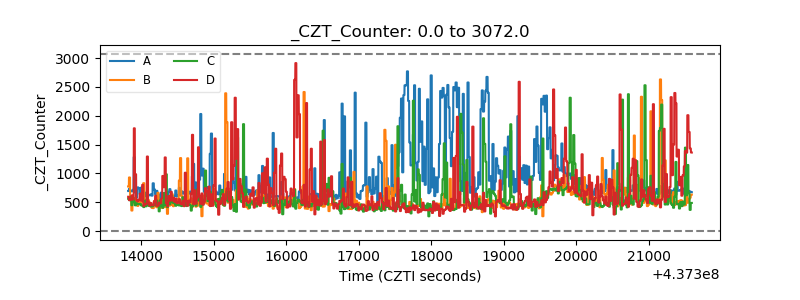 |
| +2.5 Volts monitor | 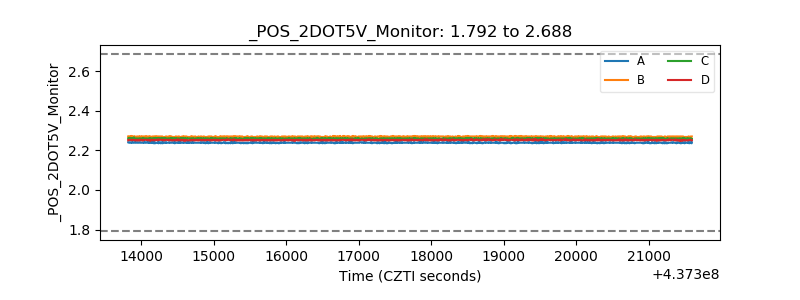 |
| +5 Volts monitor | 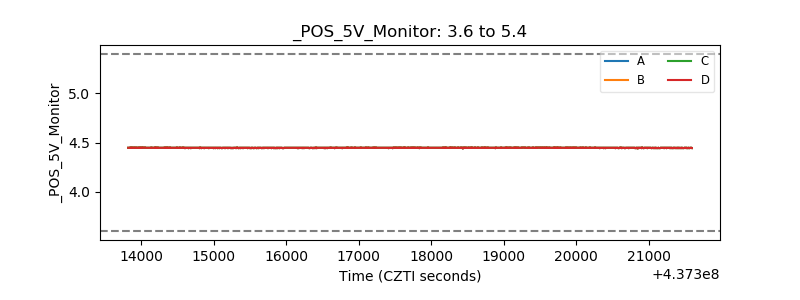 |
| _ROLL_ROT | 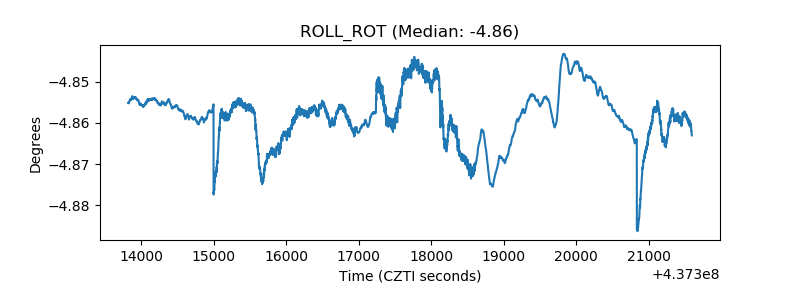 |
| _Roll_DEC | 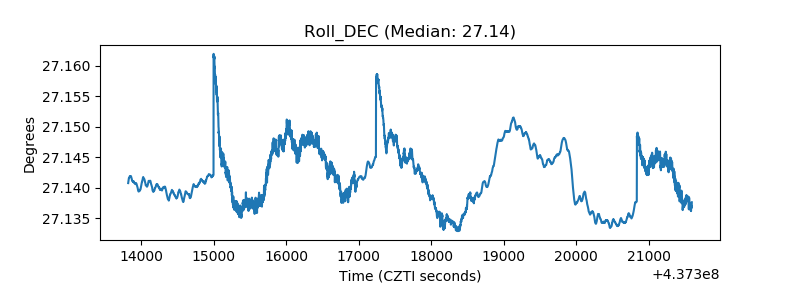 |
| _Roll_RA | 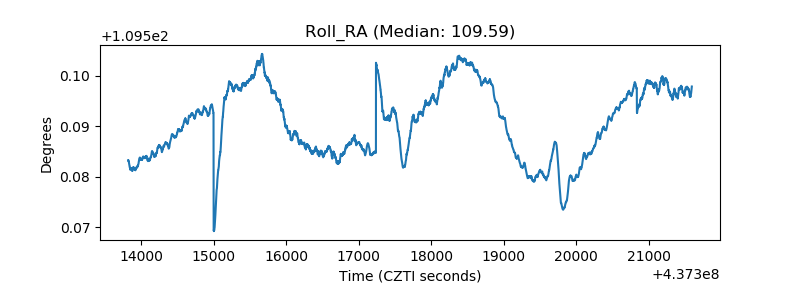 |
| Veto Counter | 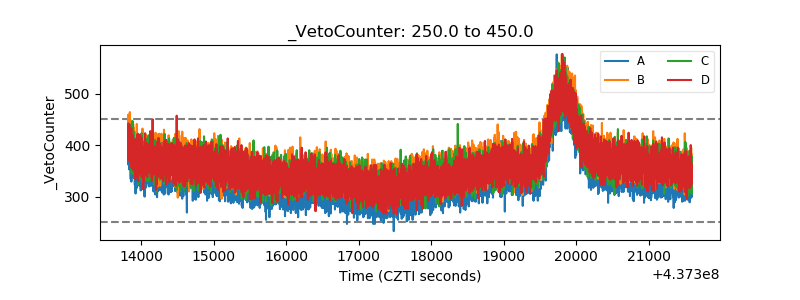 |