| Param | Original file | Final file |
|---|---|---|
| Filename | modeM0/AS1A13_009T02_9000005914_43900cztM0_level2.fits | modeM0/AS1A13_009T02_9000005914_43900cztM0_level2_quad_clean.evt |
| Size (bytes) | 668,658,240 | 131,800,320 |
| Size | 637.7 MB | 125.7 MB |
| Events in quadrant A | 7,316,903 | 852,315 |
| Events in quadrant B | 4,938,632 | 915,709 |
| Events in quadrant C | 5,828,318 | 871,425 |
| Events in quadrant D | 6,022,493 | 772,161 |
| Mode SS | |||
|---|---|---|---|
| Quadrant | BADHDUFLAG | Total packets | Discarded packets |
| A | 0 | 166 | 0 |
| B | 0 | 166 | 0 |
| C | 0 | 166 | 0 |
| D | 0 | 166 | 0 |
| Mode M0 | |||
|---|---|---|---|
| Quadrant | BADHDUFLAG | Total packets | Discarded packets |
| A | 0 | 28174 | 0 |
| B | 0 | 20315 | 0 |
| C | 0 | 23022 | 0 |
| D | 0 | 23759 | 0 |
| Quadrant | Total seconds | Saturated seconds | Saturation percentage |
|---|---|---|---|
| A | 8331 | 741 | 8.894490% |
| B | 8332 | 279 | 3.348536% |
| C | 8332 | 245 | 2.940470% |
| D | 8332 | 475 | 5.700912% |
Noise dominated data is calculated using 1-second bins in cleaned event files. If a bin has >2000 counts, and if more than 50% of those come from <1% of pixels, then it is considered to be noise-dominated and hence unusable.
| Quadrant | # 1 sec bins | Bins with >0 counts | Bins with >2000 counts | High rate bins dominated by noise | Noise dominated (total time) | Noise dominated (detector-on time) | Marked lightcurve |
|---|---|---|---|---|---|---|---|
| A | 8331 | 8331 | 546 | 546 | 6.55% | 6.55% | 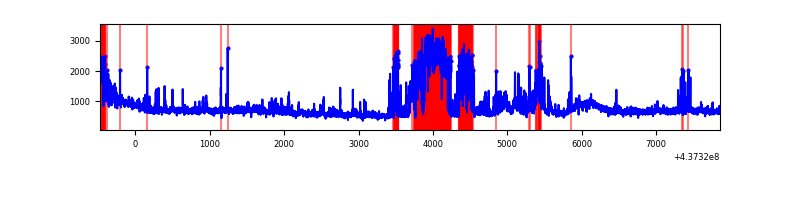 |
| B | 8332 | 8332 | 73 | 73 | 0.88% | 0.88% | 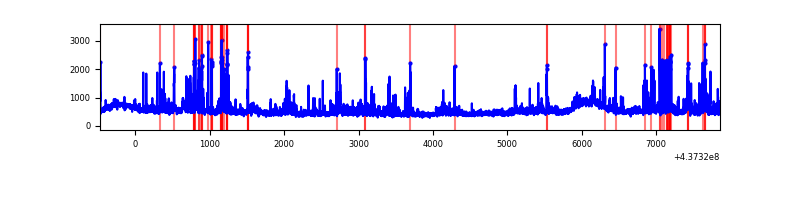 |
| C | 8332 | 8332 | 187 | 187 | 2.24% | 2.24% | 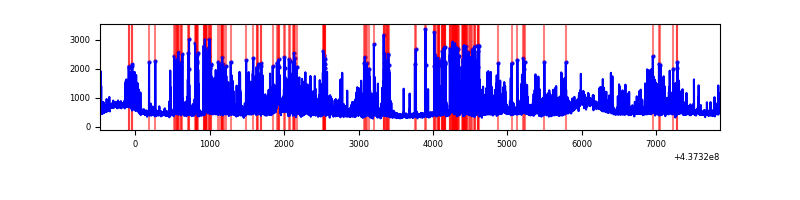 |
| D | 8332 | 8332 | 333 | 333 | 4.00% | 4.00% | 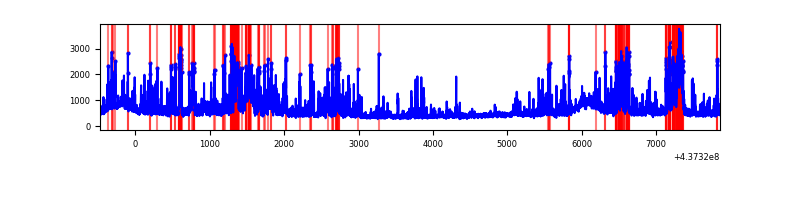 |
Top three noisy pixels from each quadrant. If the there are fewer than three noisy pixels in the level2.evt file, extra rows are filled as -1
| Pixel properties | Quadrant properties | ||||||
|---|---|---|---|---|---|---|---|
| Quadrant | DetID | PixID | Counts | Sigma | Mean | Median | Sigma |
| A | 15 | 223 | 1936040 | 9481.84 | 967 | 946 | 204.1 |
| A | 10 | 83 | 1208035 | 5914.66 | 967 | 946 | 204.1 |
| A | 15 | 222 | 328399 | 1604.5 | 967 | 946 | 204.1 |
| B | 5 | 235 | 386564 | 1965.23 | 976 | 943 | 196.2 |
| B | 0 | 200 | 192055 | 973.96 | 976 | 943 | 196.2 |
| B | 4 | 171 | 138331 | 700.17 | 976 | 943 | 196.2 |
| C | 15 | 158 | 1531999 | 6745.13 | 958 | 964 | 227.0 |
| C | 3 | 233 | 237732 | 1043.11 | 958 | 964 | 227.0 |
| C | 14 | 254 | 106406 | 464.54 | 958 | 964 | 227.0 |
| D | 5 | 235 | 492393 | 2016.26 | 955 | 921 | 243.8 |
| D | 13 | 187 | 379526 | 1553.22 | 955 | 921 | 243.8 |
| D | 13 | 171 | 239649 | 979.38 | 955 | 921 | 243.8 |
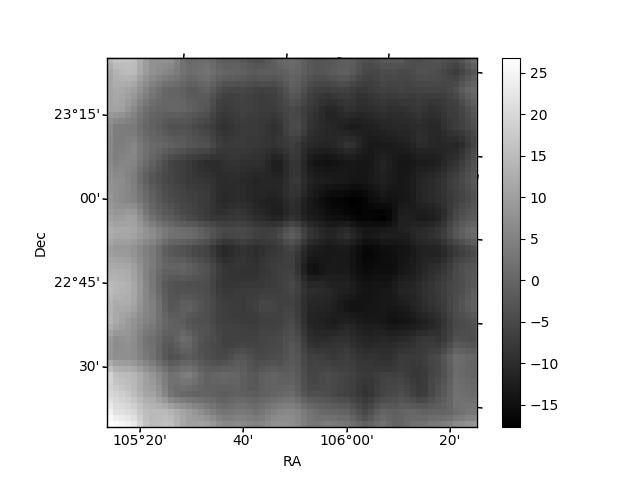
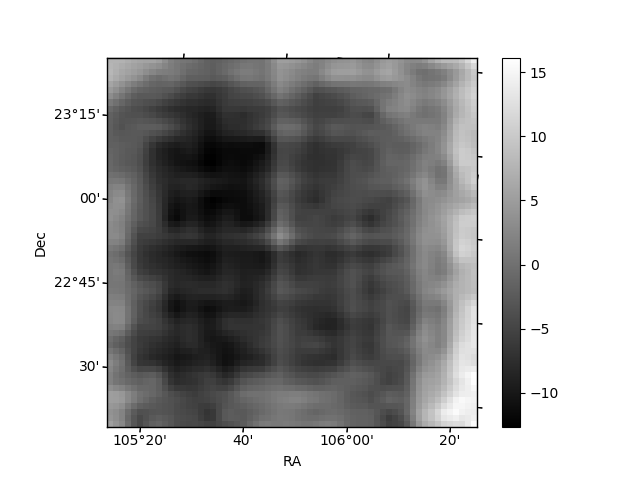
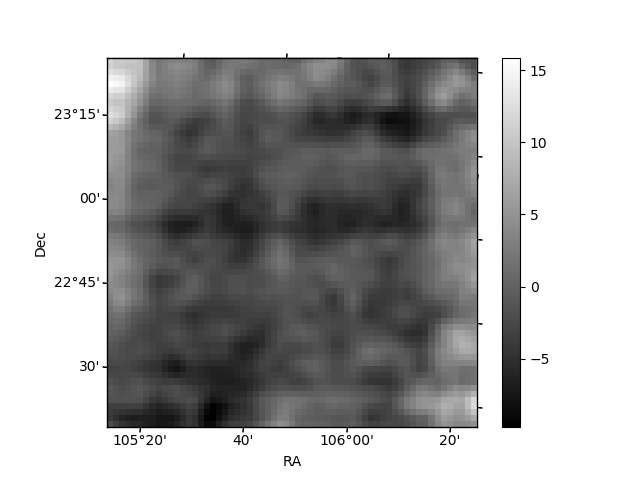
Histogram calculated using DETX and DETY for each event in the final _common_clean file
| Quadrant A | 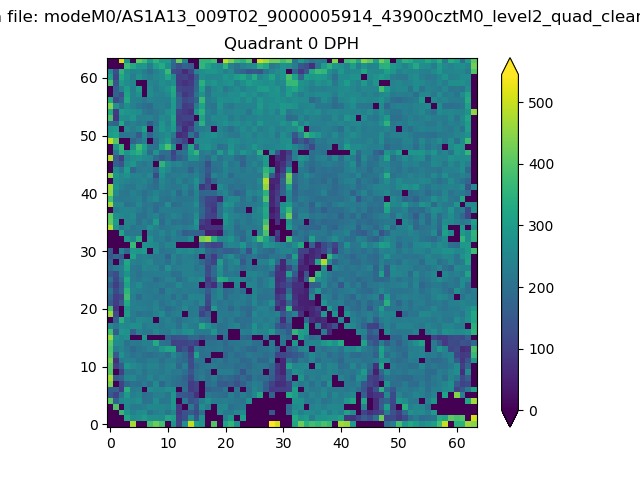 |
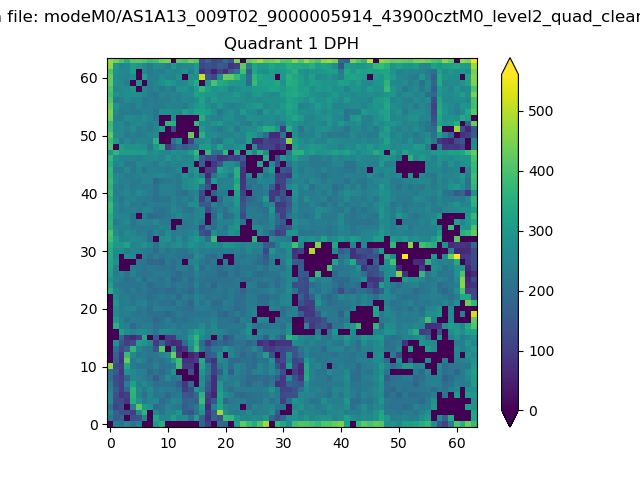 |
Quadrant B |
|---|---|---|---|
| Quadrant D | 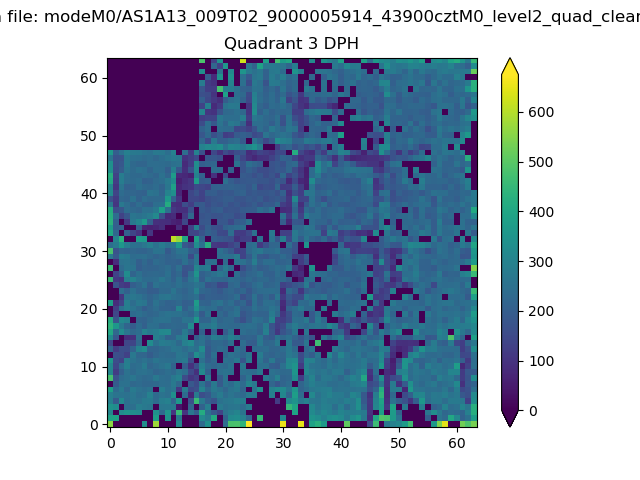 |
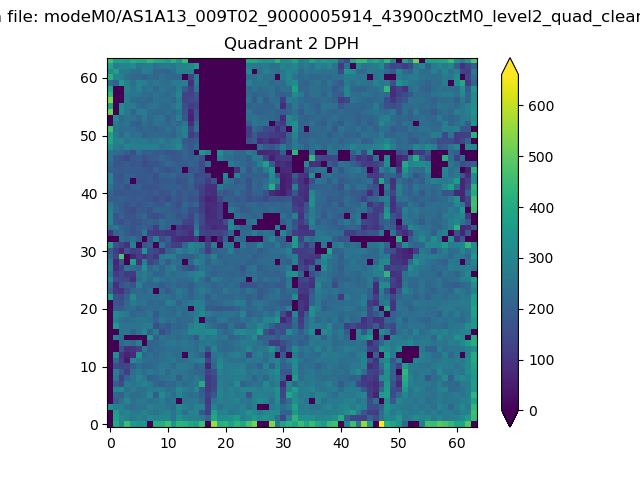 |
Quadrant C |
| Plot type | Count rate plots | Images |
|---|---|---|
| Comparison with Poisson distribution Blue bars denote a histogram of data divided into 1 sec bins. Red curve is a Poisson curve with rate = median count rate of data. |
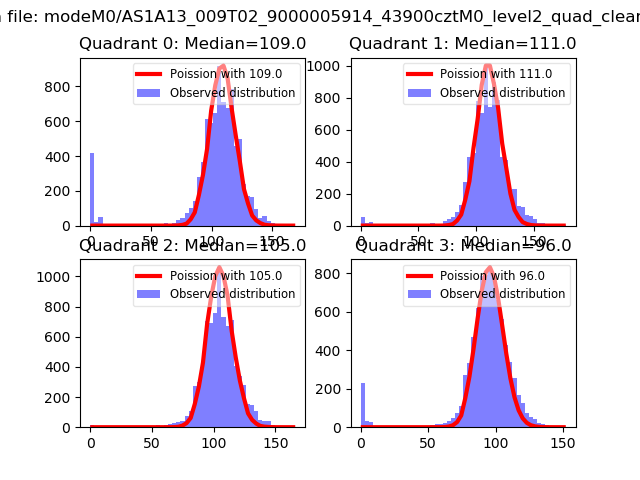 |
 |
| Quadrant-wise count rates Data is divided into 100 sec bins |
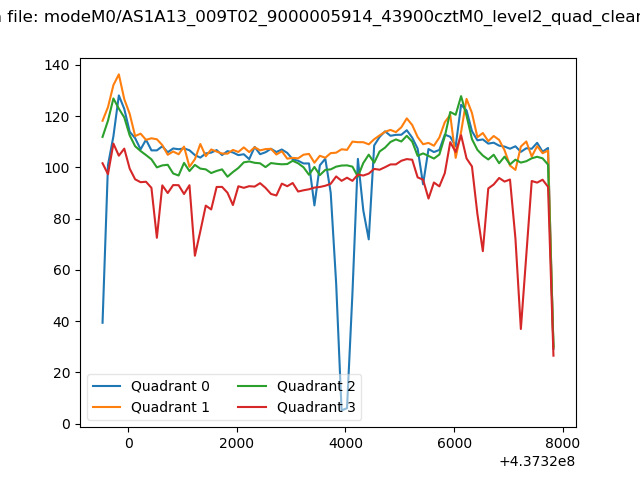 |
|
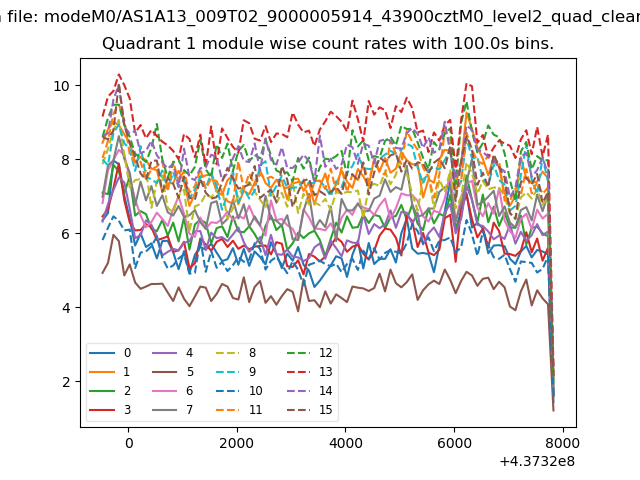
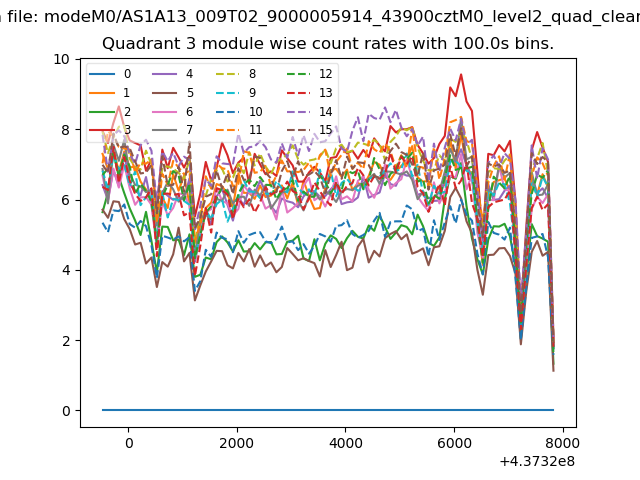
| Module-wise count rates for Quadrant A Data is divided into 100 sec bins |
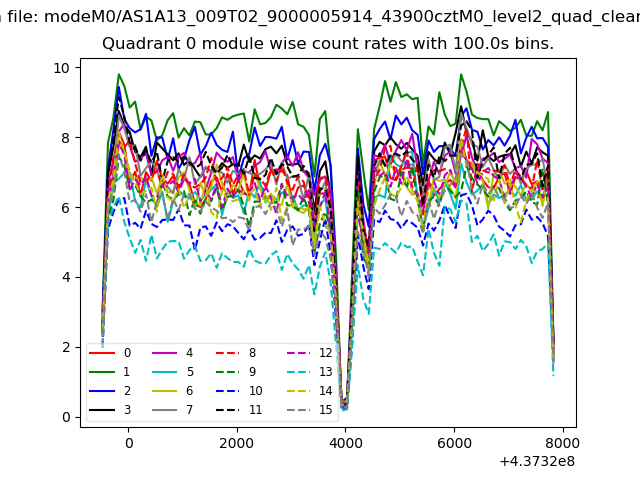 |
 |
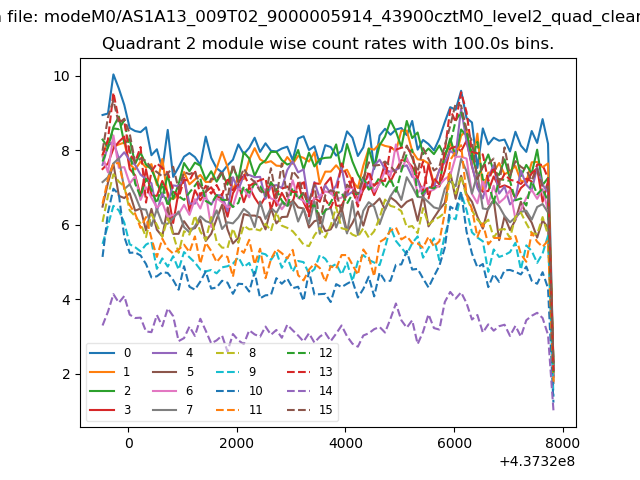
| Module-wise count rates for Quadrant B Data is divided into 100 sec bins |
 |
 |
| Module-wise count rates for Quadrant C Data is divided into 100 sec bins |
 |
 |
| Module-wise count rates for Quadrant D Data is divided into 100 sec bins |
 |
 |
| Parameter | Plot |
|---|---|
| CZT HV Monitor | 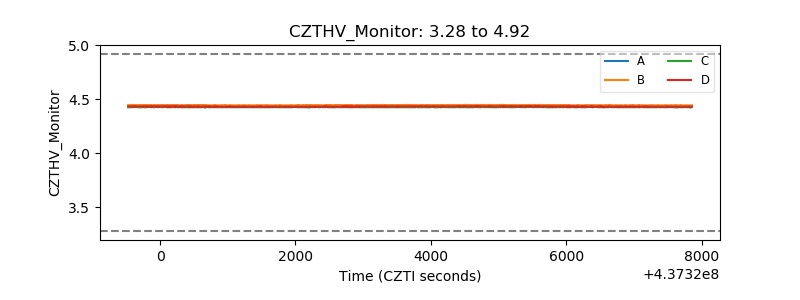 |
| D_VDD | 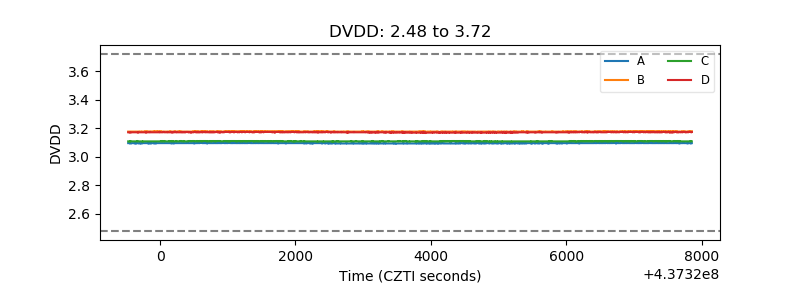 |
| Temperature 1 | 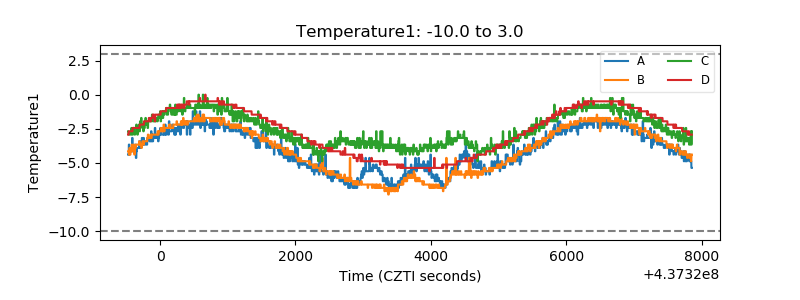 |
| Veto HV Monitor | 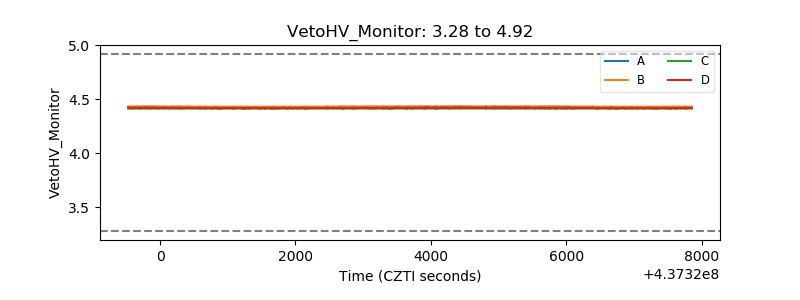 |
| Veto LLD | 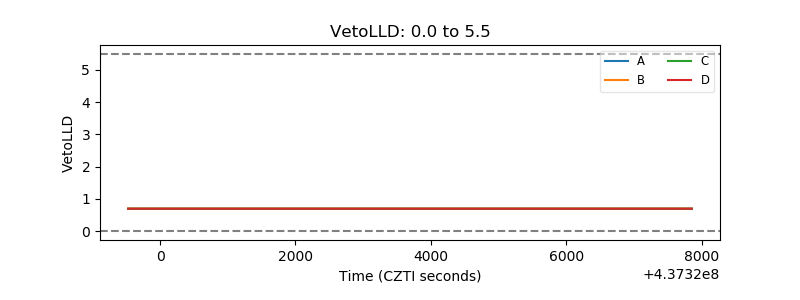 |
| Alpha Counter | 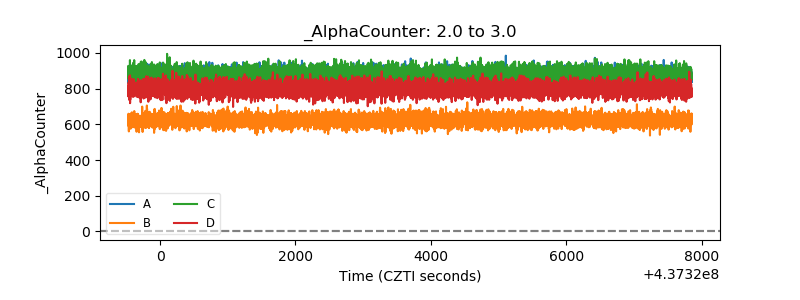 |
| _CPM_Rate | 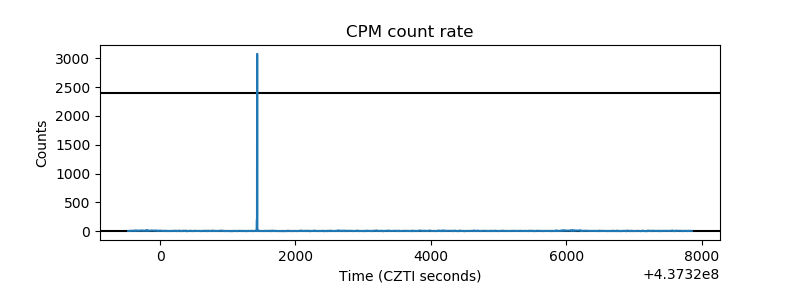 |
| CZT Counter | 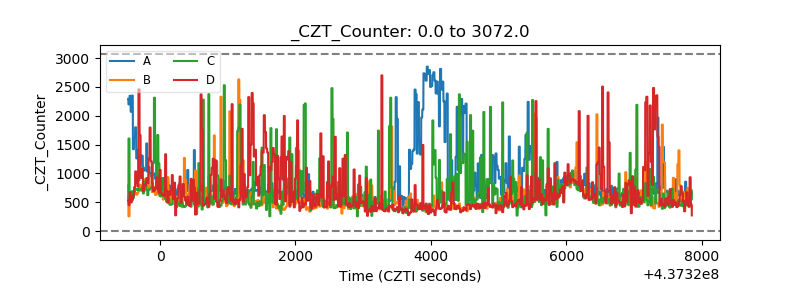 |
| +2.5 Volts monitor | 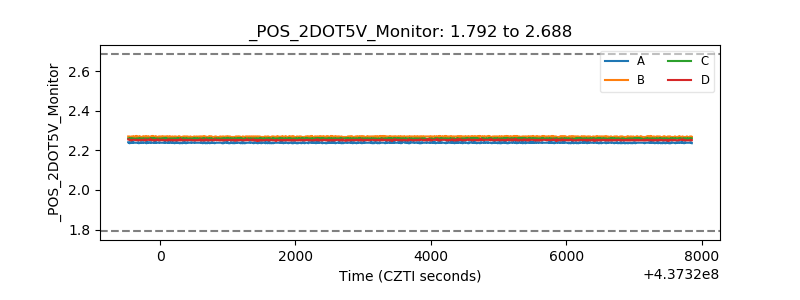 |
| +5 Volts monitor | 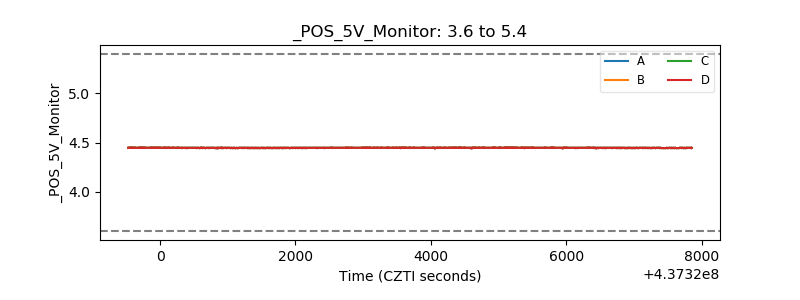 |
| _ROLL_ROT | 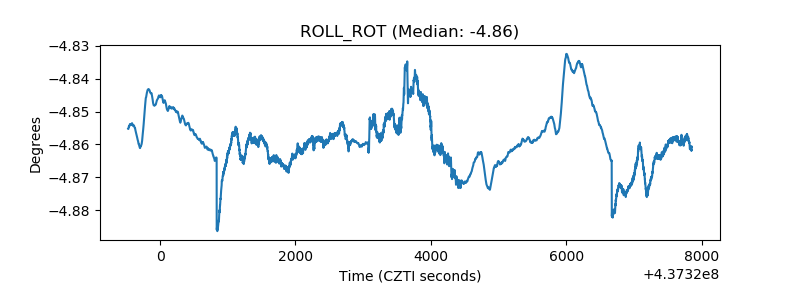 |
| _Roll_DEC | 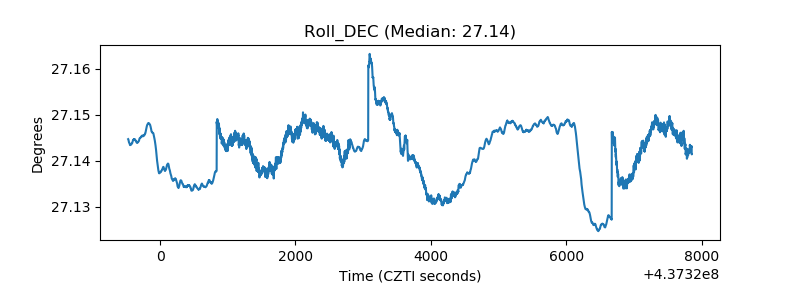 |
| _Roll_RA |  |
| Veto Counter | 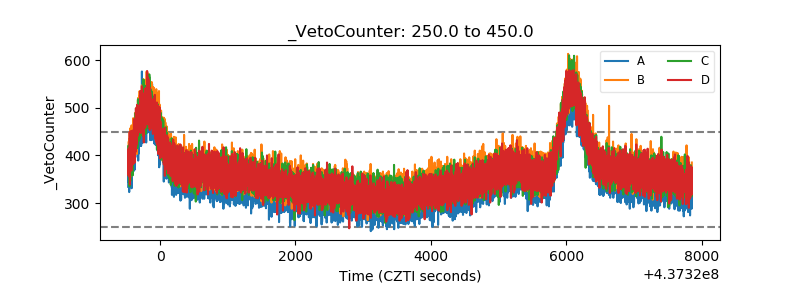 |