| Param | Original file | Final file |
|---|---|---|
| Filename | modeM0/AS1A13_009T02_9000005914_43906cztM0_level2.fits | modeM0/AS1A13_009T02_9000005914_43906cztM0_level2_quad_clean.evt |
| Size (bytes) | 522,092,160 | 108,213,120 |
| Size | 497.9 MB | 103.2 MB |
| Events in quadrant A | 6,160,688 | 725,446 |
| Events in quadrant B | 3,317,235 | 773,798 |
| Events in quadrant C | 3,058,072 | 733,901 |
| Events in quadrant D | 6,264,167 | 571,274 |
| Mode M9 | |||
|---|---|---|---|
| Quadrant | BADHDUFLAG | Total packets | Discarded packets |
| A | 0 | 18 | 0 |
| B | 0 | 19 | 0 |
| C | 0 | 19 | 0 |
| D | 0 | 19 | 0 |
| Mode SS | |||
|---|---|---|---|
| Quadrant | BADHDUFLAG | Total packets | Discarded packets |
| A | 0 | 138 | 0 |
| B | 0 | 138 | 0 |
| C | 0 | 138 | 0 |
| D | 0 | 138 | 0 |
| Mode M0 | |||
|---|---|---|---|
| Quadrant | BADHDUFLAG | Total packets | Discarded packets |
| A | 0 | 23248 | 2 |
| B | 0 | 14508 | 2 |
| C | 0 | 14078 | 2 |
| D | 0 | 23384 | 2 |
| Quadrant | Total seconds | Saturated seconds | Saturation percentage |
|---|---|---|---|
| A | 6773 | 390 | 5.758157% |
| B | 6773 | 64 | 0.944928% |
| C | 6773 | 27 | 0.398642% |
| D | 6772 | 1055 | 15.578854% |
Noise dominated data is calculated using 1-second bins in cleaned event files. If a bin has >2000 counts, and if more than 50% of those come from <1% of pixels, then it is considered to be noise-dominated and hence unusable.
| Quadrant | # 1 sec bins | Bins with >0 counts | Bins with >2000 counts | High rate bins dominated by noise | Noise dominated (total time) | Noise dominated (detector-on time) | Marked lightcurve |
|---|---|---|---|---|---|---|---|
| A | 7813 | 6774 | 289 | 289 | 3.70% | 4.27% | 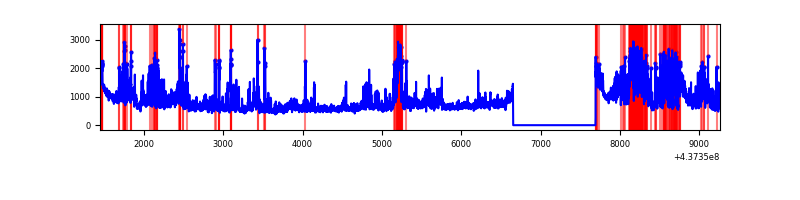 |
| B | 7813 | 6774 | 14 | 14 | 0.18% | 0.21% | 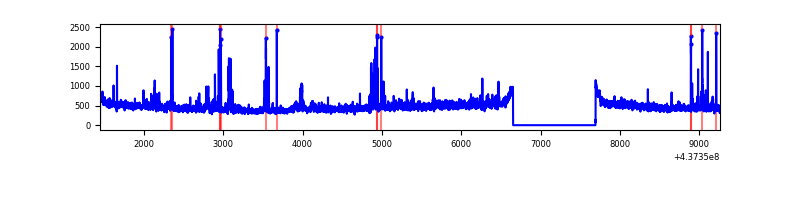 |
| C | 7813 | 6774 | 9 | 9 | 0.12% | 0.13% | 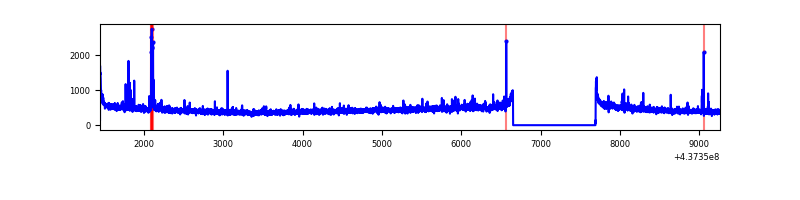 |
| D | 7812 | 6773 | 951 | 951 | 12.17% | 14.04% | 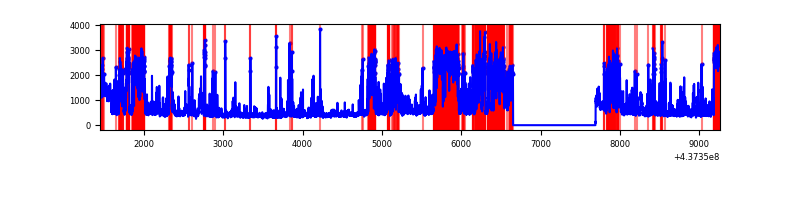 |
Top three noisy pixels from each quadrant. If the there are fewer than three noisy pixels in the level2.evt file, extra rows are filled as -1
| Pixel properties | Quadrant properties | ||||||
|---|---|---|---|---|---|---|---|
| Quadrant | DetID | PixID | Counts | Sigma | Mean | Median | Sigma |
| A | 15 | 223 | 1804511 | 11802.11 | 741 | 727 | 152.8 |
| A | 10 | 83 | 1133171 | 7409.55 | 741 | 727 | 152.8 |
| A | 2 | 79 | 133945 | 871.64 | 741 | 727 | 152.8 |
| B | 5 | 172 | 113091 | 754.53 | 758 | 735 | 148.9 |
| B | 4 | 171 | 53466 | 354.12 | 758 | 735 | 148.9 |
| B | 5 | 235 | 48302 | 319.44 | 758 | 735 | 148.9 |
| C | 3 | 233 | 63166 | 359.93 | 741 | 746 | 173.4 |
| C | 14 | 254 | 55307 | 314.62 | 741 | 746 | 173.4 |
| C | 14 | 96 | 12803 | 69.52 | 741 | 746 | 173.4 |
| D | 12 | 233 | 1665906 | 9649.5 | 681 | 659 | 172.6 |
| D | 1 | 52 | 666122 | 3856.12 | 681 | 659 | 172.6 |
| D | 5 | 235 | 289085 | 1671.32 | 681 | 659 | 172.6 |
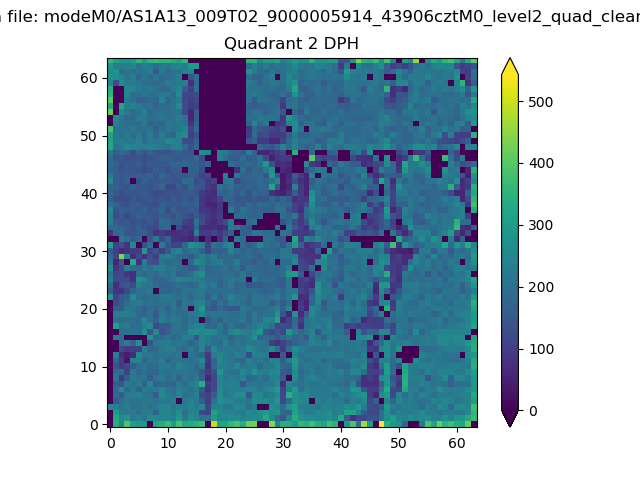
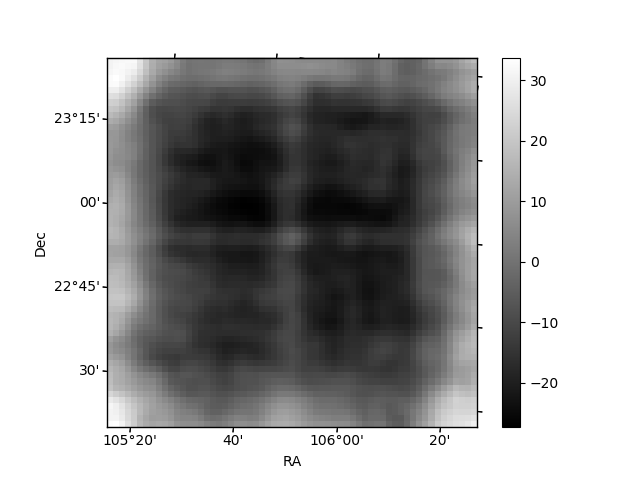
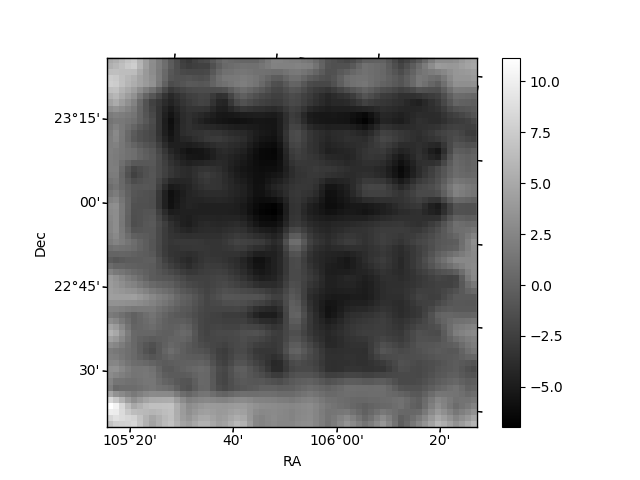
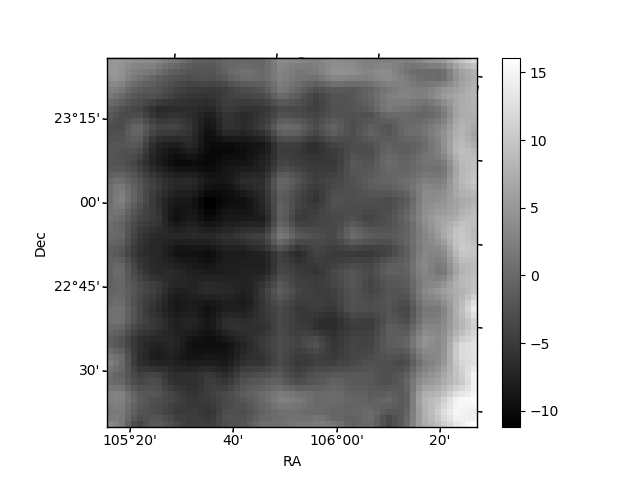
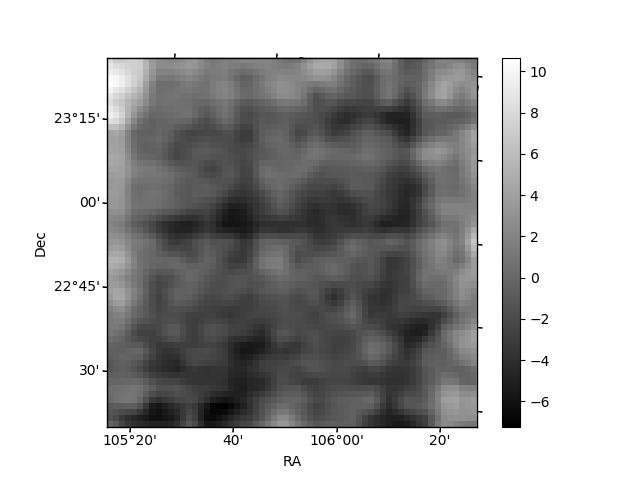
Histogram calculated using DETX and DETY for each event in the final _common_clean file
| Quadrant A | 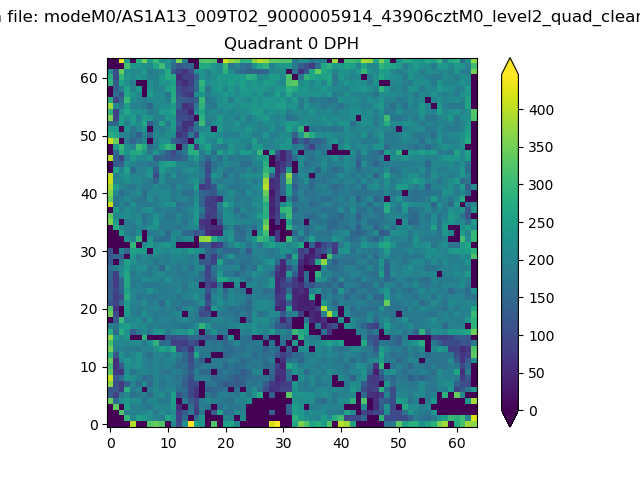 |
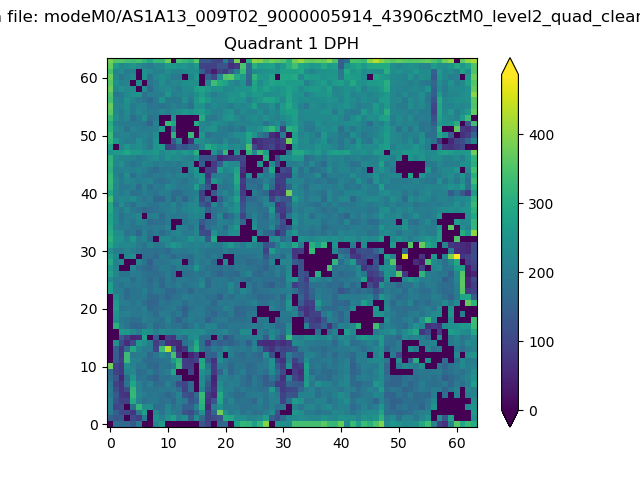 |
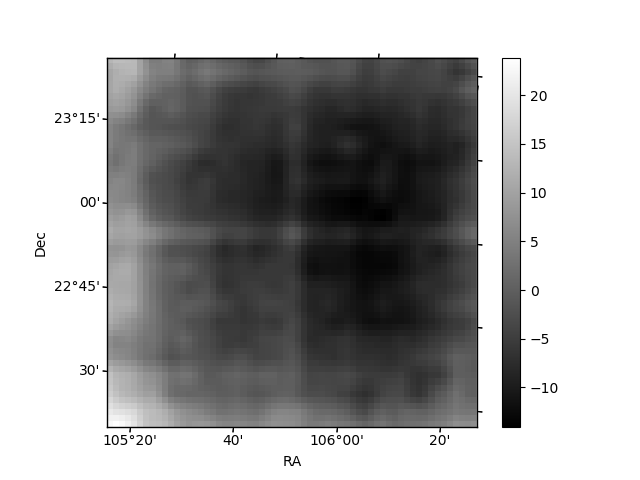
Quadrant B |
|---|---|---|---|
| Quadrant D | 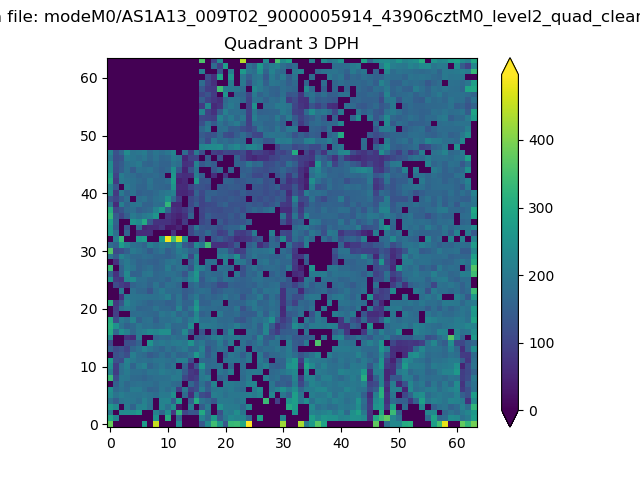 |
 |
Quadrant C |
| Plot type | Count rate plots | Images |
|---|---|---|
| Comparison with Poisson distribution Blue bars denote a histogram of data divided into 1 sec bins. Red curve is a Poisson curve with rate = median count rate of data. |
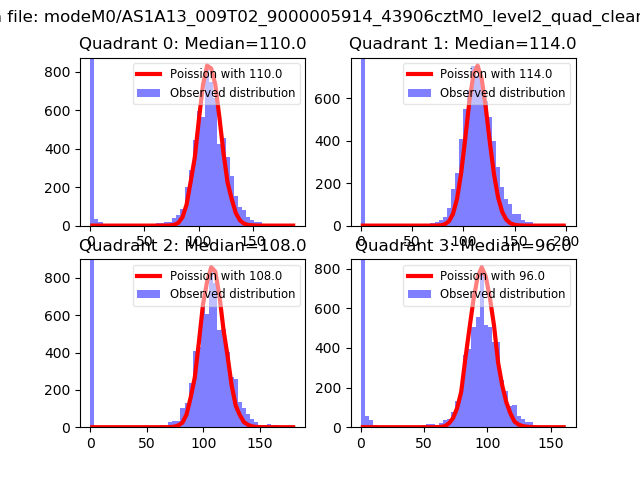 |
 |
| Quadrant-wise count rates Data is divided into 100 sec bins |
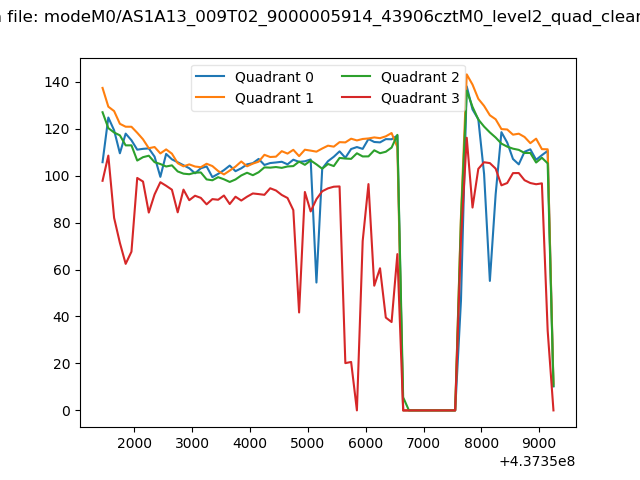 |
|
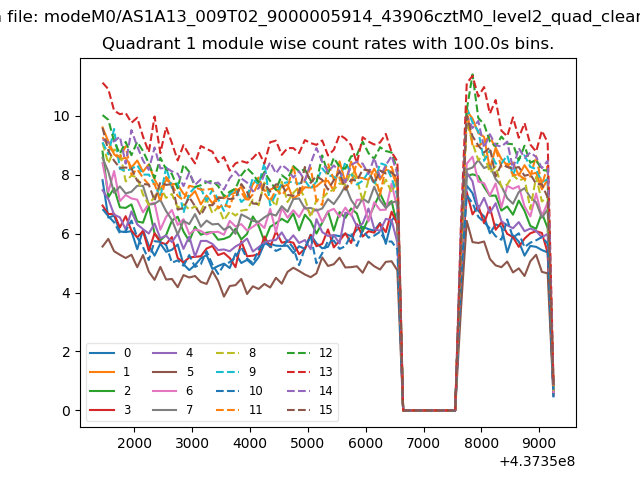
| Module-wise count rates for Quadrant A Data is divided into 100 sec bins |
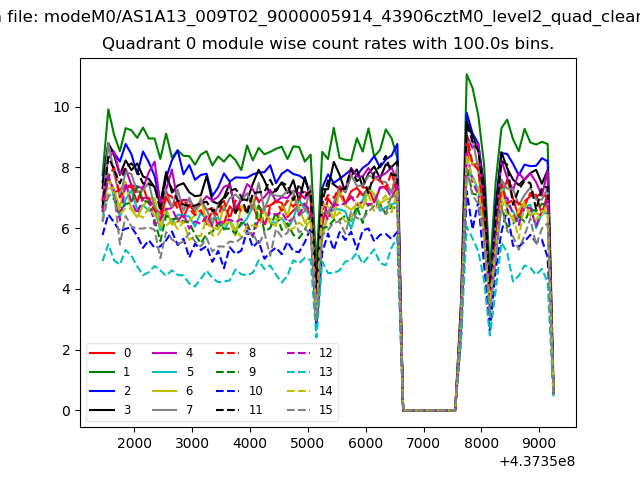 |
 |
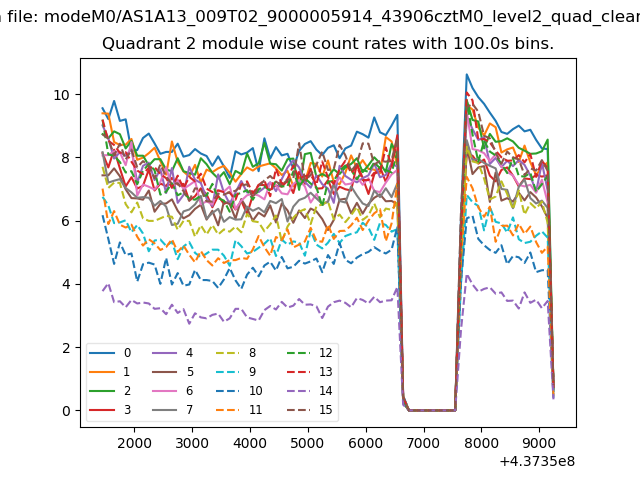
| Module-wise count rates for Quadrant B Data is divided into 100 sec bins |
 |
 |
| Module-wise count rates for Quadrant C Data is divided into 100 sec bins |
 |
 |
| Module-wise count rates for Quadrant D Data is divided into 100 sec bins |
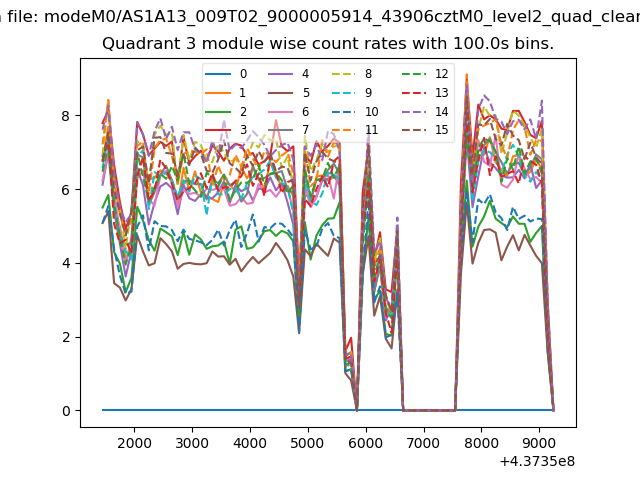 |
 |
| Parameter | Plot |
|---|---|
| CZT HV Monitor | 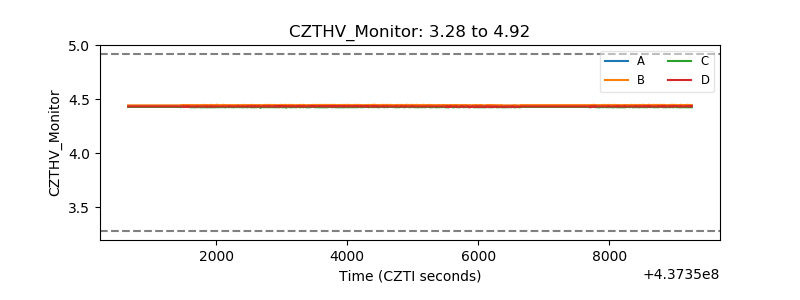 |
| D_VDD | 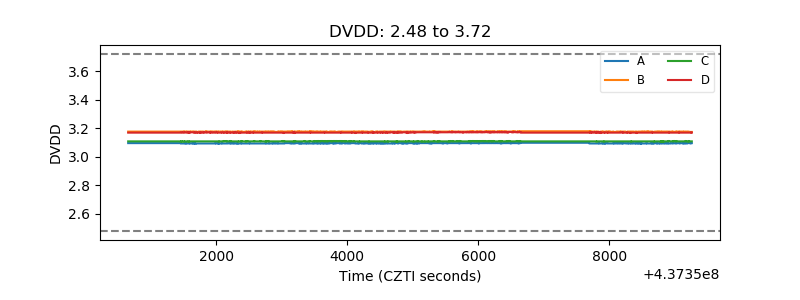 |
| Temperature 1 | 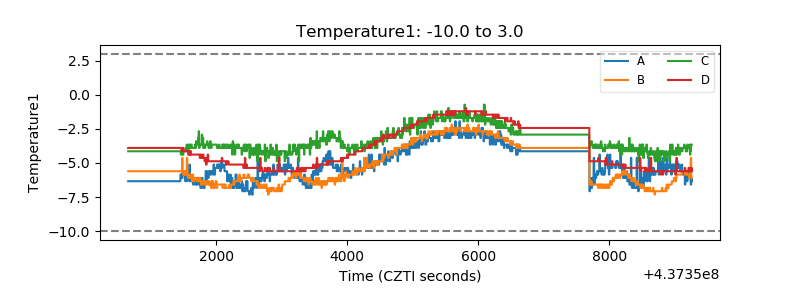 |
| Veto HV Monitor | 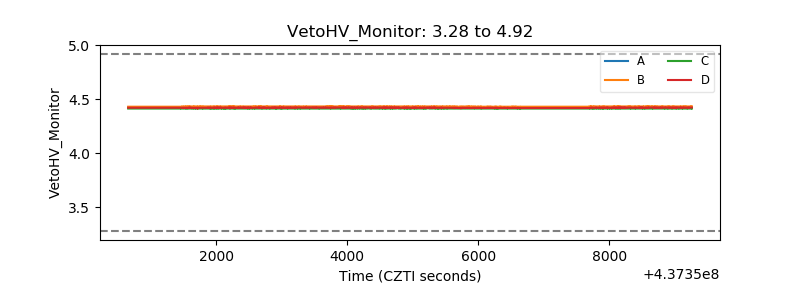 |
| Veto LLD | 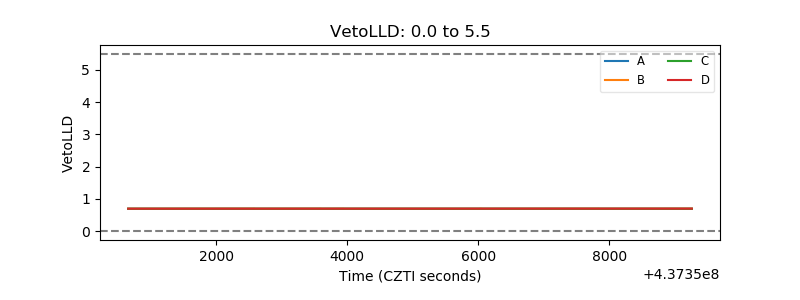 |
| Alpha Counter | 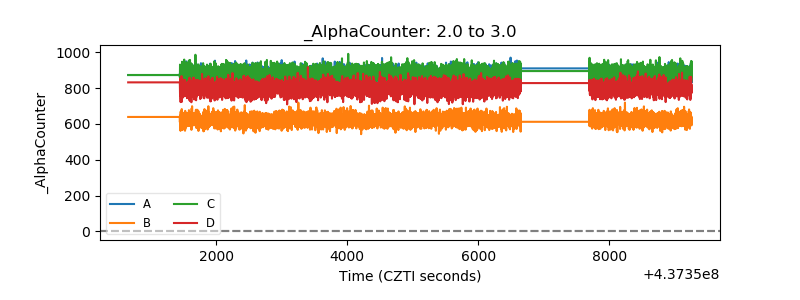 |
| _CPM_Rate | 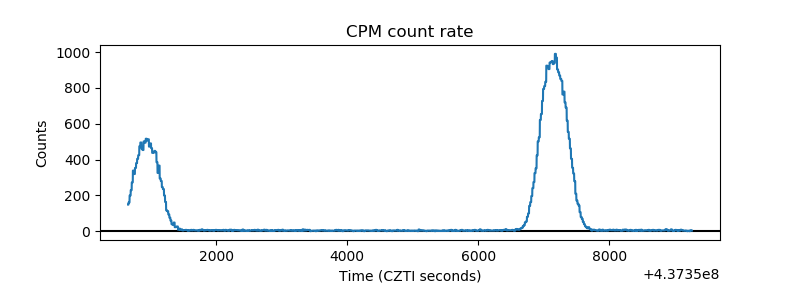 |
| CZT Counter | 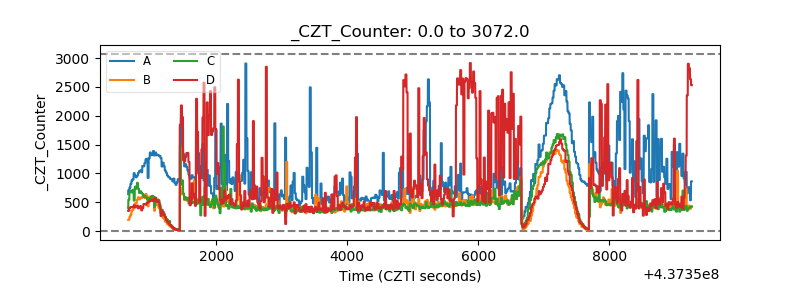 |
| +2.5 Volts monitor | 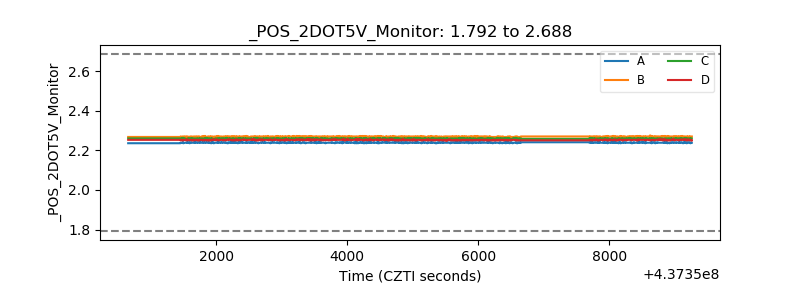 |
| +5 Volts monitor | 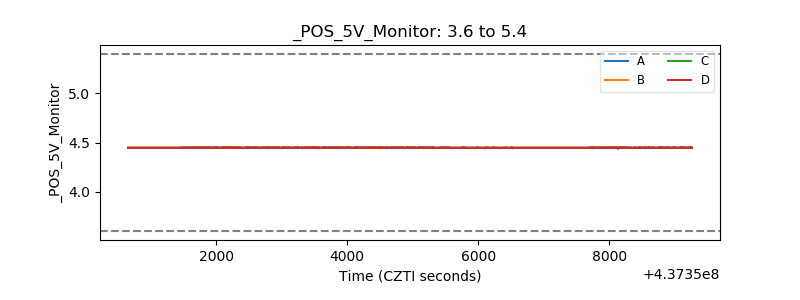 |
| _ROLL_ROT | 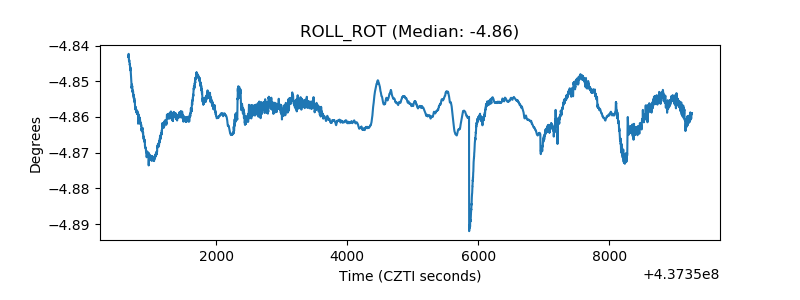 |
| _Roll_DEC | 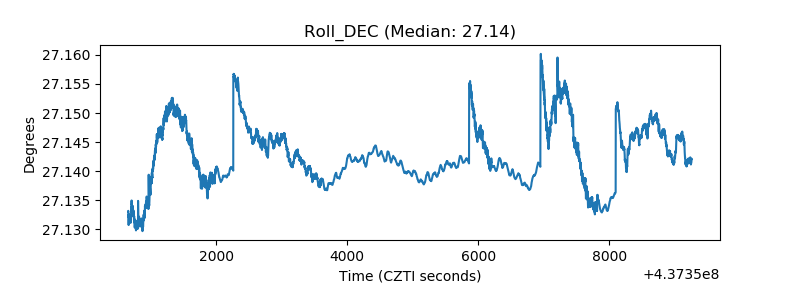 |
| _Roll_RA | 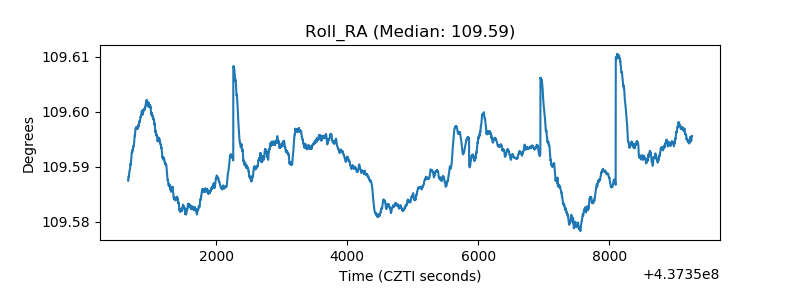 |
| Veto Counter | 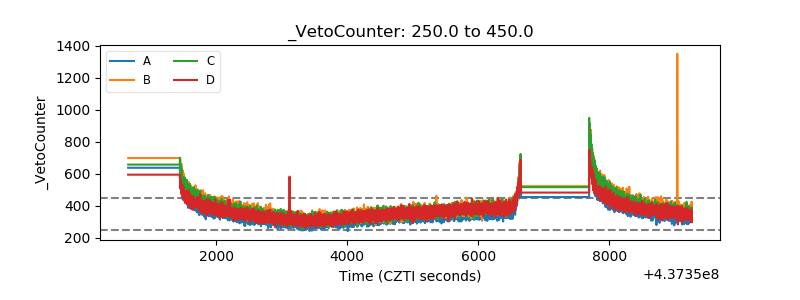 |