| Param | Original file | Final file |
|---|---|---|
| Filename | modeM0/AS1A13_009T02_9000005914_43908cztM0_level2.fits | modeM0/AS1A13_009T02_9000005914_43908cztM0_level2_quad_clean.evt |
| Size (bytes) | 1,735,297,920 | 339,341,760 |
| Size | 1.6 GB | 323.6 MB |
| Events in quadrant A | 22,381,606 | 2,166,814 |
| Events in quadrant B | 10,955,436 | 2,468,187 |
| Events in quadrant C | 9,635,735 | 2,342,036 |
| Events in quadrant D | 19,609,137 | 1,822,874 |
| Mode M9 | |||
|---|---|---|---|
| Quadrant | BADHDUFLAG | Total packets | Discarded packets |
| A | 0 | 43 | 0 |
| B | 0 | 43 | 0 |
| C | 0 | 43 | 0 |
| D | 0 | 43 | 0 |
| Mode SS | |||
|---|---|---|---|
| Quadrant | BADHDUFLAG | Total packets | Discarded packets |
| A | 0 | 436 | 0 |
| B | 0 | 436 | 0 |
| C | 0 | 436 | 0 |
| D | 0 | 436 | 0 |
| Mode M0 | |||
|---|---|---|---|
| Quadrant | BADHDUFLAG | Total packets | Discarded packets |
| A | 0 | 82315 | 7 |
| B | 0 | 47243 | 4 |
| C | 0 | 44310 | 4 |
| D | 0 | 73331 | 4 |
| Quadrant | Total seconds | Saturated seconds | Saturation percentage |
|---|---|---|---|
| A | 21414 | 2048 | 9.563837% |
| B | 21414 | 312 | 1.456991% |
| C | 21414 | 78 | 0.364248% |
| D | 21414 | 2707 | 12.641263% |
Noise dominated data is calculated using 1-second bins in cleaned event files. If a bin has >2000 counts, and if more than 50% of those come from <1% of pixels, then it is considered to be noise-dominated and hence unusable.
| Quadrant | # 1 sec bins | Bins with >0 counts | Bins with >2000 counts | High rate bins dominated by noise | Noise dominated (total time) | Noise dominated (detector-on time) | Marked lightcurve |
|---|---|---|---|---|---|---|---|
| A | 25709 | 21418 | 1632 | 1632 | 6.35% | 7.62% | 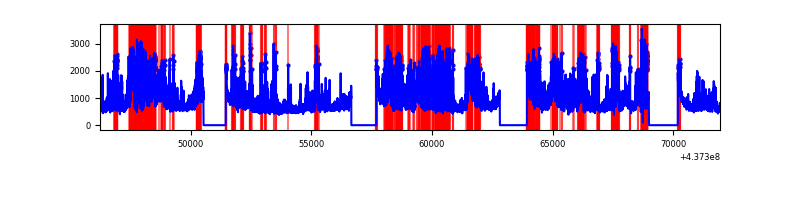 |
| B | 25709 | 21418 | 115 | 115 | 0.45% | 0.54% | 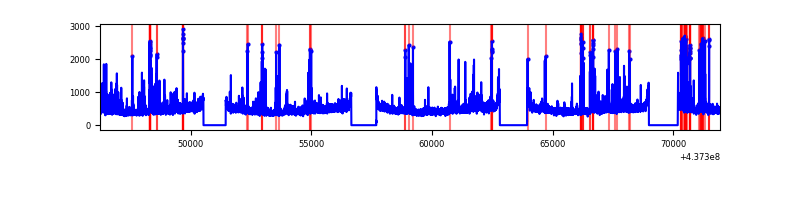 |
| C | 25709 | 21418 | 12 | 12 | 0.05% | 0.06% | 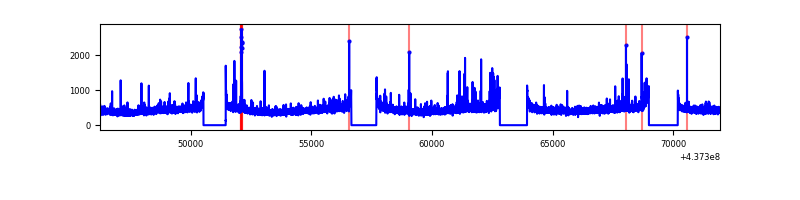 |
| D | 25709 | 21418 | 2497 | 2497 | 9.71% | 11.66% | 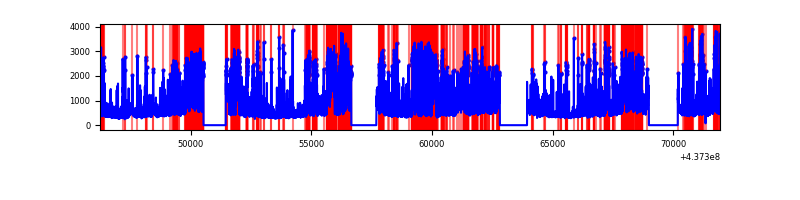 |
Top three noisy pixels from each quadrant. If the there are fewer than three noisy pixels in the level2.evt file, extra rows are filled as -1
| Pixel properties | Quadrant properties | ||||||
|---|---|---|---|---|---|---|---|
| Quadrant | DetID | PixID | Counts | Sigma | Mean | Median | Sigma |
| A | 15 | 223 | 7624641 | 15928.56 | 2340 | 2295 | 478.5 |
| A | 10 | 83 | 3295401 | 6881.66 | 2340 | 2295 | 478.5 |
| A | 15 | 222 | 1408767 | 2939.13 | 2340 | 2295 | 478.5 |
| B | 5 | 172 | 586767 | 1255.14 | 2401 | 2331 | 465.6 |
| B | 0 | 200 | 315727 | 673.05 | 2401 | 2331 | 465.6 |
| B | 5 | 235 | 268733 | 572.13 | 2401 | 2331 | 465.6 |
| C | 3 | 233 | 189703 | 342.13 | 2350 | 2369 | 547.6 |
| C | 14 | 254 | 128582 | 230.5 | 2350 | 2369 | 547.6 |
| C | 15 | 157 | 36353 | 62.07 | 2350 | 2369 | 547.6 |
| D | 1 | 52 | 2686211 | 4836.51 | 2219 | 2158 | 555.0 |
| D | 12 | 233 | 2199536 | 3959.55 | 2219 | 2158 | 555.0 |
| D | 12 | 128 | 1081476 | 1944.87 | 2219 | 2158 | 555.0 |
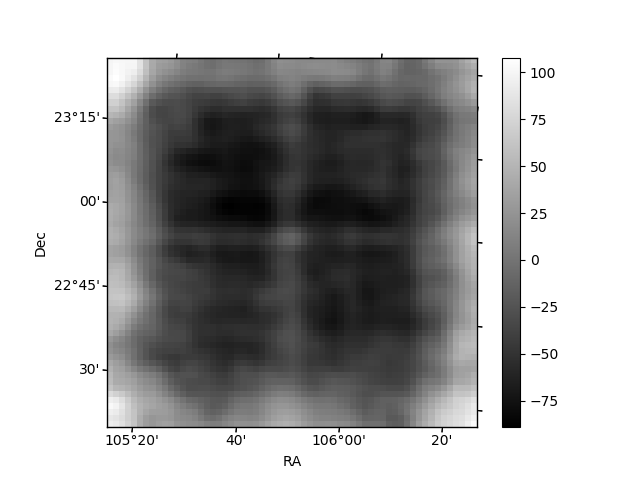
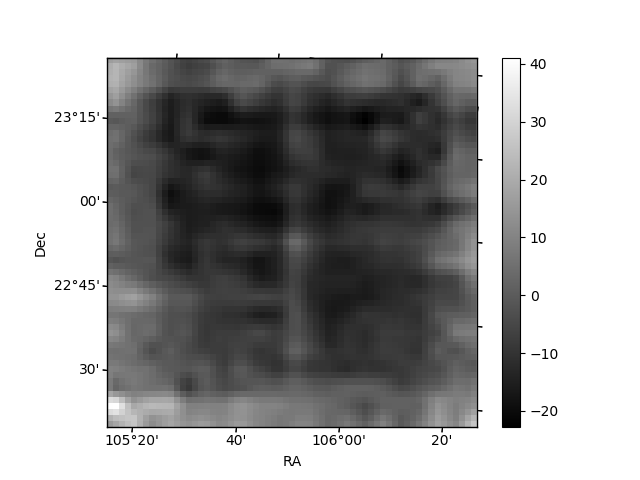
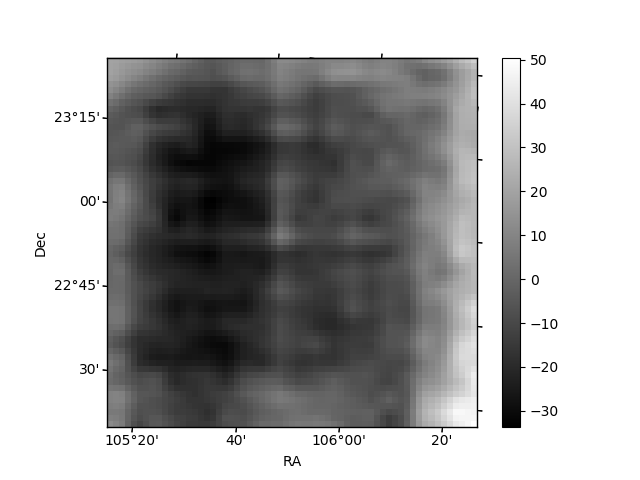
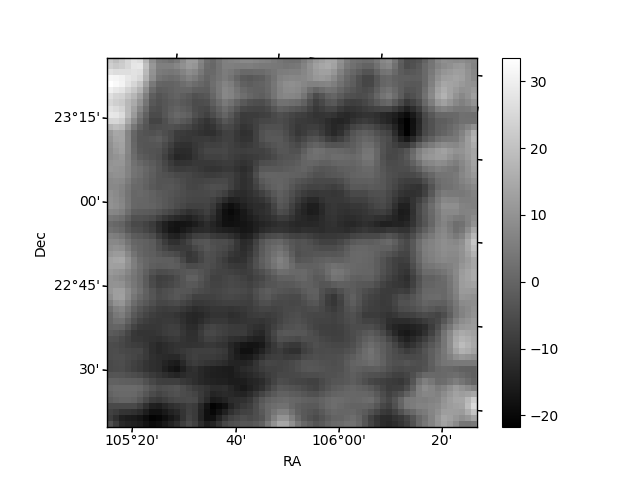
Histogram calculated using DETX and DETY for each event in the final _common_clean file
| Quadrant A | 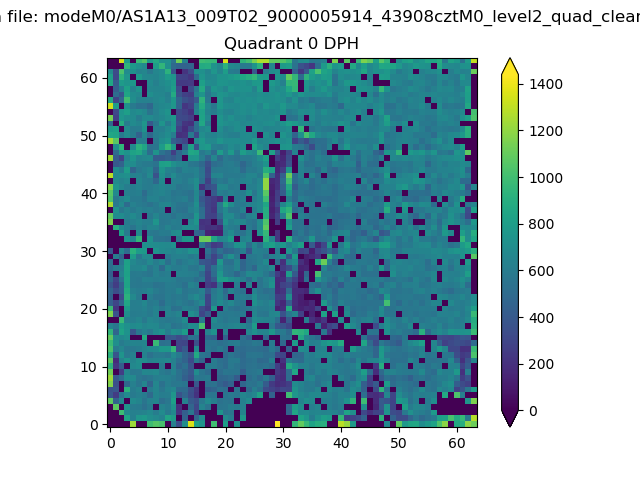 |
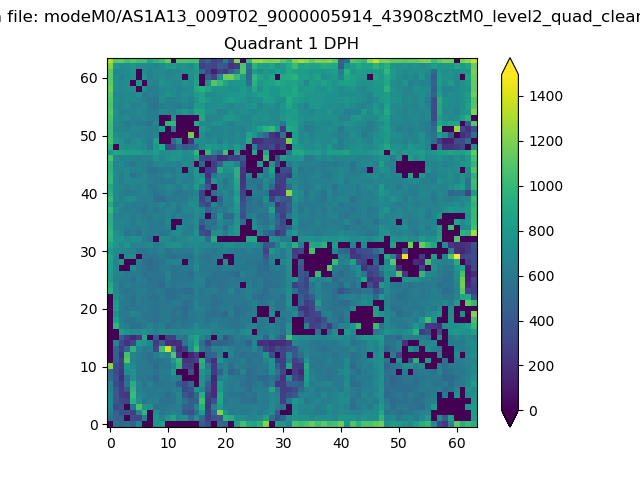 |
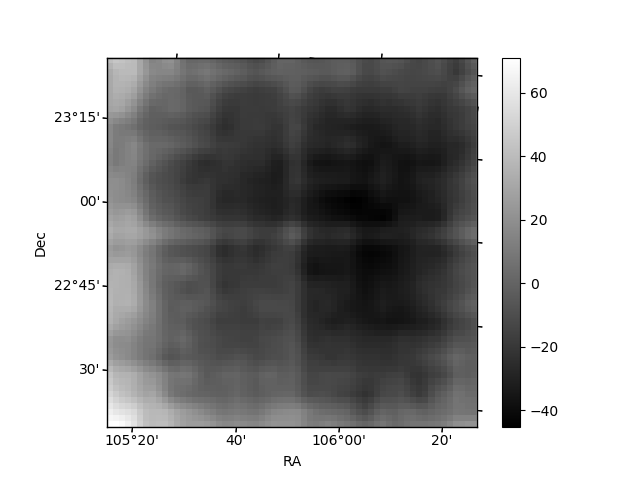
Quadrant B |
|---|---|---|---|
| Quadrant D | 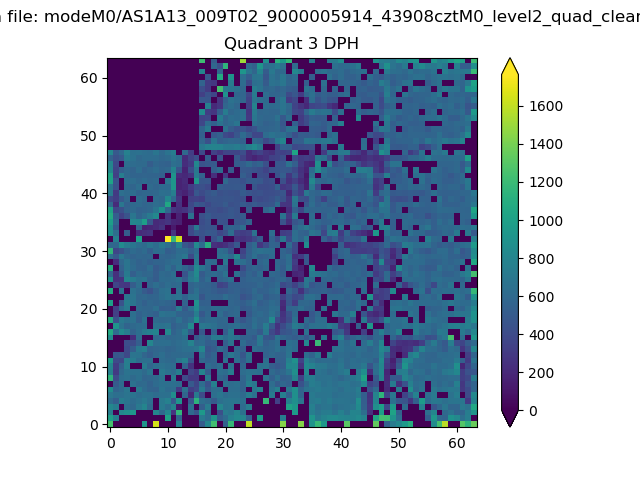 |
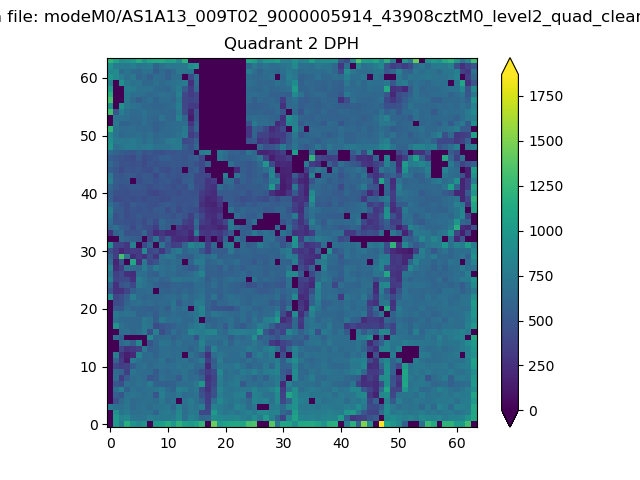 |
Quadrant C |
| Plot type | Count rate plots | Images |
|---|---|---|
| Comparison with Poisson distribution Blue bars denote a histogram of data divided into 1 sec bins. Red curve is a Poisson curve with rate = median count rate of data. |
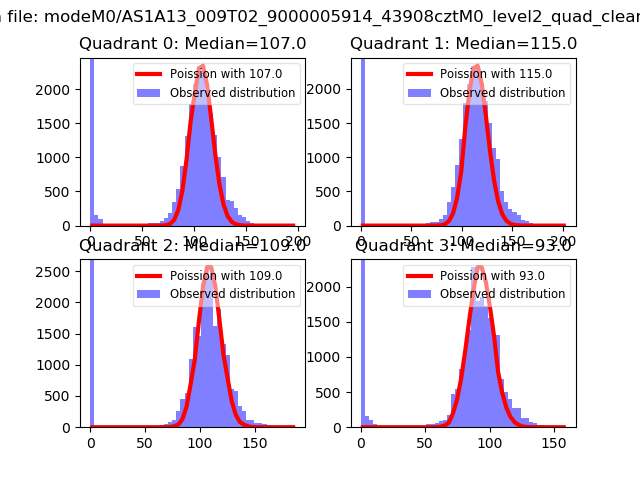 |
 |
| Quadrant-wise count rates Data is divided into 100 sec bins |
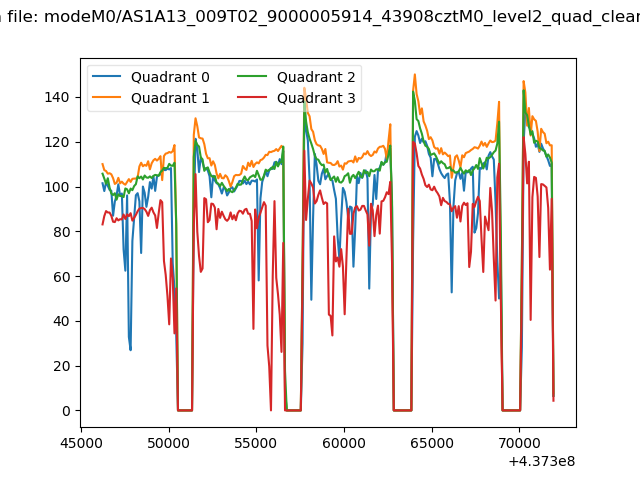 |
|
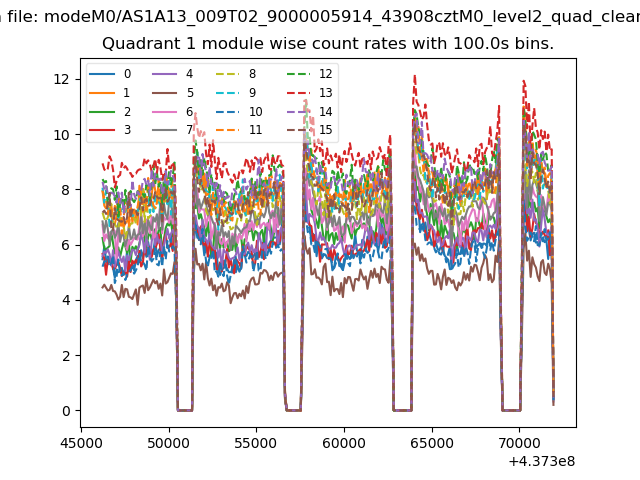
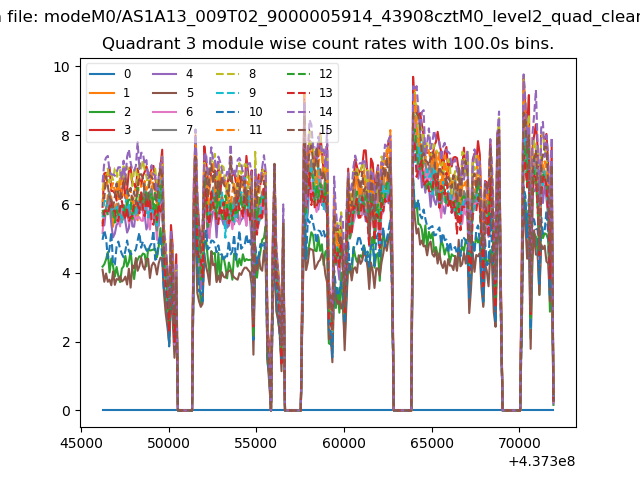
| Module-wise count rates for Quadrant A Data is divided into 100 sec bins |
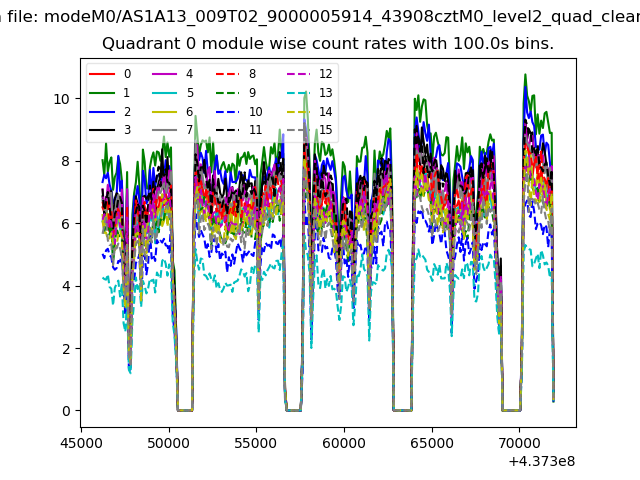 |
 |
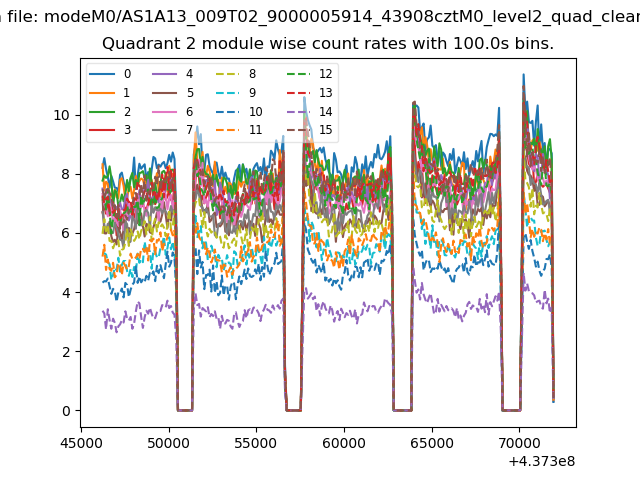
| Module-wise count rates for Quadrant B Data is divided into 100 sec bins |
 |
 |
| Module-wise count rates for Quadrant C Data is divided into 100 sec bins |
 |
 |
| Module-wise count rates for Quadrant D Data is divided into 100 sec bins |
 |
 |
| Parameter | Plot |
|---|---|
| CZT HV Monitor | 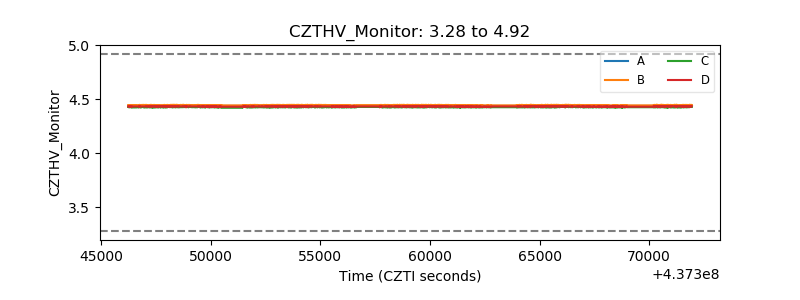 |
| D_VDD | 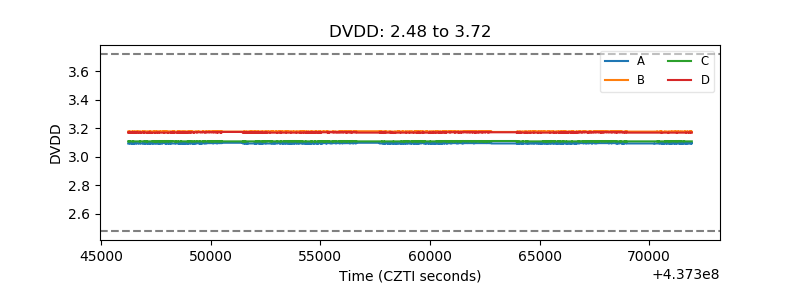 |
| Temperature 1 | 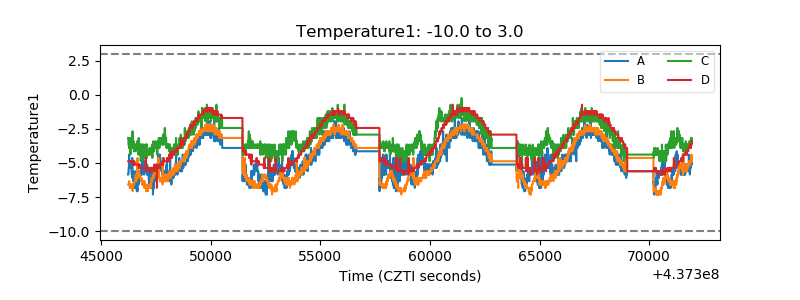 |
| Veto HV Monitor | 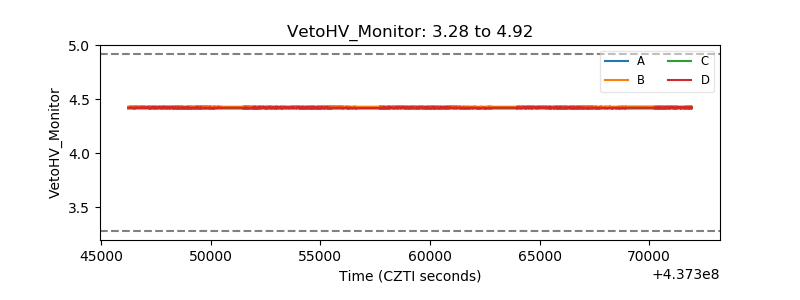 |
| Veto LLD | 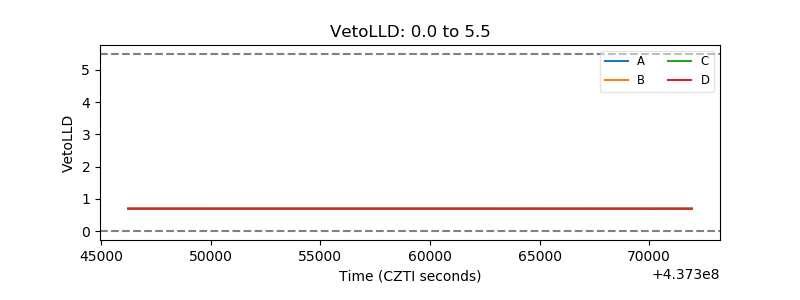 |
| Alpha Counter | 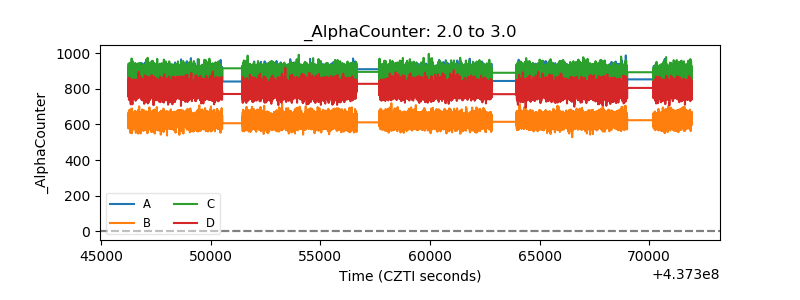 |
| _CPM_Rate | 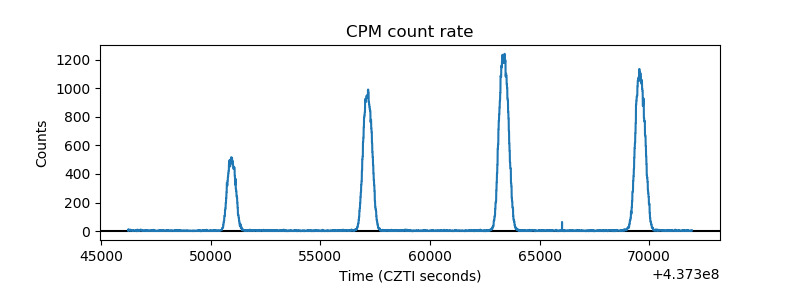 |
| CZT Counter | 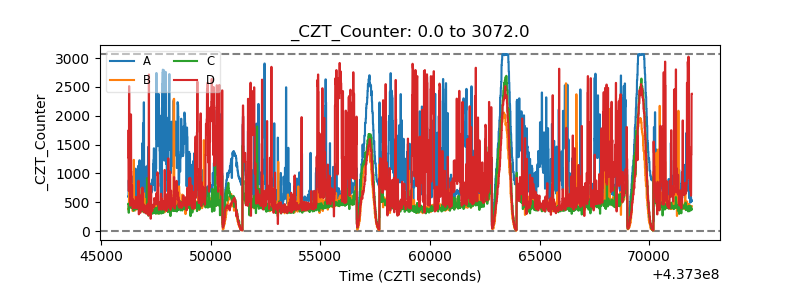 |
| +2.5 Volts monitor | 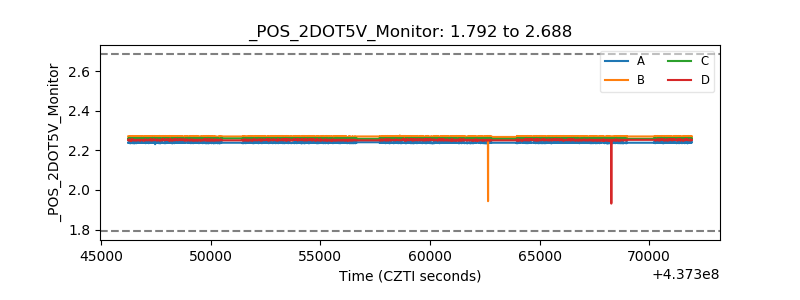 |
| +5 Volts monitor | 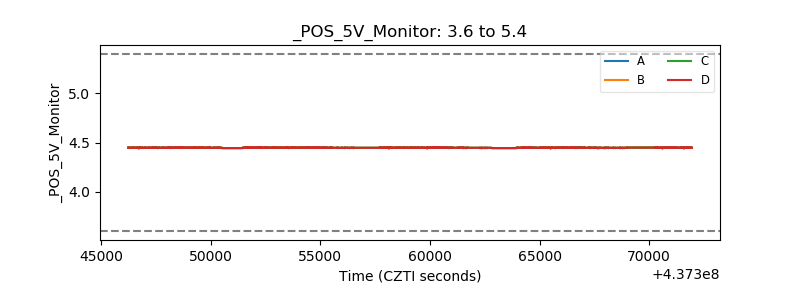 |
| _ROLL_ROT | 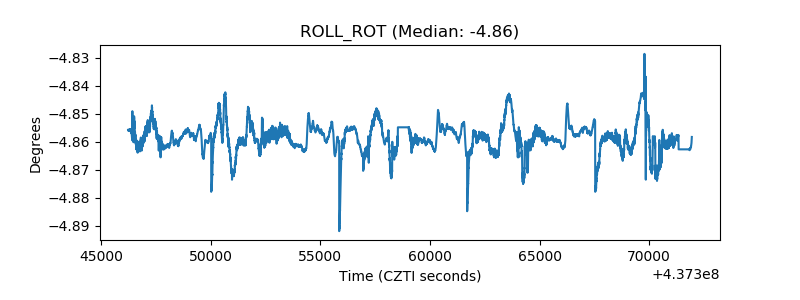 |
| _Roll_DEC | 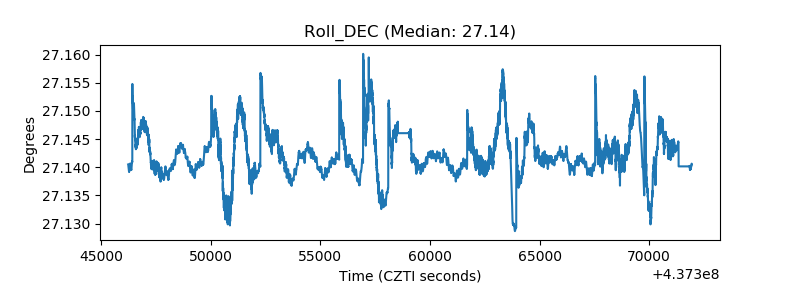 |
| _Roll_RA | 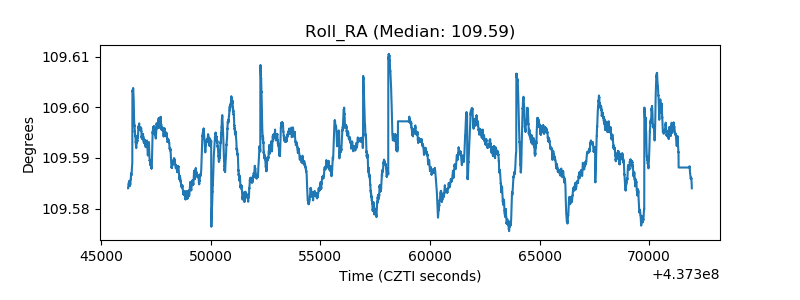 |
| Veto Counter | 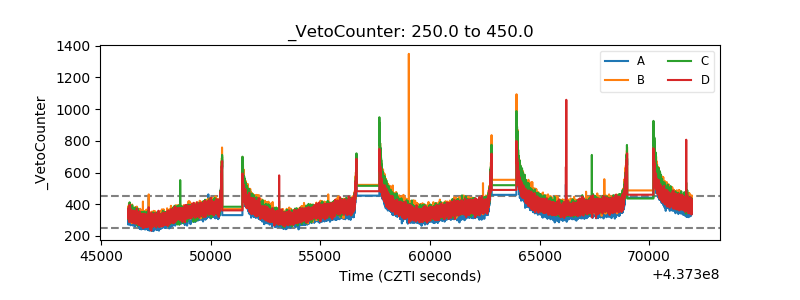 |