| Param | Original file | Final file |
|---|---|---|
| Filename | modeM0/AS1A13_009T02_9000005914_43909cztM0_level2.fits | modeM0/AS1A13_009T02_9000005914_43909cztM0_level2_quad_clean.evt |
| Size (bytes) | 505,033,920 | 112,536,000 |
| Size | 481.6 MB | 107.3 MB |
| Events in quadrant A | 5,595,660 | 764,300 |
| Events in quadrant B | 3,967,405 | 789,444 |
| Events in quadrant C | 3,034,183 | 759,181 |
| Events in quadrant D | 5,590,407 | 639,235 |
| Mode M9 | |||
|---|---|---|---|
| Quadrant | BADHDUFLAG | Total packets | Discarded packets |
| A | 0 | 12 | 0 |
| B | 0 | 12 | 0 |
| C | 0 | 12 | 0 |
| D | 0 | 12 | 0 |
| Mode SS | |||
|---|---|---|---|
| Quadrant | BADHDUFLAG | Total packets | Discarded packets |
| A | 0 | 132 | 0 |
| B | 0 | 132 | 0 |
| C | 0 | 132 | 0 |
| D | 0 | 132 | 0 |
| Mode M0 | |||
|---|---|---|---|
| Quadrant | BADHDUFLAG | Total packets | Discarded packets |
| A | 0 | 21530 | 2 |
| B | 0 | 16054 | 2 |
| C | 0 | 13529 | 2 |
| D | 0 | 21049 | 2 |
| Quadrant | Total seconds | Saturated seconds | Saturation percentage |
|---|---|---|---|
| A | 6535 | 247 | 3.779648% |
| B | 6536 | 239 | 3.656671% |
| C | 6536 | 12 | 0.183599% |
| D | 6536 | 613 | 9.378825% |
Noise dominated data is calculated using 1-second bins in cleaned event files. If a bin has >2000 counts, and if more than 50% of those come from <1% of pixels, then it is considered to be noise-dominated and hence unusable.
| Quadrant | # 1 sec bins | Bins with >0 counts | Bins with >2000 counts | High rate bins dominated by noise | Noise dominated (total time) | Noise dominated (detector-on time) | Marked lightcurve |
|---|---|---|---|---|---|---|---|
| A | 7735 | 6536 | 70 | 70 | 0.90% | 1.07% | 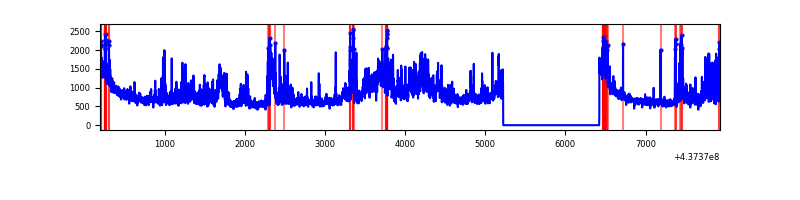 |
| B | 7736 | 6537 | 180 | 180 | 2.33% | 2.75% | 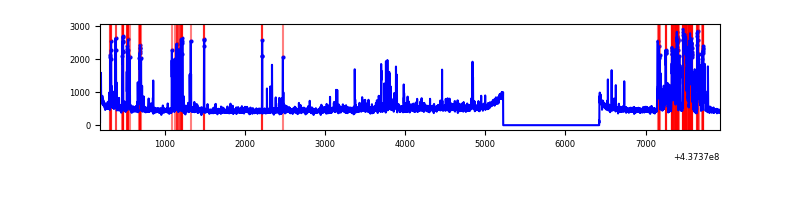 |
| C | 7736 | 6537 | 3 | 3 | 0.04% | 0.05% | 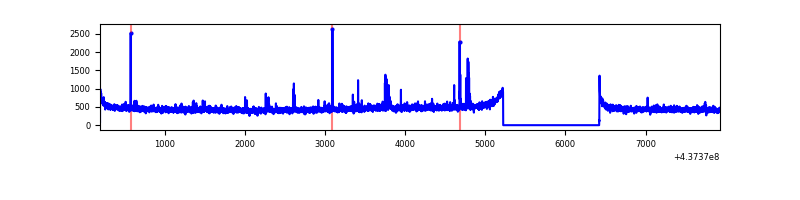 |
| D | 7736 | 6537 | 588 | 588 | 7.60% | 8.99% | 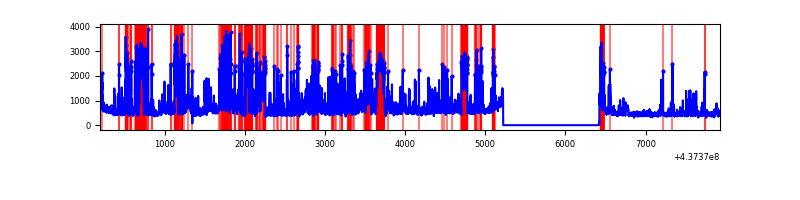 |
Top three noisy pixels from each quadrant. If the there are fewer than three noisy pixels in the level2.evt file, extra rows are filled as -1
| Pixel properties | Quadrant properties | ||||||
|---|---|---|---|---|---|---|---|
| Quadrant | DetID | PixID | Counts | Sigma | Mean | Median | Sigma |
| A | 15 | 223 | 1395363 | 8817.3 | 766 | 751 | 158.2 |
| A | 10 | 83 | 1136579 | 7181.16 | 766 | 751 | 158.2 |
| A | 7 | 191 | 52127 | 324.82 | 766 | 751 | 158.2 |
| B | 5 | 172 | 764775 | 5216.58 | 760 | 739 | 146.5 |
| B | 0 | 200 | 64963 | 438.5 | 760 | 739 | 146.5 |
| B | 7 | 221 | 36726 | 245.71 | 760 | 739 | 146.5 |
| C | 3 | 233 | 44676 | 251.43 | 746 | 750 | 174.7 |
| C | 15 | 158 | 25583 | 142.14 | 746 | 750 | 174.7 |
| C | 15 | 157 | 17834 | 97.79 | 746 | 750 | 174.7 |
| D | 7 | 80 | 1050760 | 5796.82 | 718 | 696 | 181.1 |
| D | 1 | 52 | 550293 | 3034.02 | 718 | 696 | 181.1 |
| D | 5 | 222 | 244629 | 1346.62 | 718 | 696 | 181.1 |
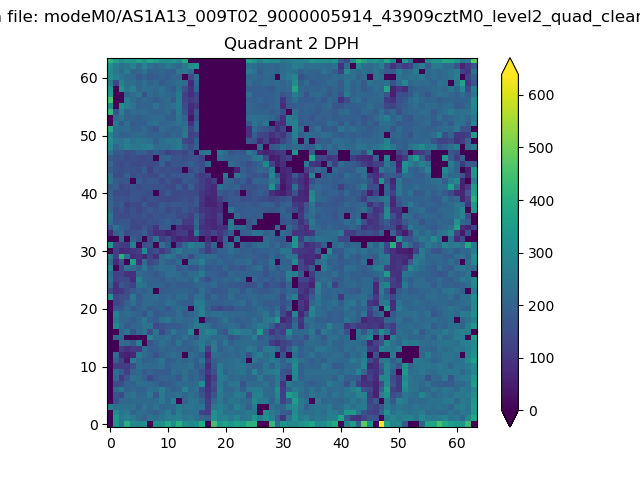
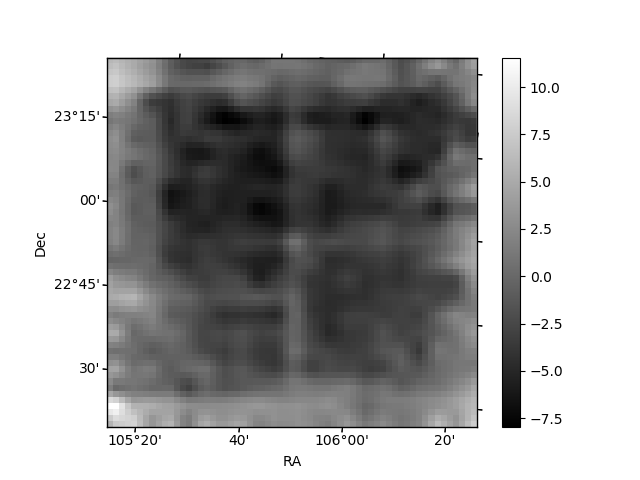
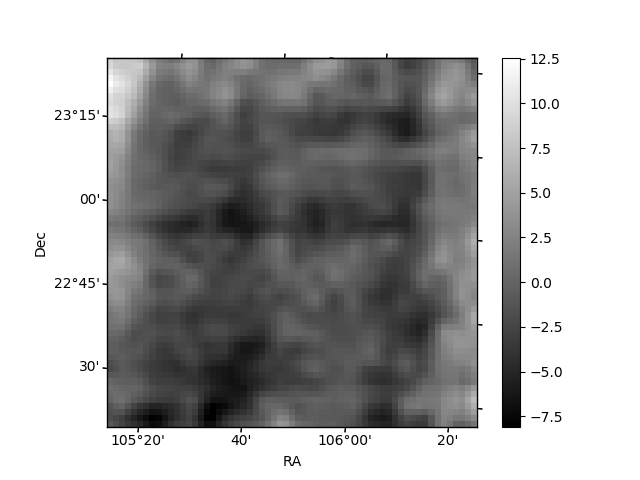
Histogram calculated using DETX and DETY for each event in the final _common_clean file
| Quadrant A | 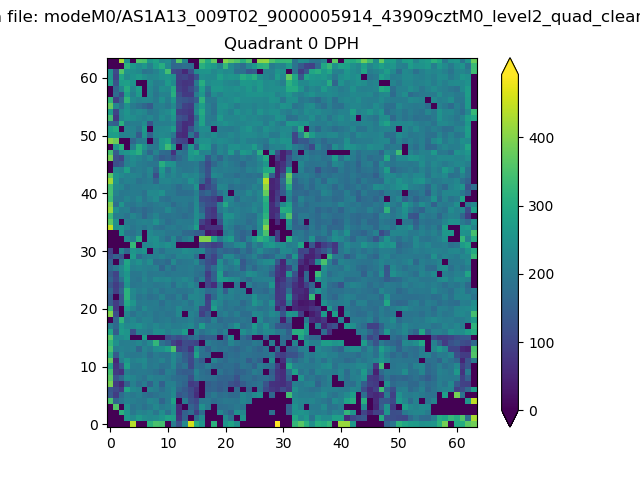 |
 |
Quadrant B |
|---|---|---|---|
| Quadrant D |  |
 |
Quadrant C |
| Plot type | Count rate plots | Images |
|---|---|---|
| Comparison with Poisson distribution Blue bars denote a histogram of data divided into 1 sec bins. Red curve is a Poisson curve with rate = median count rate of data. |
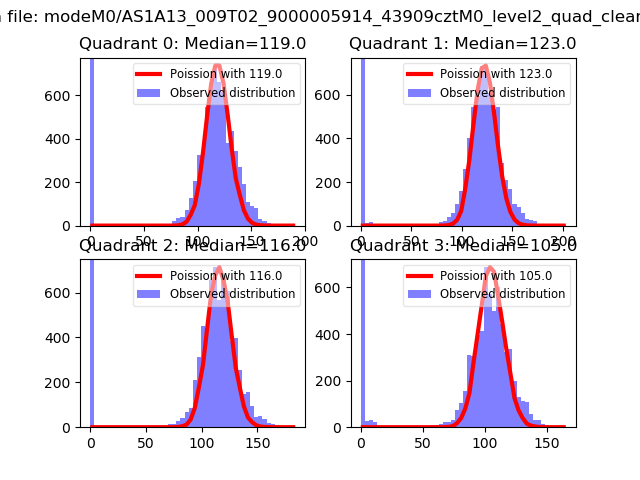 |
 |
| Quadrant-wise count rates Data is divided into 100 sec bins |
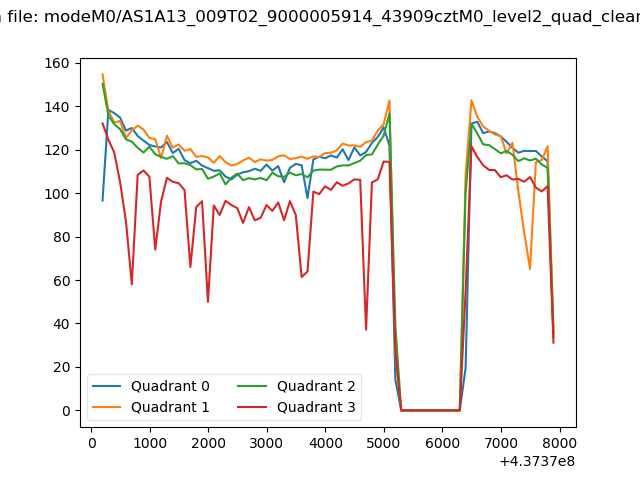 |
|
| Module-wise count rates for Quadrant A Data is divided into 100 sec bins |
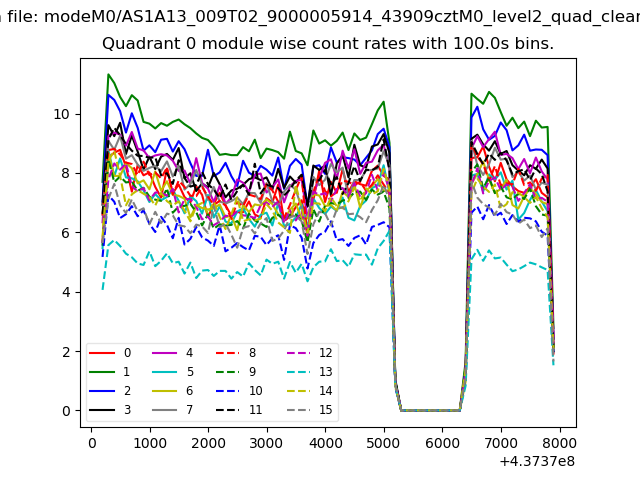 |
 |
| Module-wise count rates for Quadrant B Data is divided into 100 sec bins |
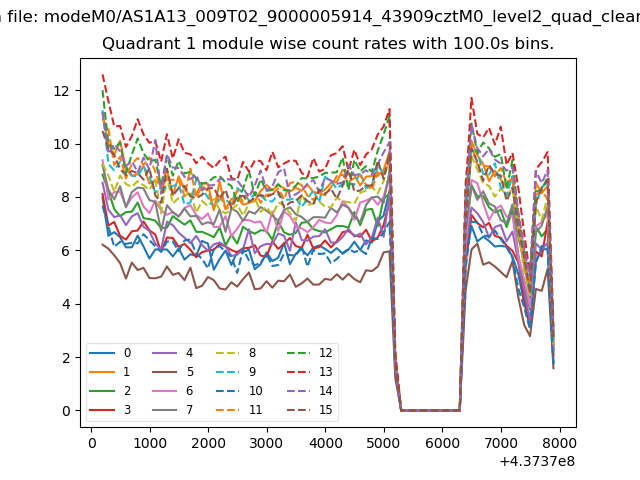 |
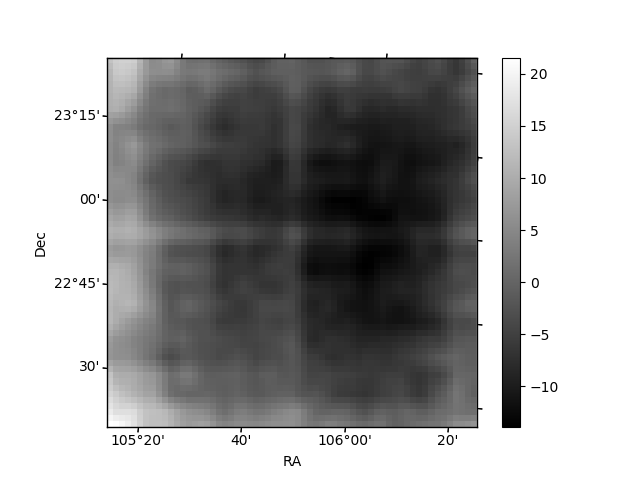 |
| Module-wise count rates for Quadrant C Data is divided into 100 sec bins |
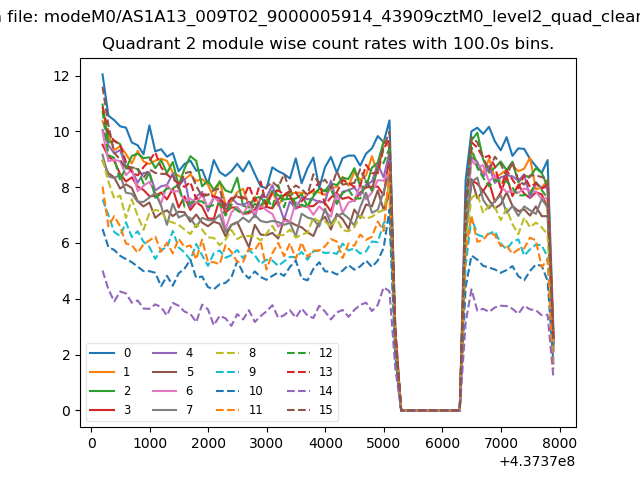 |
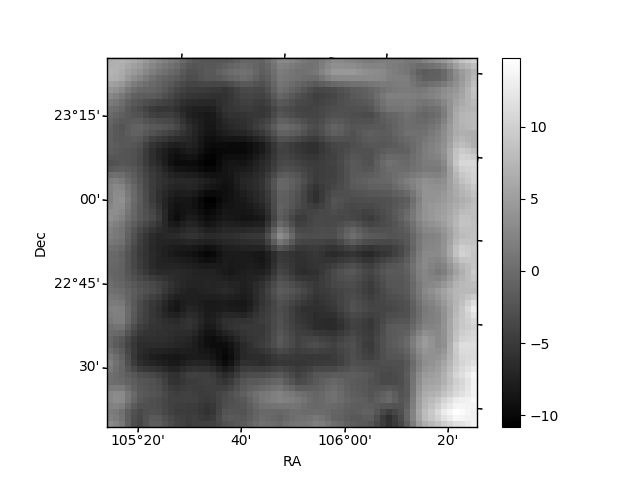 |
| Module-wise count rates for Quadrant D Data is divided into 100 sec bins |
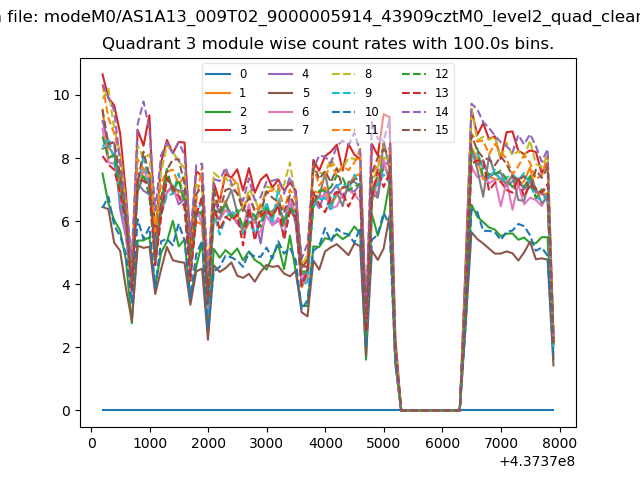 |
 |
| Parameter | Plot |
|---|---|
| CZT HV Monitor | 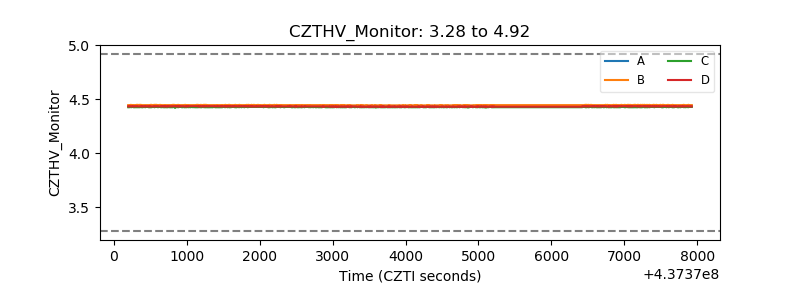 |
| D_VDD | 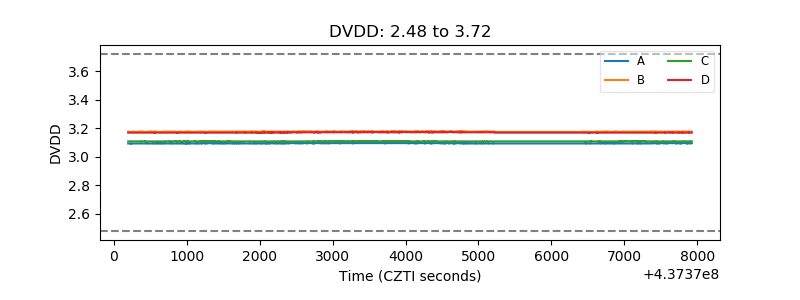 |
| Temperature 1 | 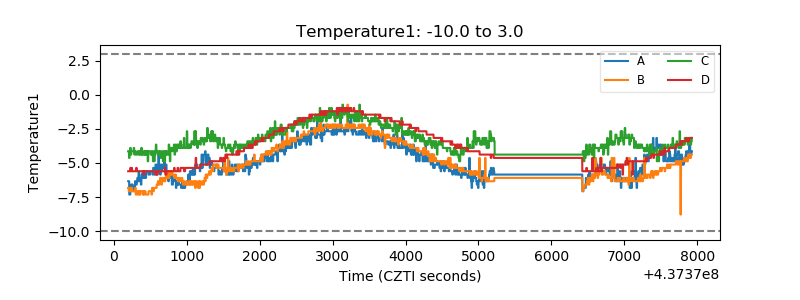 |
| Veto HV Monitor | 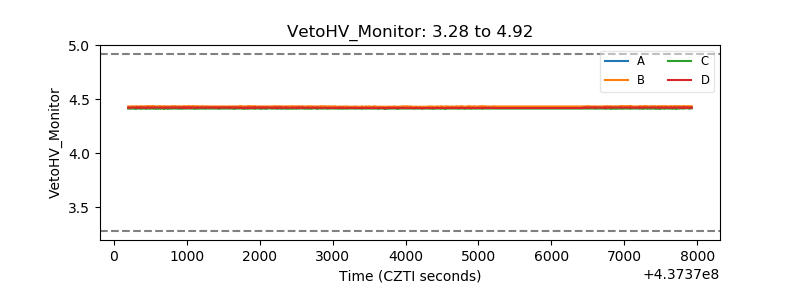 |
| Veto LLD | 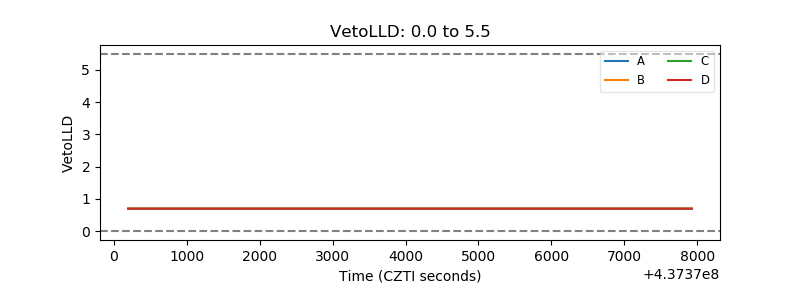 |
| Alpha Counter | 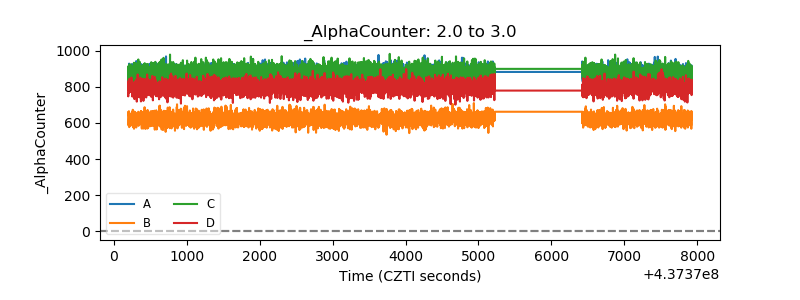 |
| _CPM_Rate | 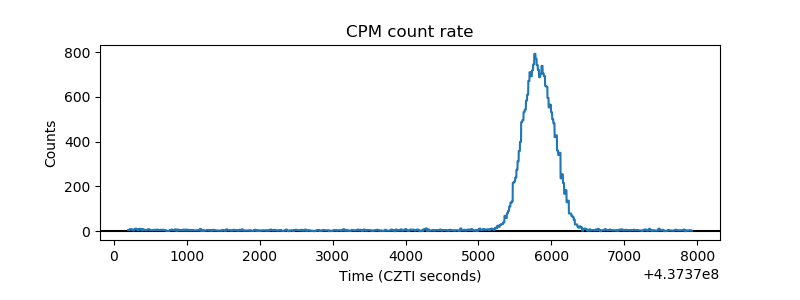 |
| CZT Counter | 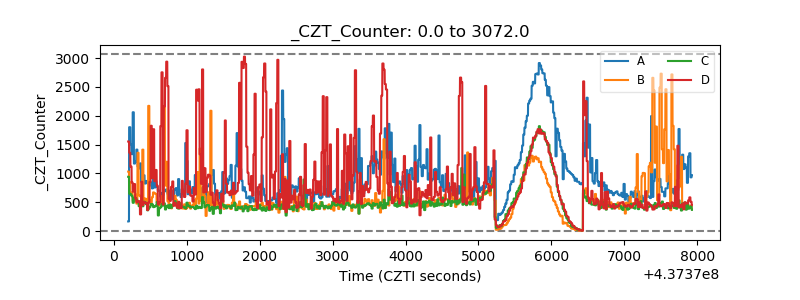 |
| +2.5 Volts monitor | 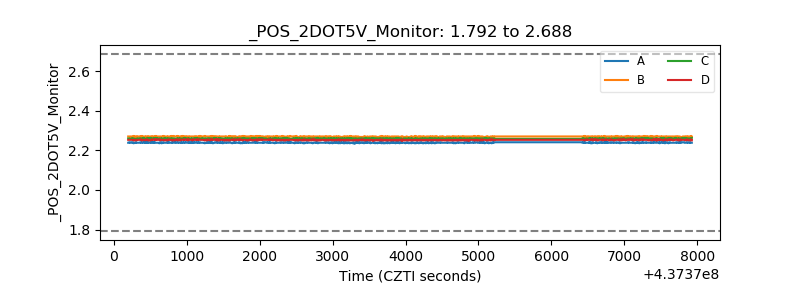 |
| +5 Volts monitor | 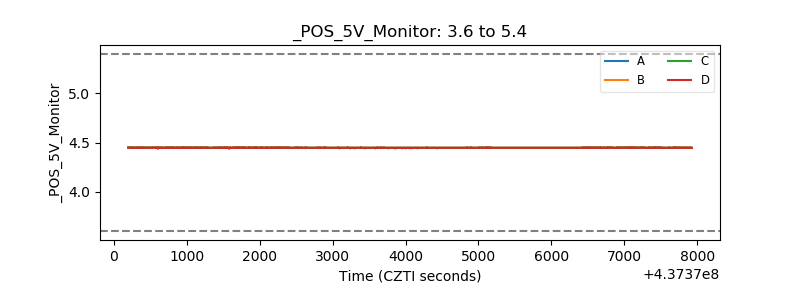 |
| _ROLL_ROT | 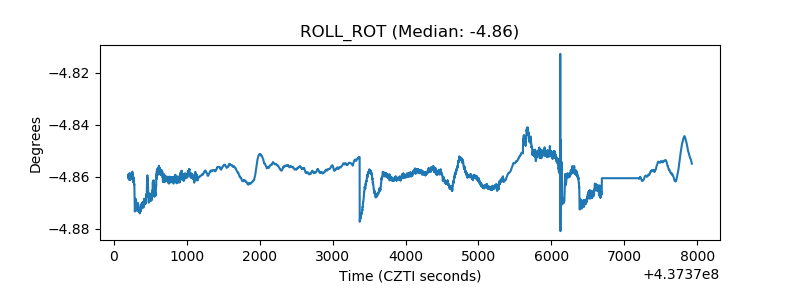 |
| _Roll_DEC | 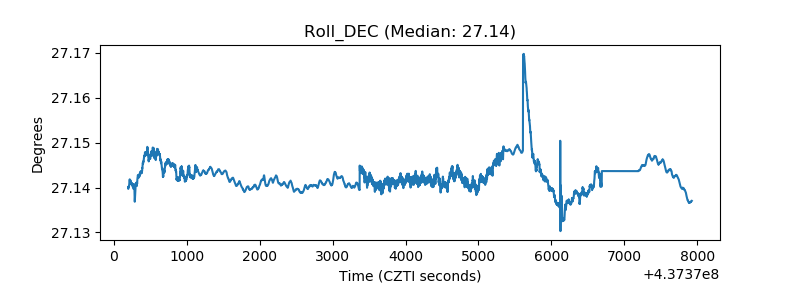 |
| _Roll_RA | 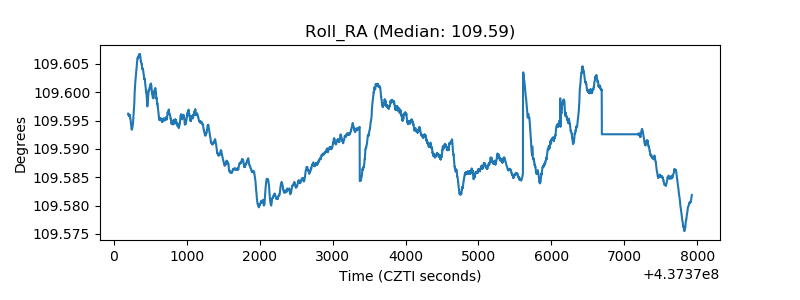 |
| Veto Counter | 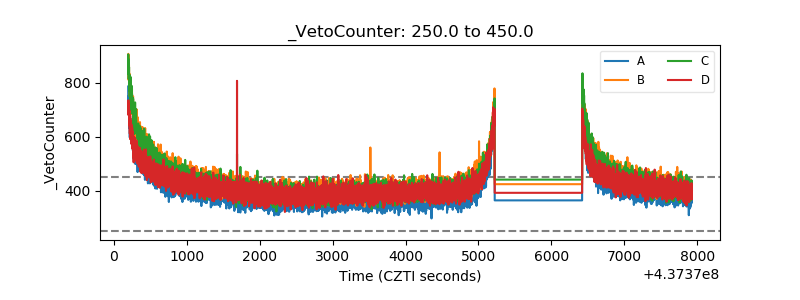 |