| Param | Original file | Final file |
|---|---|---|
| Filename | modeM0/AS1A13_009T02_9000005914_43910cztM0_level2.fits | modeM0/AS1A13_009T02_9000005914_43910cztM0_level2_quad_clean.evt |
| Size (bytes) | 434,393,280 | 96,425,280 |
| Size | 414.3 MB | 92.0 MB |
| Events in quadrant A | 5,145,172 | 625,097 |
| Events in quadrant B | 3,847,819 | 654,259 |
| Events in quadrant C | 2,782,020 | 647,577 |
| Events in quadrant D | 3,852,437 | 586,286 |
| Mode M9 | |||
|---|---|---|---|
| Quadrant | BADHDUFLAG | Total packets | Discarded packets |
| A | 0 | 11 | 0 |
| B | 0 | 11 | 0 |
| C | 0 | 11 | 0 |
| D | 0 | 11 | 0 |
| Mode SS | |||
|---|---|---|---|
| Quadrant | BADHDUFLAG | Total packets | Discarded packets |
| A | 0 | 118 | 0 |
| B | 0 | 118 | 0 |
| C | 0 | 118 | 0 |
| D | 0 | 118 | 0 |
| Mode M0 | |||
|---|---|---|---|
| Quadrant | BADHDUFLAG | Total packets | Discarded packets |
| A | 0 | 19774 | 1 |
| B | 0 | 15260 | 2 |
| C | 0 | 12294 | 1 |
| D | 0 | 15436 | 1 |
| Quadrant | Total seconds | Saturated seconds | Saturation percentage |
|---|---|---|---|
| A | 5819 | 523 | 8.987799% |
| B | 5819 | 388 | 6.667812% |
| C | 5819 | 62 | 1.065475% |
| D | 5819 | 148 | 2.543392% |
Noise dominated data is calculated using 1-second bins in cleaned event files. If a bin has >2000 counts, and if more than 50% of those come from <1% of pixels, then it is considered to be noise-dominated and hence unusable.
| Quadrant | # 1 sec bins | Bins with >0 counts | Bins with >2000 counts | High rate bins dominated by noise | Noise dominated (total time) | Noise dominated (detector-on time) | Marked lightcurve |
|---|---|---|---|---|---|---|---|
| A | 6904 | 5820 | 278 | 278 | 4.03% | 4.78% | 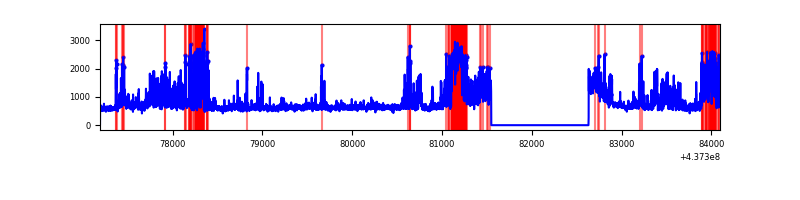 |
| B | 6904 | 5820 | 285 | 285 | 4.13% | 4.90% | 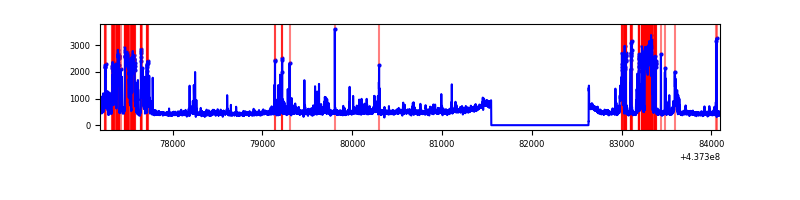 |
| C | 6904 | 5820 | 7 | 7 | 0.10% | 0.12% | 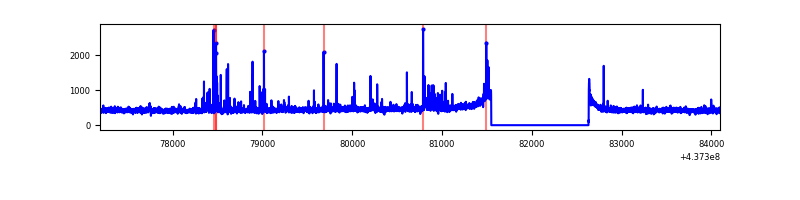 |
| D | 6904 | 5820 | 102 | 102 | 1.48% | 1.75% | 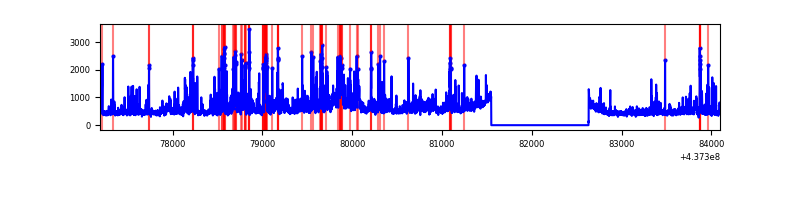 |
Top three noisy pixels from each quadrant. If the there are fewer than three noisy pixels in the level2.evt file, extra rows are filled as -1
| Pixel properties | Quadrant properties | ||||||
|---|---|---|---|---|---|---|---|
| Quadrant | DetID | PixID | Counts | Sigma | Mean | Median | Sigma |
| A | 15 | 223 | 1545302 | 11177.73 | 663 | 649 | 138.2 |
| A | 10 | 83 | 909551 | 6577.18 | 663 | 649 | 138.2 |
| A | 7 | 191 | 76720 | 550.48 | 663 | 649 | 138.2 |
| B | 5 | 172 | 1029002 | 7841.22 | 660 | 644 | 131.1 |
| B | 5 | 235 | 69083 | 521.85 | 660 | 644 | 131.1 |
| B | 0 | 200 | 56475 | 425.71 | 660 | 644 | 131.1 |
| C | 14 | 254 | 102810 | 659.86 | 660 | 664 | 154.8 |
| C | 3 | 233 | 36274 | 230.04 | 660 | 664 | 154.8 |
| C | 15 | 158 | 21764 | 136.31 | 660 | 664 | 154.8 |
| D | 1 | 52 | 211369 | 1231.86 | 666 | 643 | 171.1 |
| D | 12 | 233 | 163088 | 949.62 | 666 | 643 | 171.1 |
| D | 5 | 235 | 158506 | 922.84 | 666 | 643 | 171.1 |
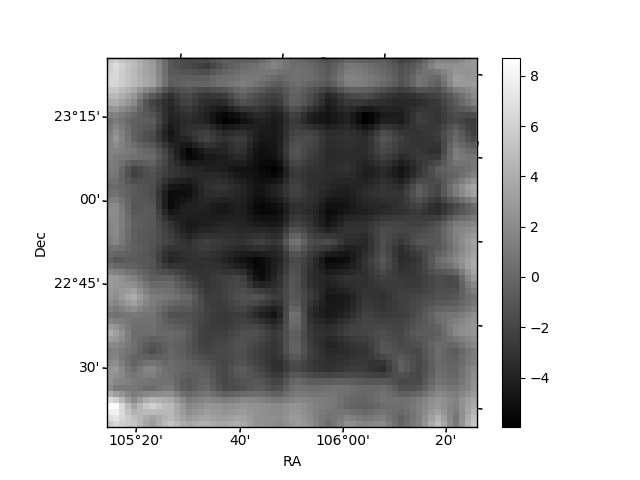
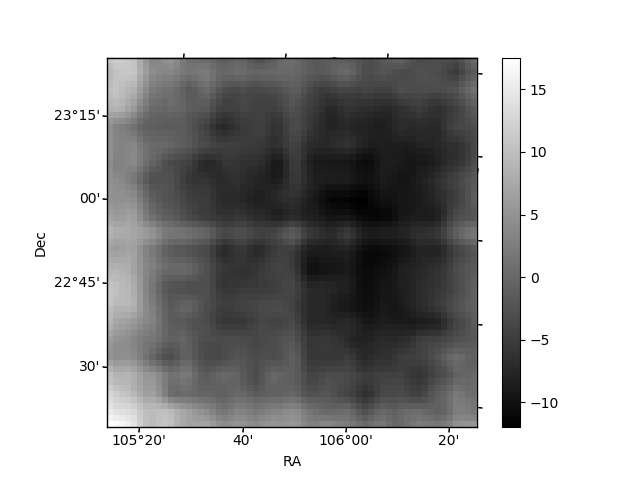
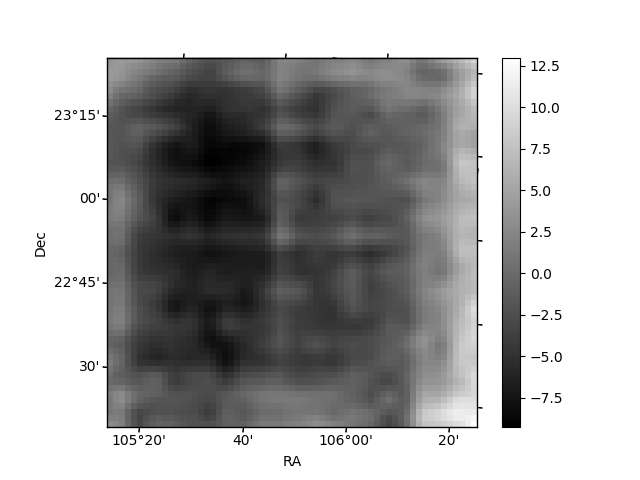
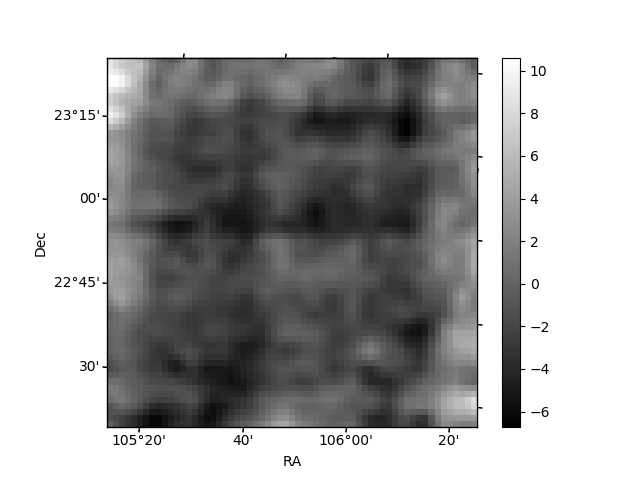
Histogram calculated using DETX and DETY for each event in the final _common_clean file
| Quadrant A | 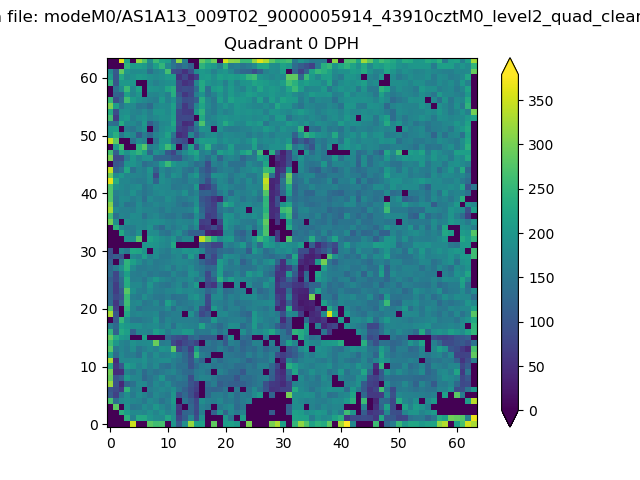 |
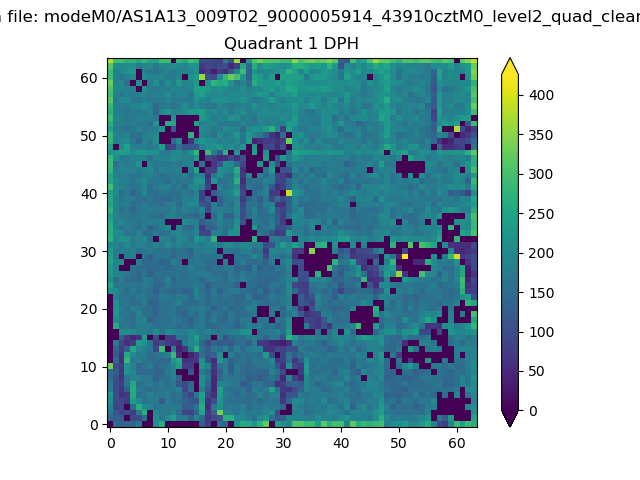 |
Quadrant B |
|---|---|---|---|
| Quadrant D | 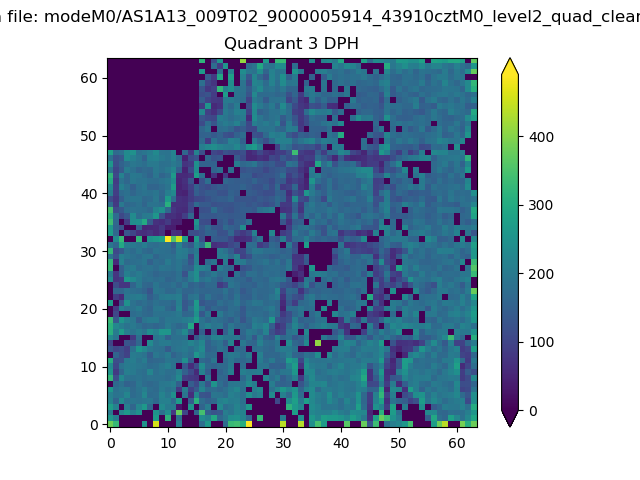 |
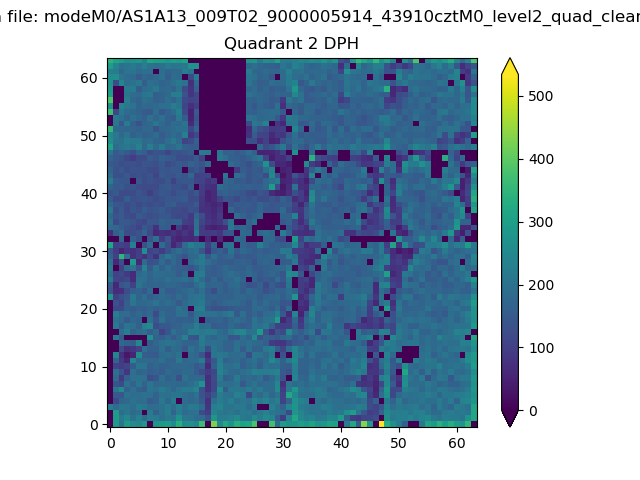 |
Quadrant C |
| Plot type | Count rate plots | Images |
|---|---|---|
| Comparison with Poisson distribution Blue bars denote a histogram of data divided into 1 sec bins. Red curve is a Poisson curve with rate = median count rate of data. |
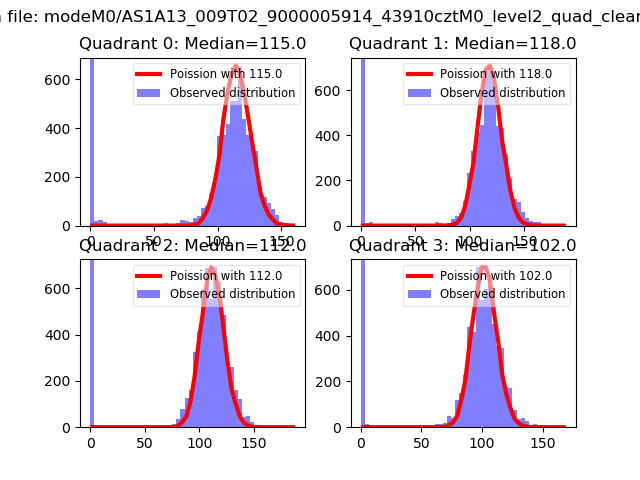 |
 |
| Quadrant-wise count rates Data is divided into 100 sec bins |
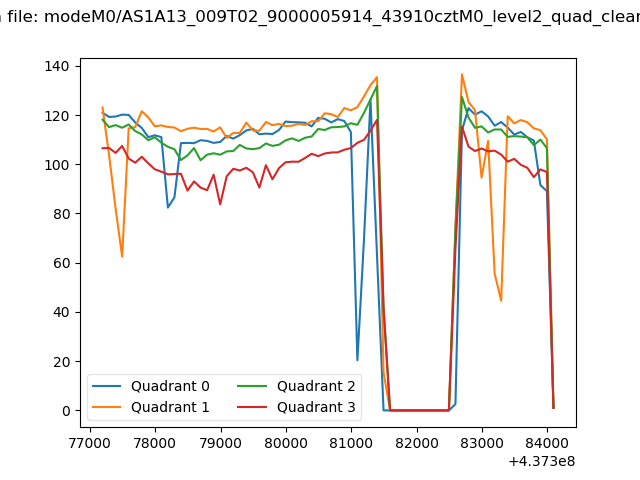 |
|
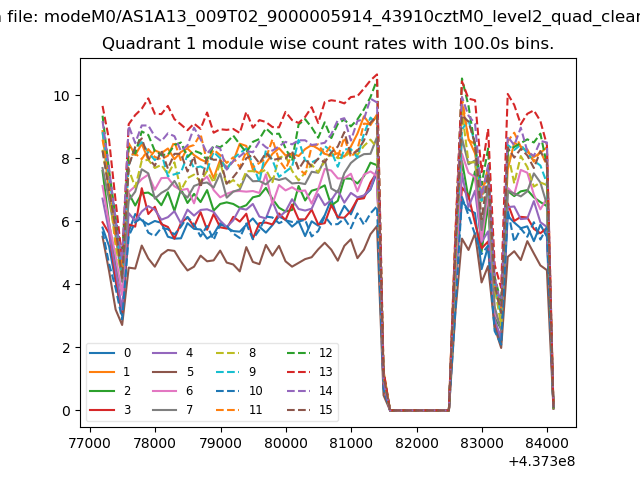
| Module-wise count rates for Quadrant A Data is divided into 100 sec bins |
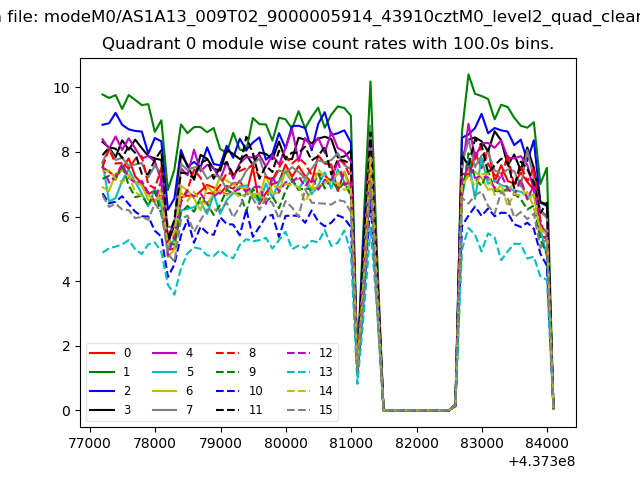 |
 |
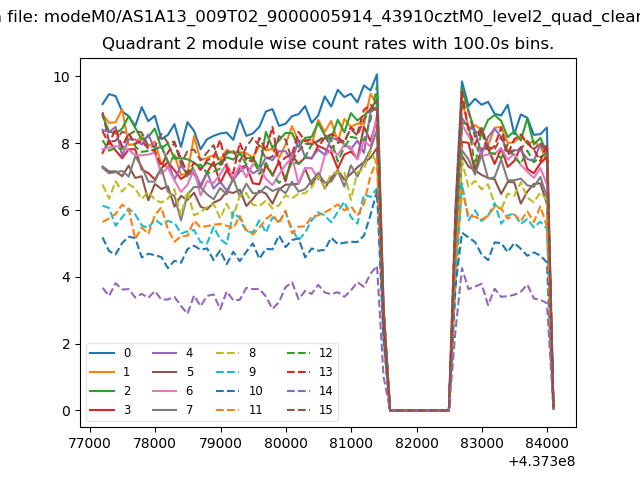
| Module-wise count rates for Quadrant B Data is divided into 100 sec bins |
 |
 |
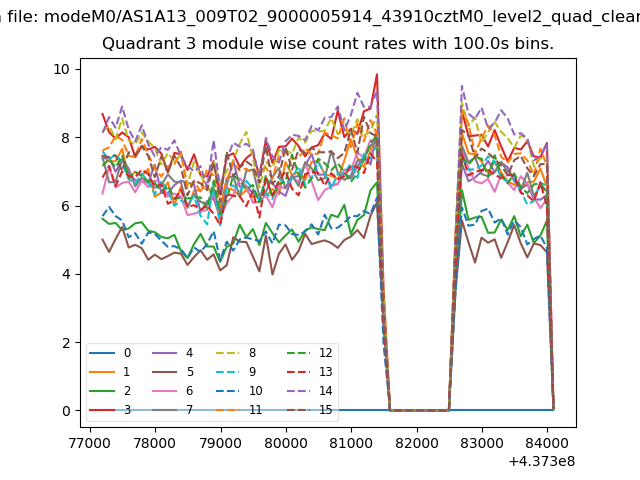
| Module-wise count rates for Quadrant C Data is divided into 100 sec bins |
 |
 |
| Module-wise count rates for Quadrant D Data is divided into 100 sec bins |
 |
 |
| Parameter | Plot |
|---|---|
| CZT HV Monitor | 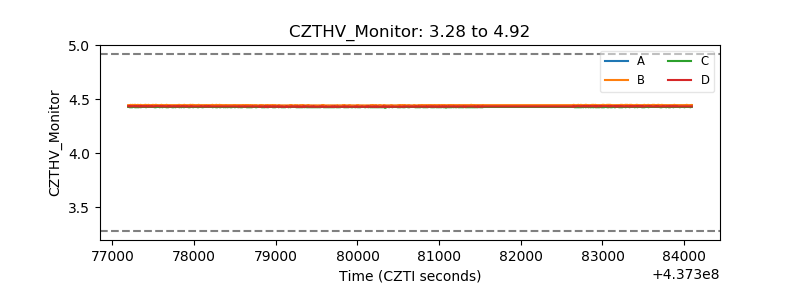 |
| D_VDD | 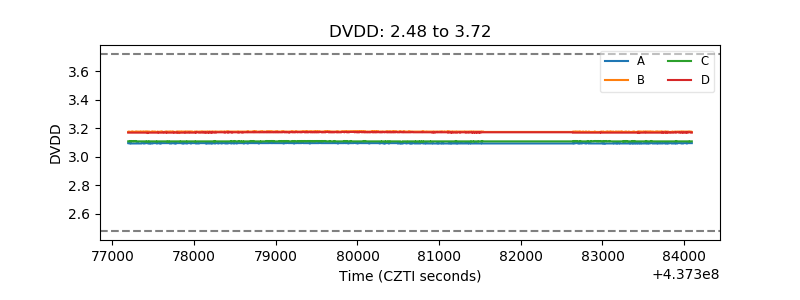 |
| Temperature 1 | 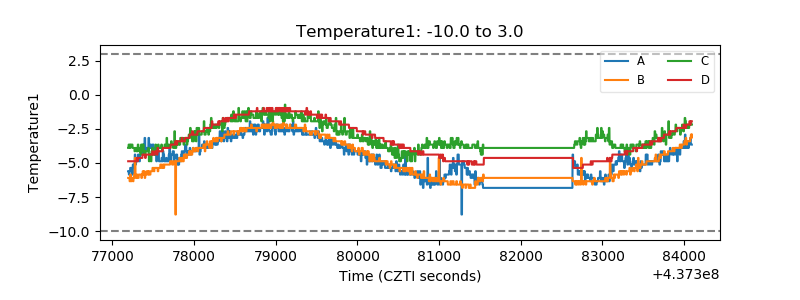 |
| Veto HV Monitor | 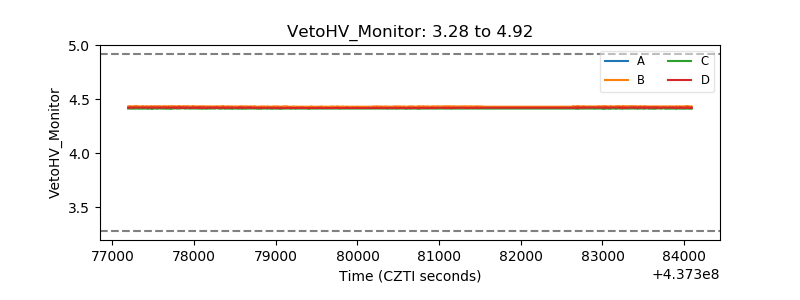 |
| Veto LLD | 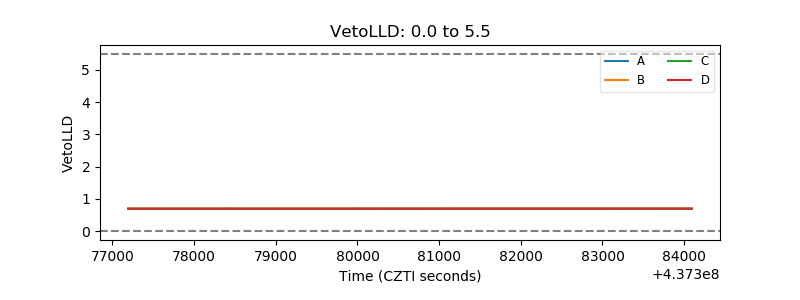 |
| Alpha Counter | 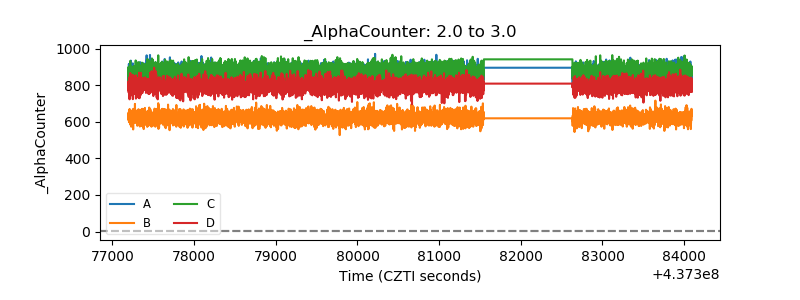 |
| _CPM_Rate | 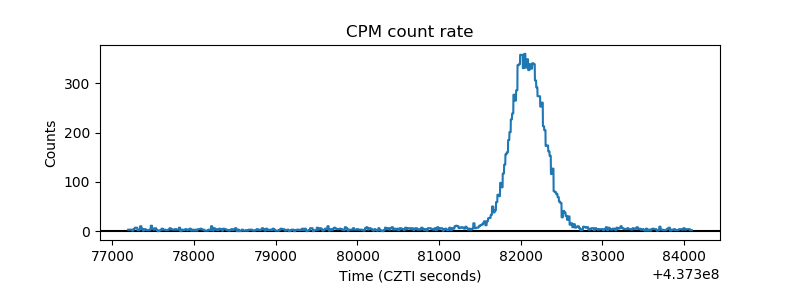 |
| CZT Counter | 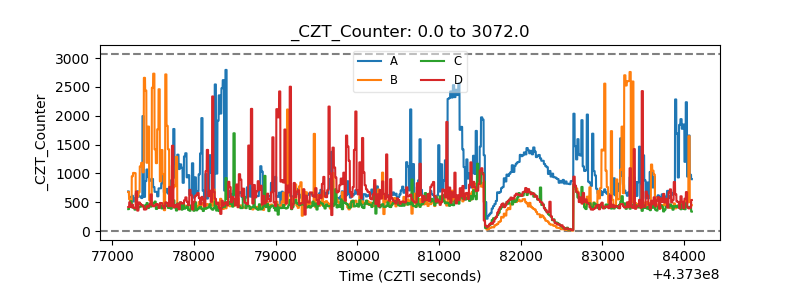 |
| +2.5 Volts monitor | 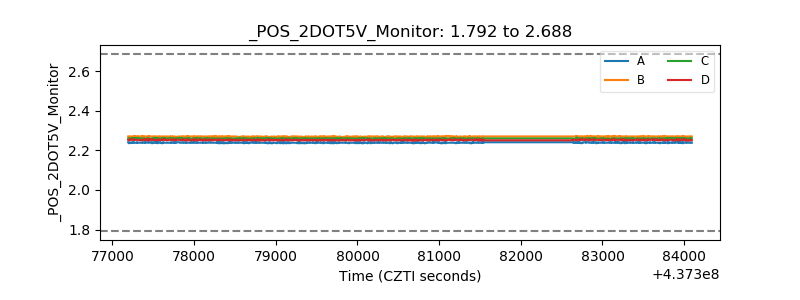 |
| +5 Volts monitor | 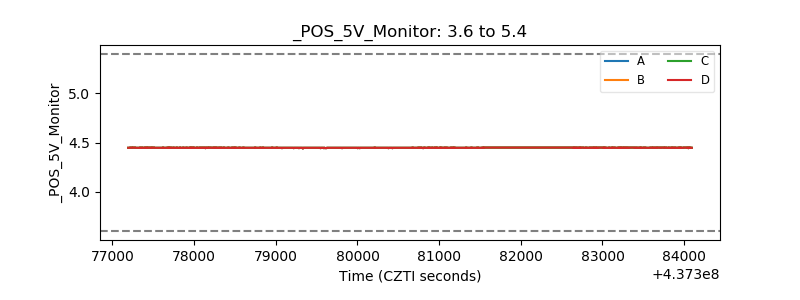 |
| _ROLL_ROT | 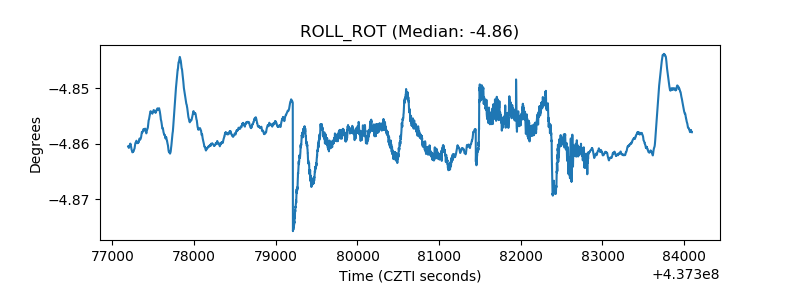 |
| _Roll_DEC | 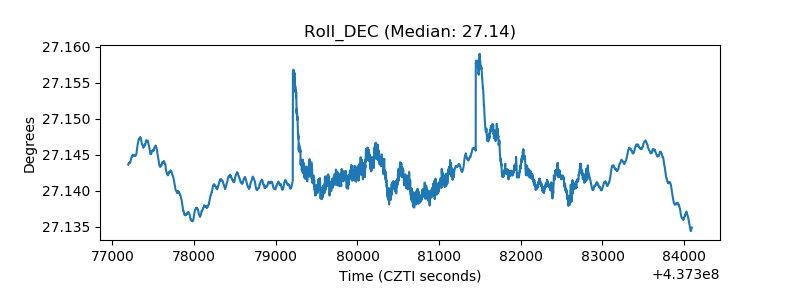 |
| _Roll_RA |  |
| Veto Counter | 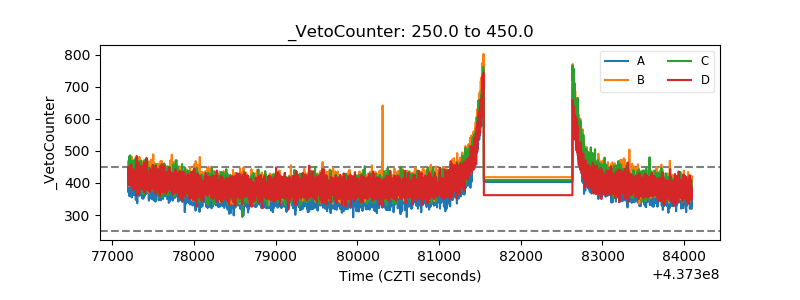 |