| Param | Original file | Final file |
|---|---|---|
| Filename | modeM0/AS1A13_009T02_9000005914_43911cztM0_level2.fits | modeM0/AS1A13_009T02_9000005914_43911cztM0_level2_quad_clean.evt |
| Size (bytes) | 500,175,360 | 98,804,160 |
| Size | 477.0 MB | 94.2 MB |
| Events in quadrant A | 6,177,442 | 632,775 |
| Events in quadrant B | 3,651,063 | 682,788 |
| Events in quadrant C | 2,953,552 | 669,342 |
| Events in quadrant D | 5,246,863 | 570,382 |
| Mode M9 | |||
|---|---|---|---|
| Quadrant | BADHDUFLAG | Total packets | Discarded packets |
| A | 0 | 8 | 0 |
| B | 0 | 8 | 0 |
| C | 0 | 8 | 0 |
| D | 0 | 8 | 0 |
| Mode SS | |||
|---|---|---|---|
| Quadrant | BADHDUFLAG | Total packets | Discarded packets |
| A | 0 | 126 | 0 |
| B | 0 | 126 | 0 |
| C | 0 | 126 | 0 |
| D | 0 | 126 | 0 |
| Mode M0 | |||
|---|---|---|---|
| Quadrant | BADHDUFLAG | Total packets | Discarded packets |
| A | 0 | 23064 | 1 |
| B | 0 | 14986 | 1 |
| C | 0 | 13114 | 1 |
| D | 0 | 19814 | 1 |
| Quadrant | Total seconds | Saturated seconds | Saturation percentage |
|---|---|---|---|
| A | 6255 | 773 | 12.358114% |
| B | 6256 | 339 | 5.418798% |
| C | 6256 | 103 | 1.646419% |
| D | 6256 | 639 | 10.214194% |
Noise dominated data is calculated using 1-second bins in cleaned event files. If a bin has >2000 counts, and if more than 50% of those come from <1% of pixels, then it is considered to be noise-dominated and hence unusable.
| Quadrant | # 1 sec bins | Bins with >0 counts | Bins with >2000 counts | High rate bins dominated by noise | Noise dominated (total time) | Noise dominated (detector-on time) | Marked lightcurve |
|---|---|---|---|---|---|---|---|
| A | 7075 | 6256 | 465 | 465 | 6.57% | 7.43% | 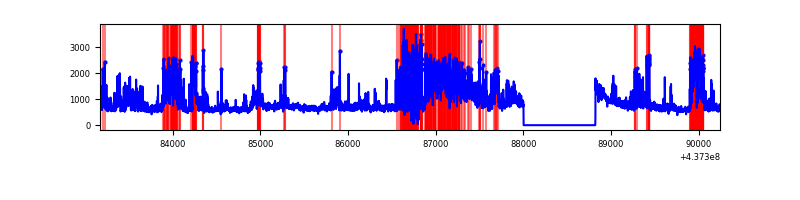 |
| B | 7076 | 6257 | 164 | 164 | 2.32% | 2.62% | 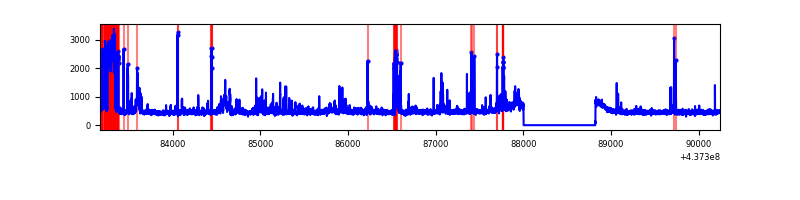 |
| C | 7076 | 6257 | 5 | 5 | 0.07% | 0.08% | 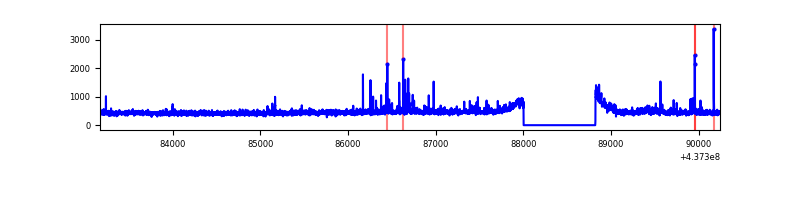 |
| D | 7076 | 6257 | 490 | 490 | 6.92% | 7.83% | 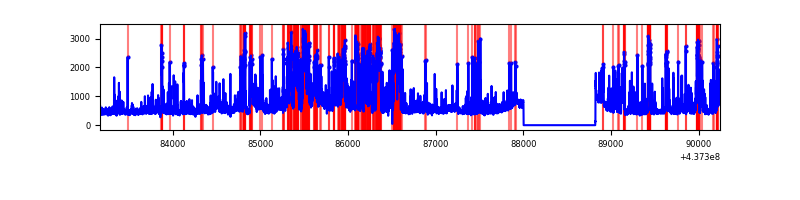 |
Top three noisy pixels from each quadrant. If the there are fewer than three noisy pixels in the level2.evt file, extra rows are filled as -1
| Pixel properties | Quadrant properties | ||||||
|---|---|---|---|---|---|---|---|
| Quadrant | DetID | PixID | Counts | Sigma | Mean | Median | Sigma |
| A | 15 | 223 | 1903590 | 13183.4 | 699 | 685 | 144.3 |
| A | 10 | 83 | 947199 | 6557.49 | 699 | 685 | 144.3 |
| A | 14 | 254 | 316222 | 2186.05 | 699 | 685 | 144.3 |
| B | 5 | 172 | 504396 | 3602.56 | 708 | 684 | 139.8 |
| B | 5 | 235 | 200852 | 1431.61 | 708 | 684 | 139.8 |
| B | 4 | 171 | 51521 | 363.59 | 708 | 684 | 139.8 |
| C | 3 | 233 | 86152 | 515.36 | 707 | 712 | 165.8 |
| C | 14 | 254 | 50718 | 301.63 | 707 | 712 | 165.8 |
| C | 1 | 241 | 14596 | 83.75 | 707 | 712 | 165.8 |
| D | 12 | 233 | 695443 | 4010.69 | 685 | 664 | 173.2 |
| D | 1 | 52 | 686996 | 3961.93 | 685 | 664 | 173.2 |
| D | 7 | 204 | 236583 | 1361.87 | 685 | 664 | 173.2 |
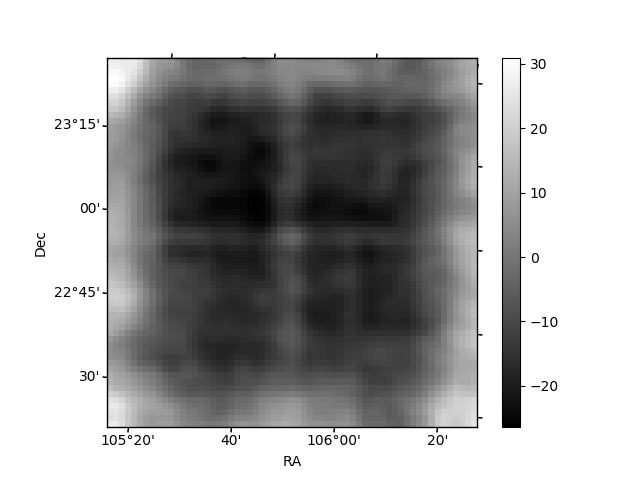
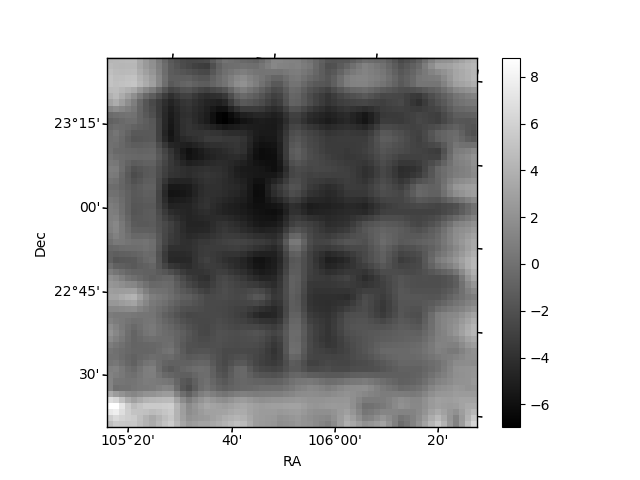
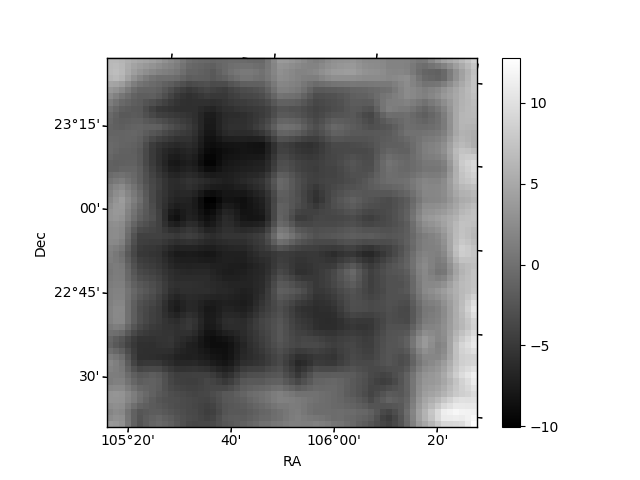
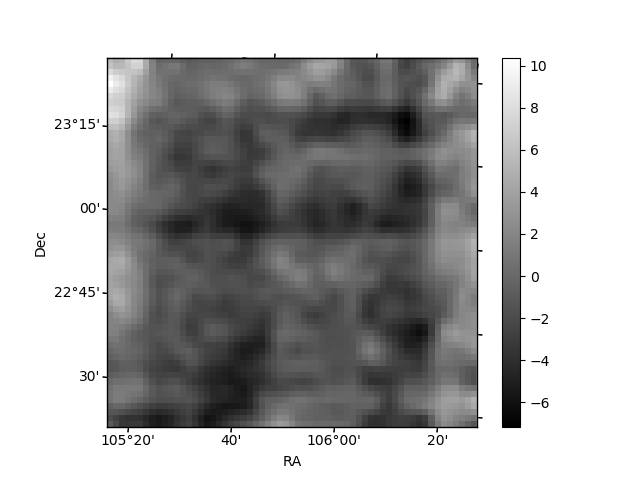
Histogram calculated using DETX and DETY for each event in the final _common_clean file
| Quadrant A | 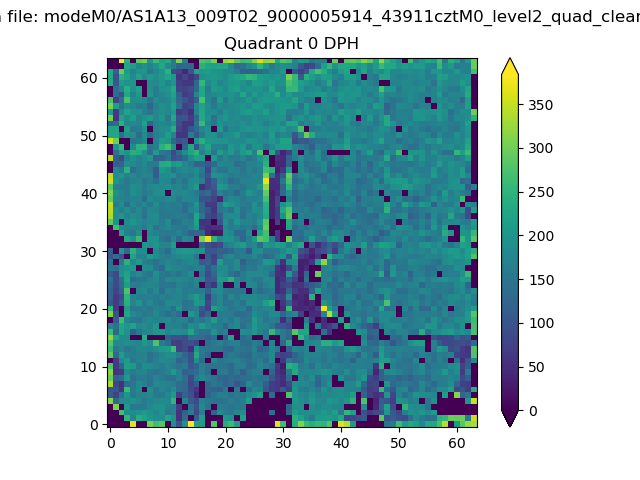 |
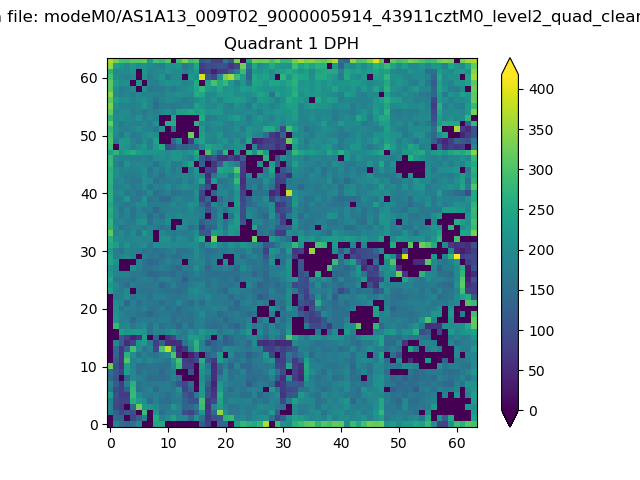 |
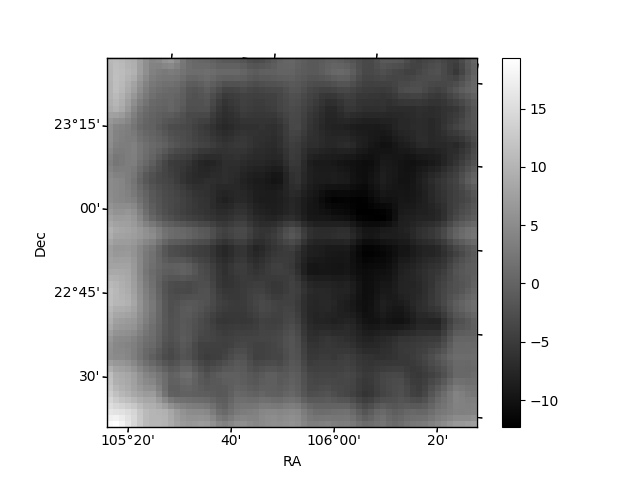
Quadrant B |
|---|---|---|---|
| Quadrant D | 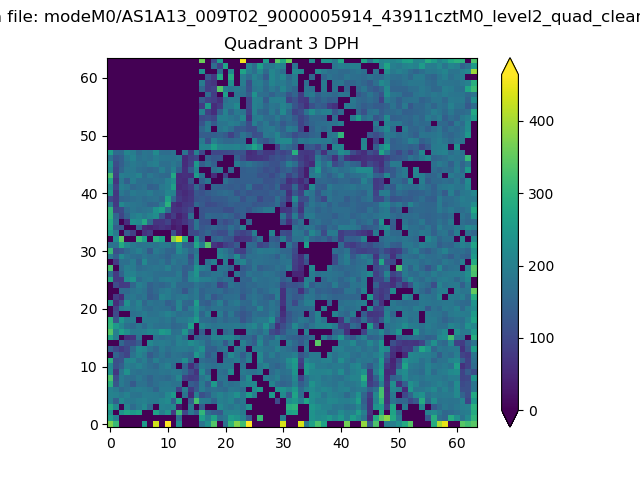 |
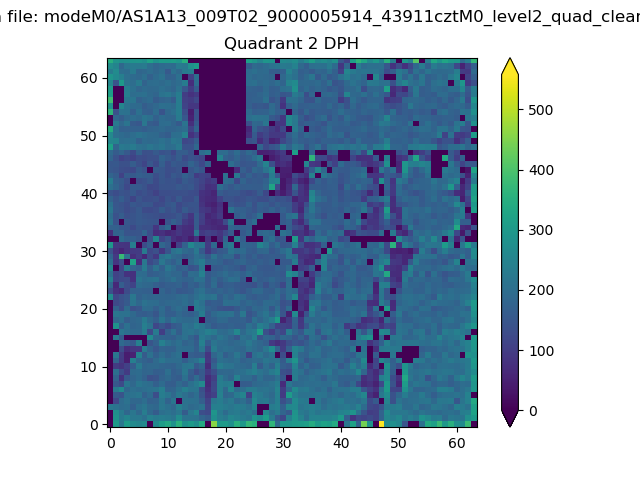 |
Quadrant C |
| Plot type | Count rate plots | Images |
|---|---|---|
| Comparison with Poisson distribution Blue bars denote a histogram of data divided into 1 sec bins. Red curve is a Poisson curve with rate = median count rate of data. |
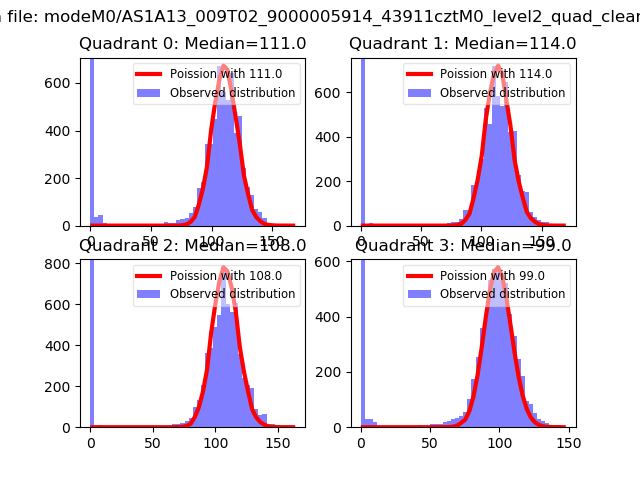 |
 |
| Quadrant-wise count rates Data is divided into 100 sec bins |
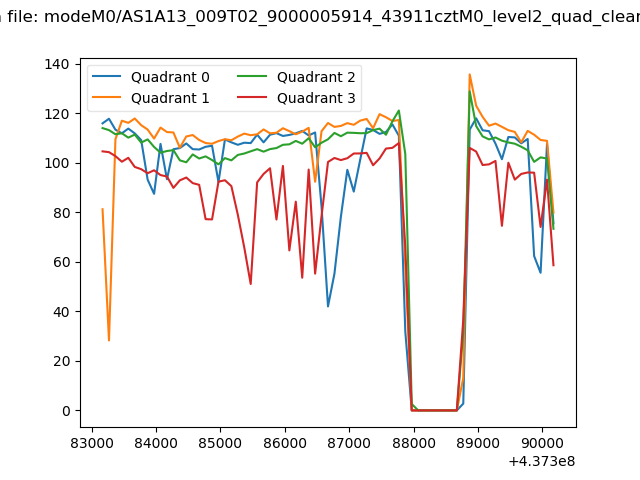 |
|
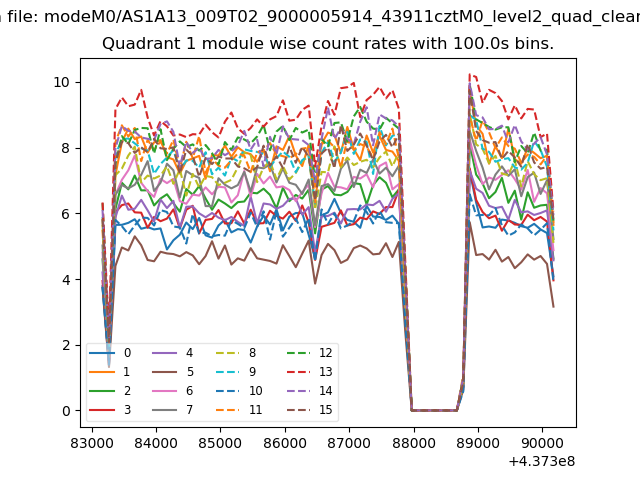
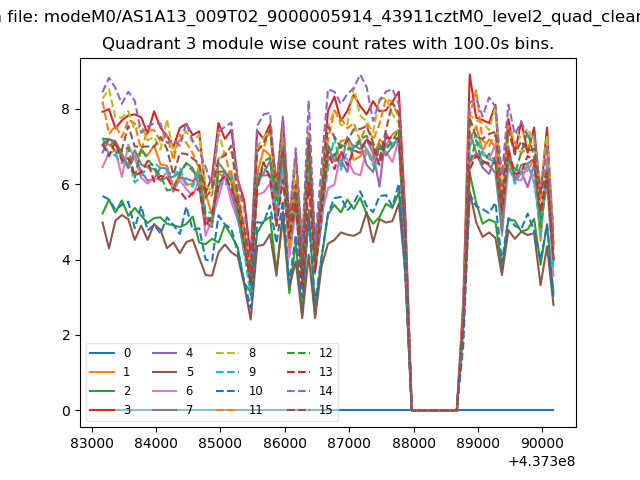
| Module-wise count rates for Quadrant A Data is divided into 100 sec bins |
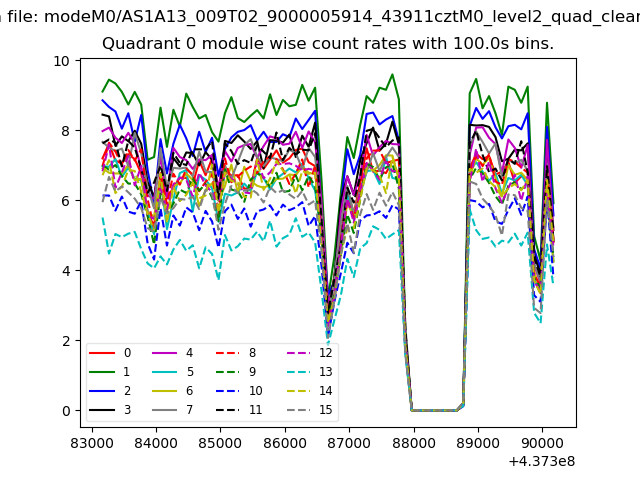 |
 |
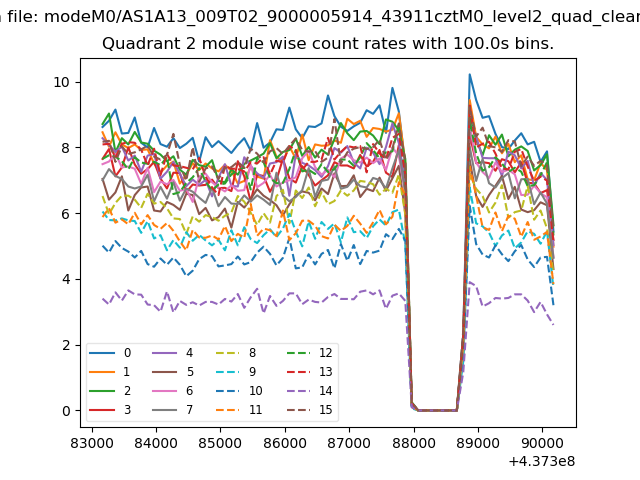
| Module-wise count rates for Quadrant B Data is divided into 100 sec bins |
 |
 |
| Module-wise count rates for Quadrant C Data is divided into 100 sec bins |
 |
 |
| Module-wise count rates for Quadrant D Data is divided into 100 sec bins |
 |
 |
| Parameter | Plot |
|---|---|
| CZT HV Monitor | 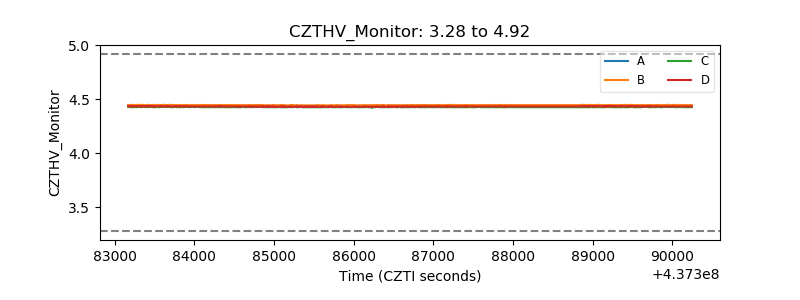 |
| D_VDD | 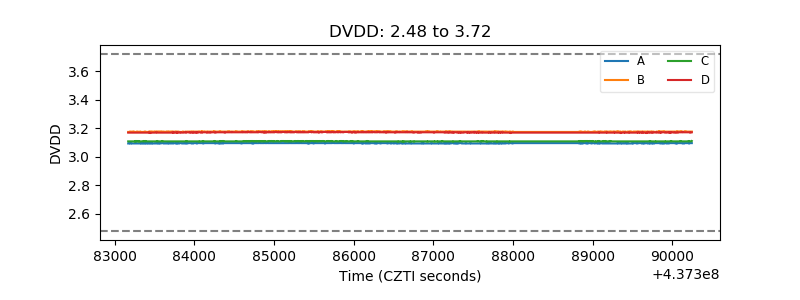 |
| Temperature 1 | 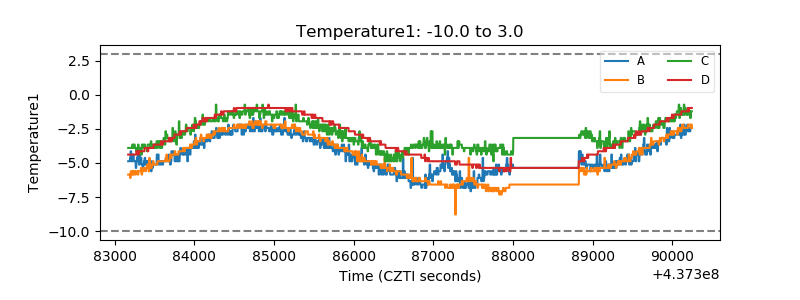 |
| Veto HV Monitor | 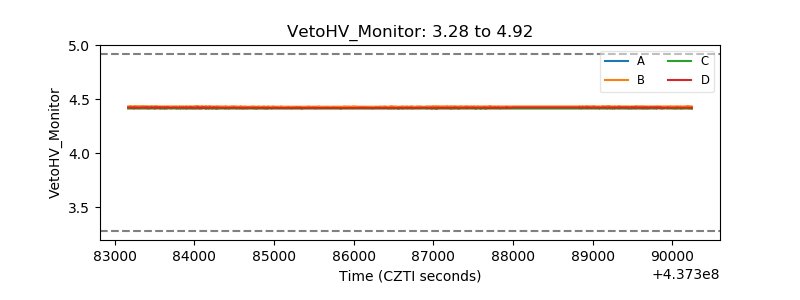 |
| Veto LLD | 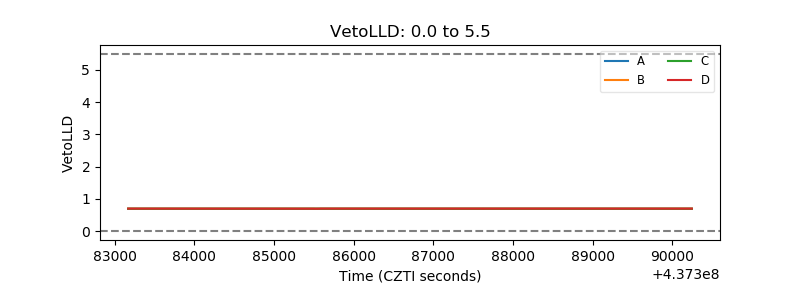 |
| Alpha Counter | 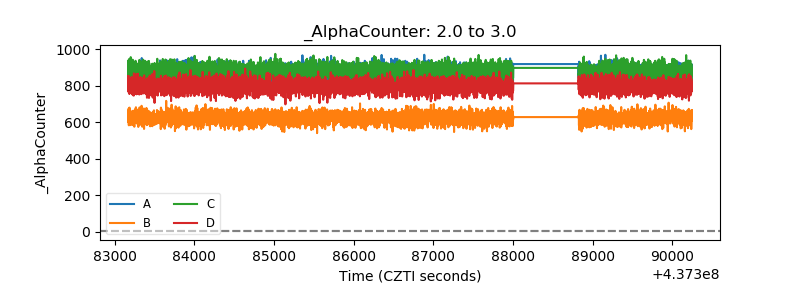 |
| _CPM_Rate | 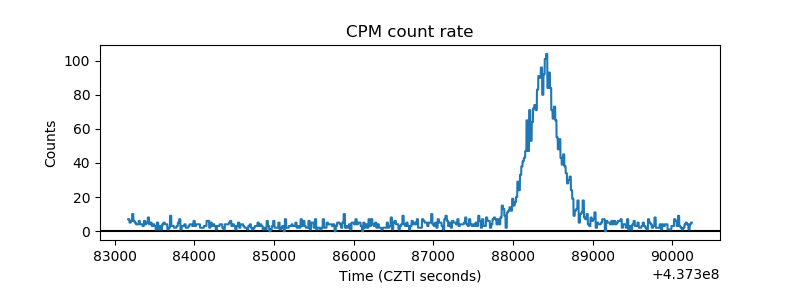 |
| CZT Counter | 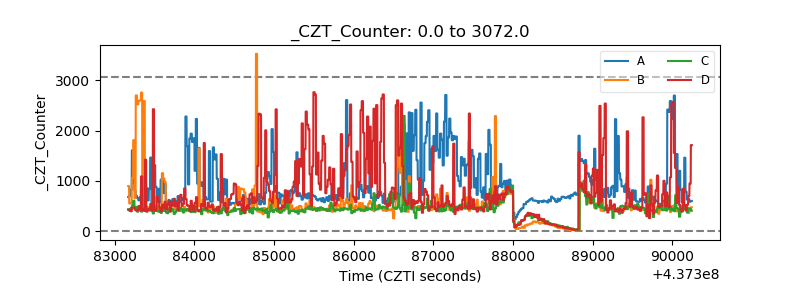 |
| +2.5 Volts monitor | 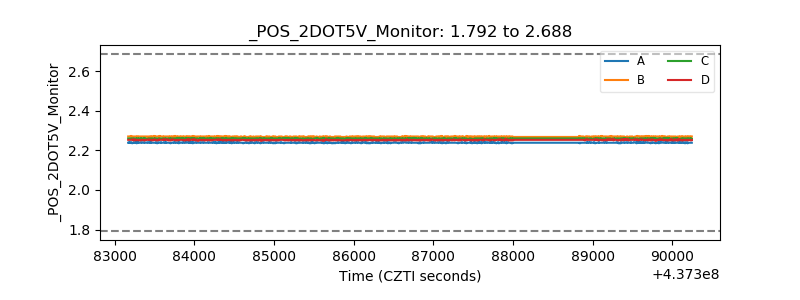 |
| +5 Volts monitor | 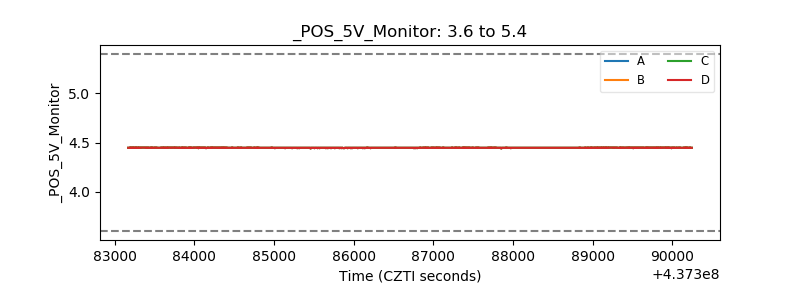 |
| _ROLL_ROT | 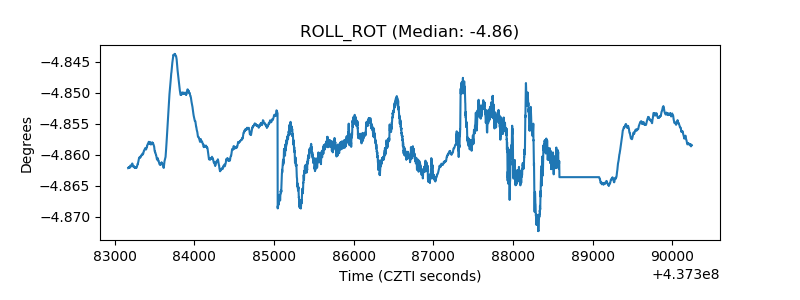 |
| _Roll_DEC | 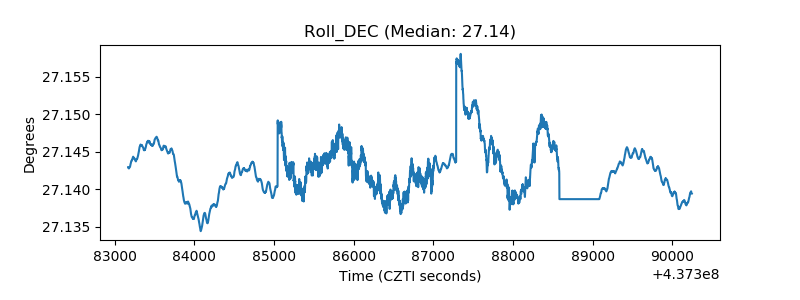 |
| _Roll_RA | 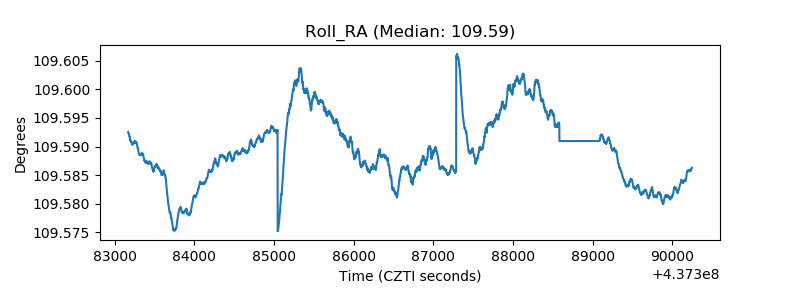 |
| Veto Counter | 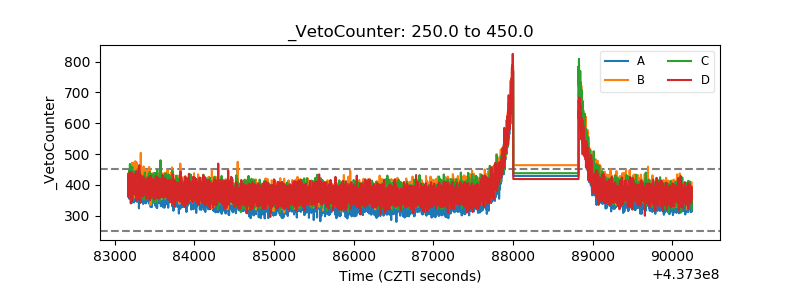 |