| Param | Original file | Final file |
|---|---|---|
| Filename | modeM0/AS1A13_009T02_9000005914_43912cztM0_level2.fits | modeM0/AS1A13_009T02_9000005914_43912cztM0_level2_quad_clean.evt |
| Size (bytes) | 566,913,600 | 112,469,760 |
| Size | 540.7 MB | 107.3 MB |
| Events in quadrant A | 6,092,298 | 732,969 |
| Events in quadrant B | 3,694,107 | 786,130 |
| Events in quadrant C | 3,748,259 | 747,277 |
| Events in quadrant D | 6,884,101 | 630,797 |
| Mode M9 | |||
|---|---|---|---|
| Quadrant | BADHDUFLAG | Total packets | Discarded packets |
| A | 0 | 3 | 0 |
| B | 0 | 3 | 0 |
| C | 0 | 3 | 0 |
| D | 0 | 3 | 0 |
| Mode SS | |||
|---|---|---|---|
| Quadrant | BADHDUFLAG | Total packets | Discarded packets |
| A | 0 | 148 | 0 |
| B | 0 | 148 | 0 |
| C | 0 | 148 | 0 |
| D | 0 | 148 | 0 |
| Mode M0 | |||
|---|---|---|---|
| Quadrant | BADHDUFLAG | Total packets | Discarded packets |
| A | 0 | 23688 | 1 |
| B | 0 | 15806 | 1 |
| C | 0 | 16032 | 1 |
| D | 0 | 25376 | 1 |
| Quadrant | Total seconds | Saturated seconds | Saturation percentage |
|---|---|---|---|
| A | 7297 | 715 | 9.798547% |
| B | 7297 | 291 | 3.987940% |
| C | 7298 | 259 | 3.548918% |
| D | 7298 | 999 | 13.688682% |
Noise dominated data is calculated using 1-second bins in cleaned event files. If a bin has >2000 counts, and if more than 50% of those come from <1% of pixels, then it is considered to be noise-dominated and hence unusable.
| Quadrant | # 1 sec bins | Bins with >0 counts | Bins with >2000 counts | High rate bins dominated by noise | Noise dominated (total time) | Noise dominated (detector-on time) | Marked lightcurve |
|---|---|---|---|---|---|---|---|
| A | 7587 | 7298 | 332 | 332 | 4.38% | 4.55% | 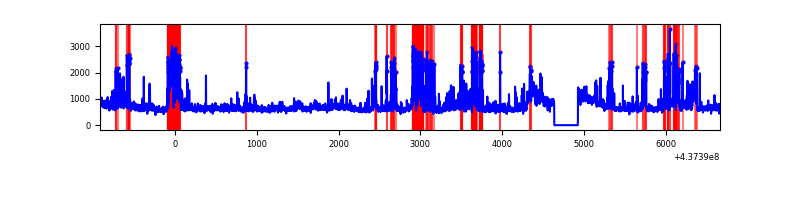 |
| B | 7587 | 7298 | 9 | 9 | 0.12% | 0.12% | 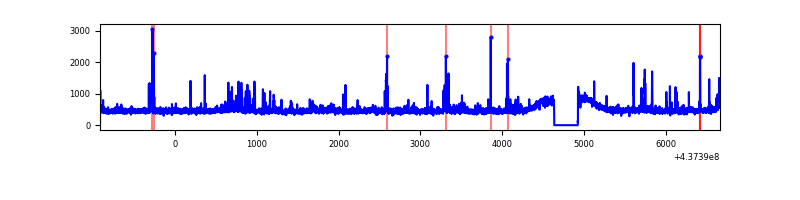 |
| C | 7588 | 7299 | 24 | 24 | 0.32% | 0.33% | 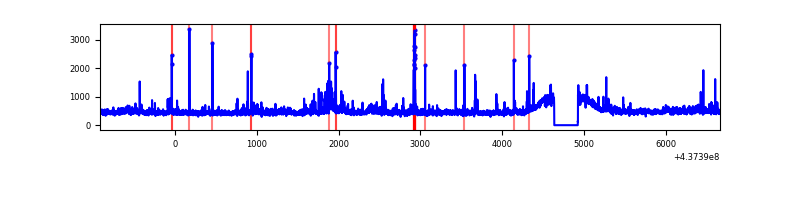 |
| D | 7588 | 7299 | 743 | 743 | 9.79% | 10.18% | 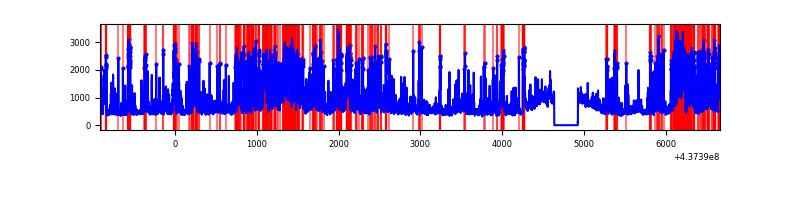 |
Top three noisy pixels from each quadrant. If the there are fewer than three noisy pixels in the level2.evt file, extra rows are filled as -1
| Pixel properties | Quadrant properties | ||||||
|---|---|---|---|---|---|---|---|
| Quadrant | DetID | PixID | Counts | Sigma | Mean | Median | Sigma |
| A | 15 | 223 | 1493384 | 8550.04 | 838 | 821 | 174.6 |
| A | 10 | 83 | 1085505 | 6213.54 | 838 | 821 | 174.6 |
| A | 7 | 191 | 122269 | 695.71 | 838 | 821 | 174.6 |
| B | 5 | 172 | 71911 | 418.82 | 845 | 819 | 169.7 |
| B | 15 | 36 | 61936 | 360.05 | 845 | 819 | 169.7 |
| B | 5 | 235 | 52478 | 304.33 | 845 | 819 | 169.7 |
| C | 3 | 233 | 222224 | 1119.8 | 833 | 835 | 197.7 |
| C | 14 | 254 | 161002 | 810.13 | 833 | 835 | 197.7 |
| C | 12 | 249 | 25786 | 126.2 | 833 | 835 | 197.7 |
| D | 7 | 80 | 1305210 | 6269.73 | 809 | 783 | 208.1 |
| D | 12 | 233 | 681179 | 3270.32 | 809 | 783 | 208.1 |
| D | 1 | 52 | 421611 | 2022.71 | 809 | 783 | 208.1 |
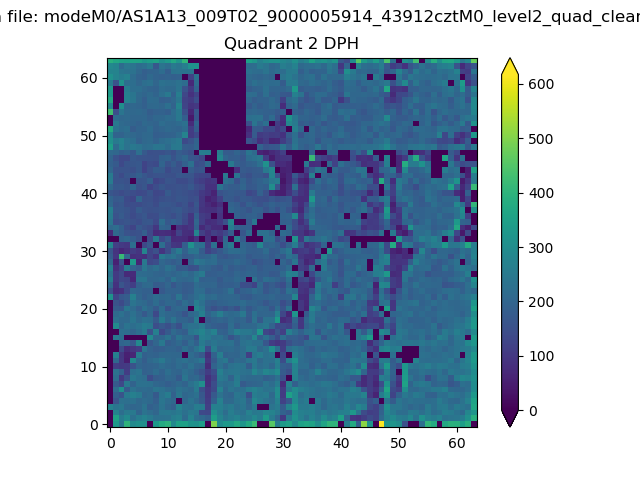
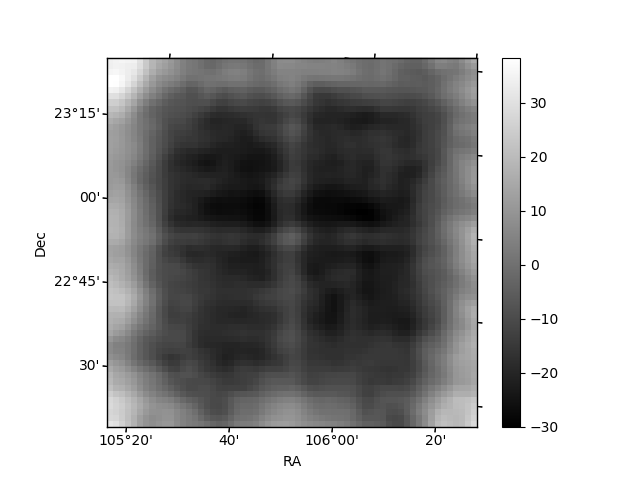
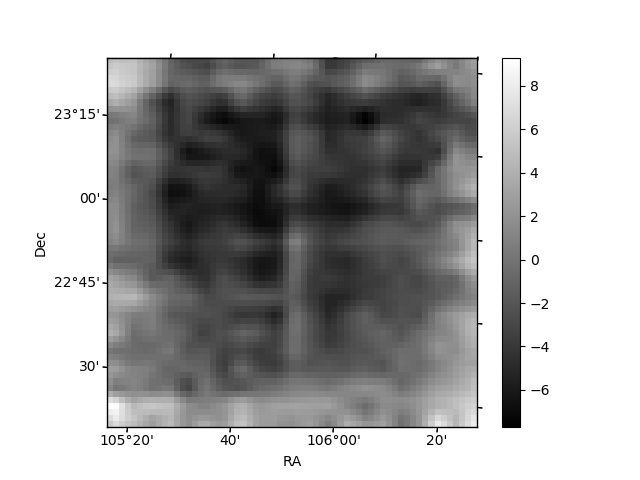
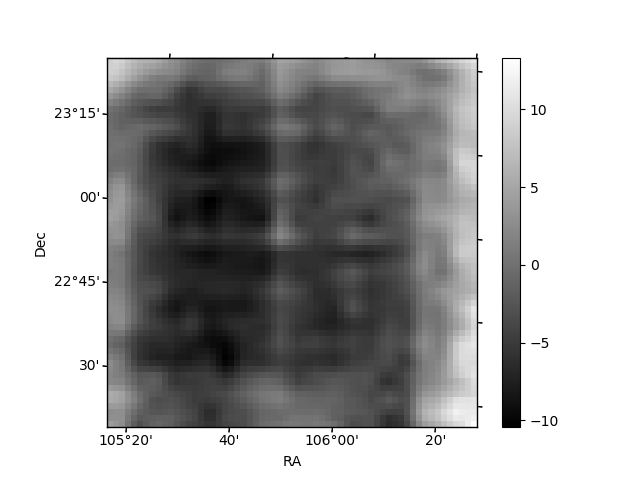
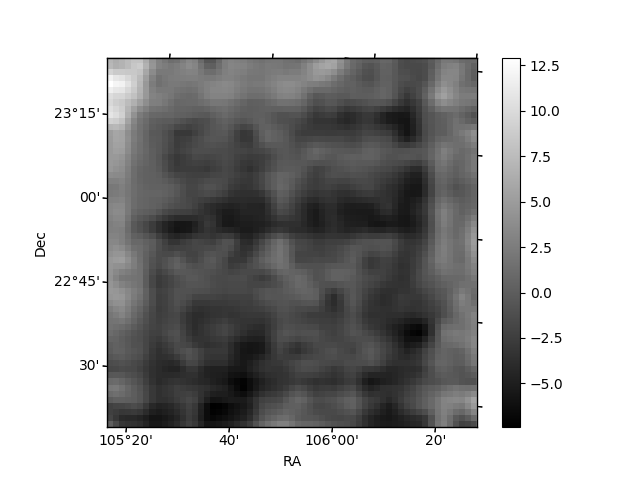
Histogram calculated using DETX and DETY for each event in the final _common_clean file
| Quadrant A | 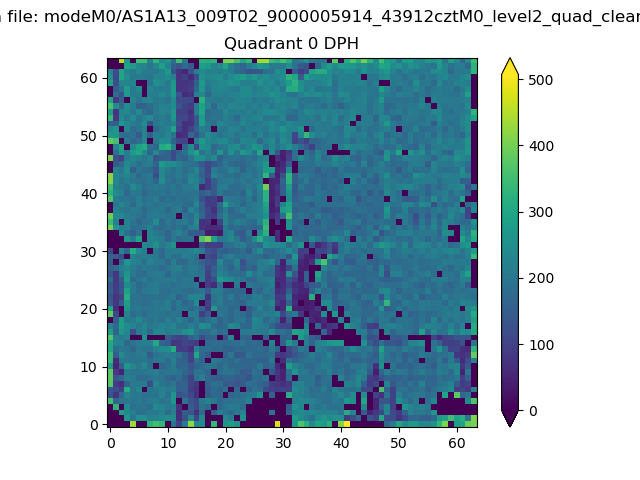 |
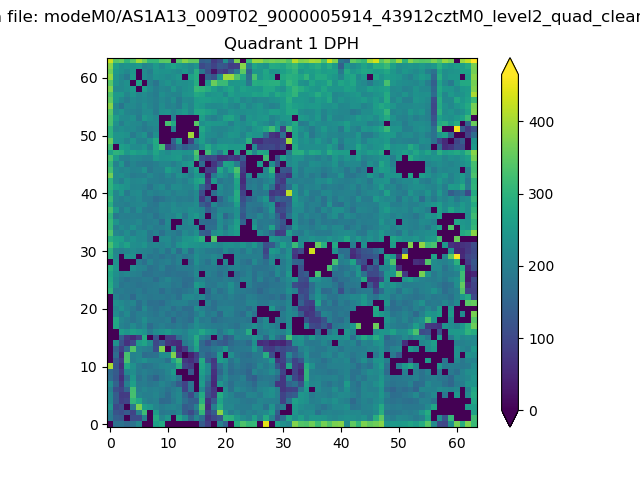 |
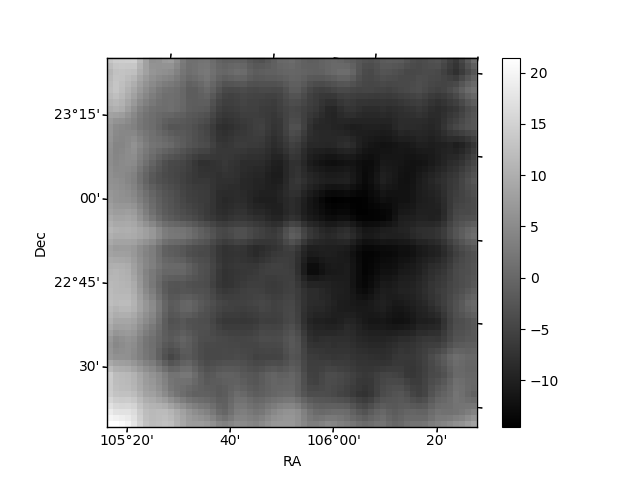
Quadrant B |
|---|---|---|---|
| Quadrant D | 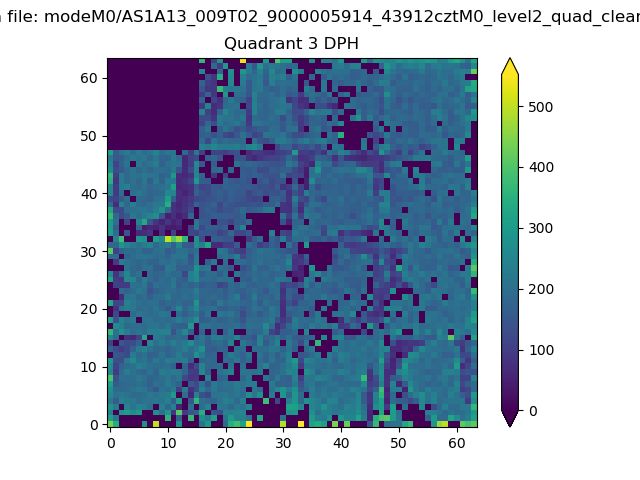 |
 |
Quadrant C |
| Plot type | Count rate plots | Images |
|---|---|---|
| Comparison with Poisson distribution Blue bars denote a histogram of data divided into 1 sec bins. Red curve is a Poisson curve with rate = median count rate of data. |
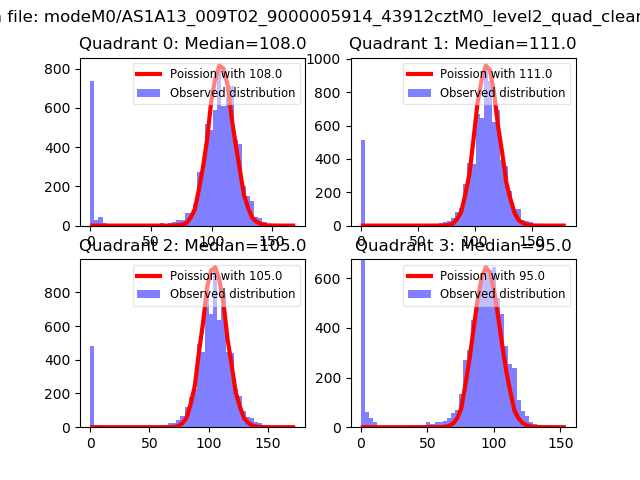 |
 |
| Quadrant-wise count rates Data is divided into 100 sec bins |
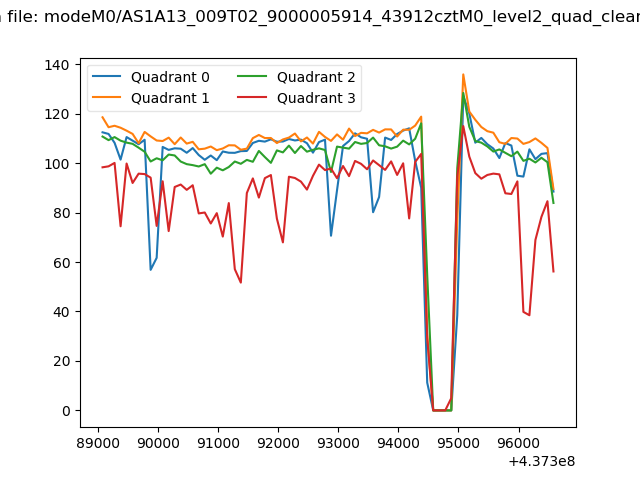 |
|
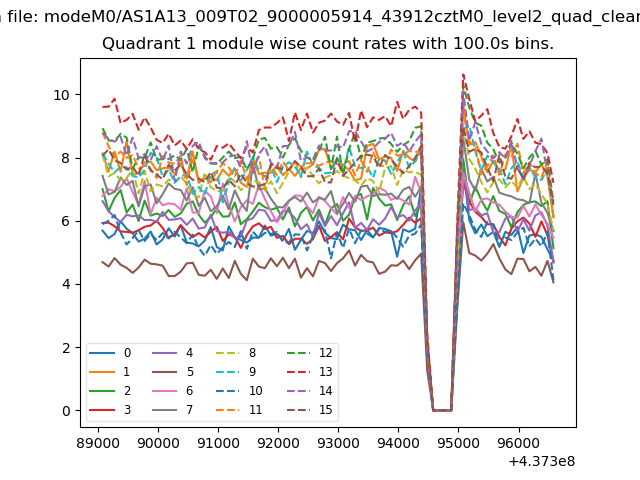
| Module-wise count rates for Quadrant A Data is divided into 100 sec bins |
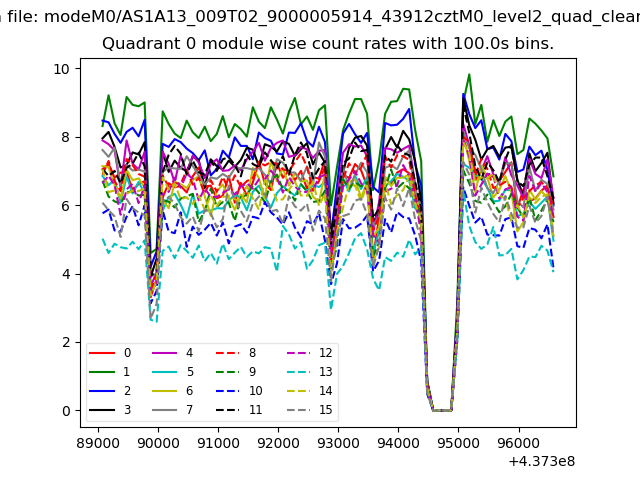 |
 |
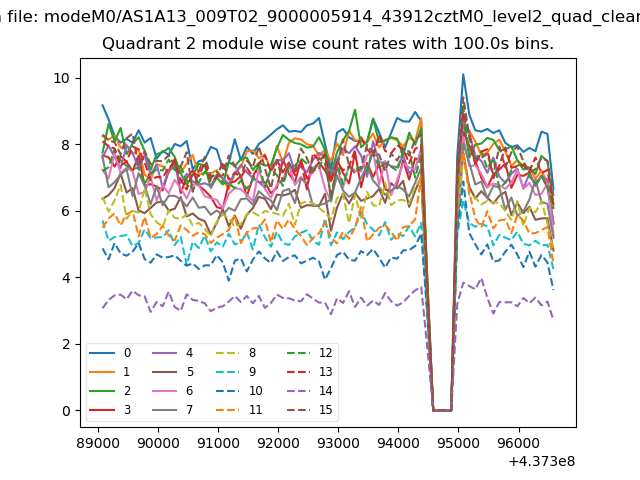
| Module-wise count rates for Quadrant B Data is divided into 100 sec bins |
 |
 |
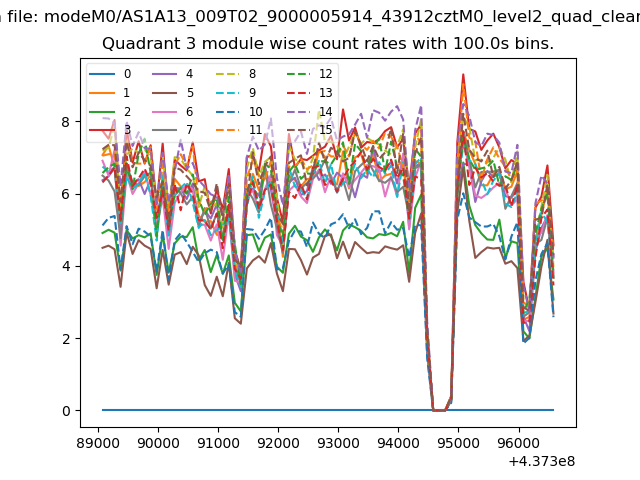
| Module-wise count rates for Quadrant C Data is divided into 100 sec bins |
 |
 |
| Module-wise count rates for Quadrant D Data is divided into 100 sec bins |
 |
 |
| Parameter | Plot |
|---|---|
| CZT HV Monitor | 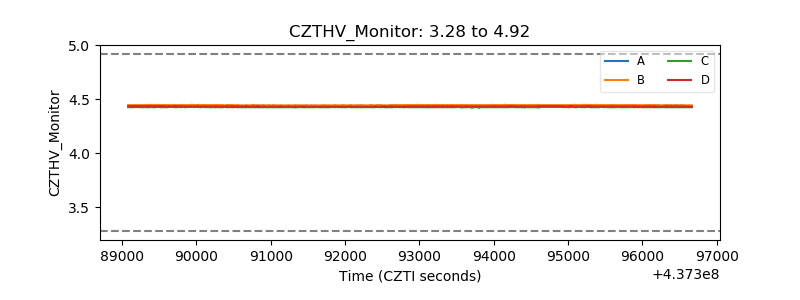 |
| D_VDD | 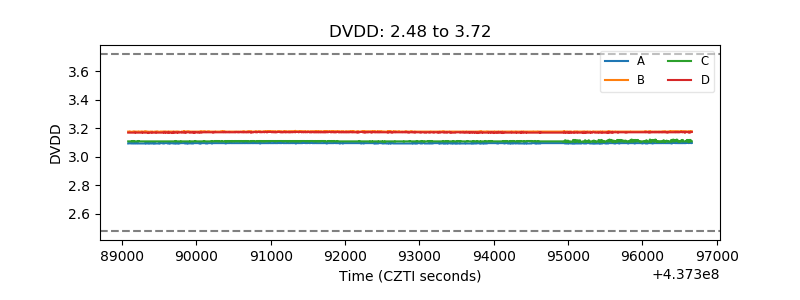 |
| Temperature 1 | 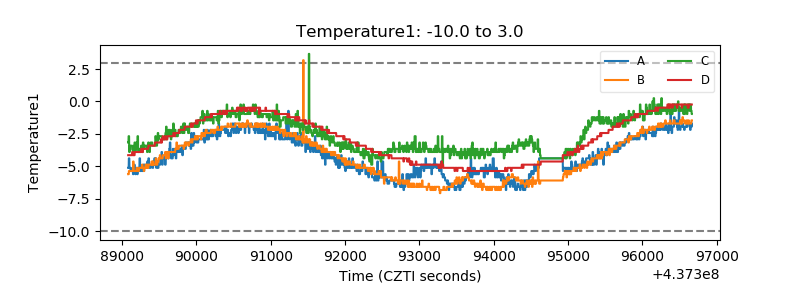 |
| Veto HV Monitor | 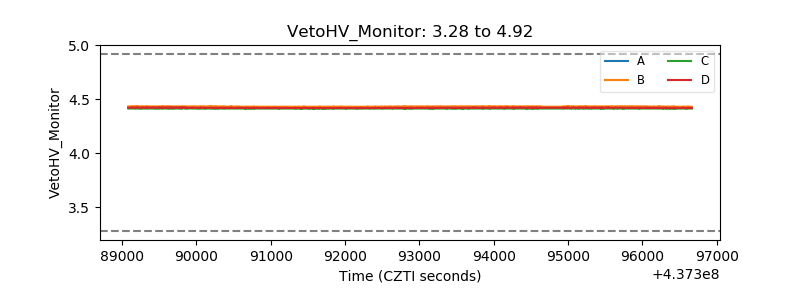 |
| Veto LLD | 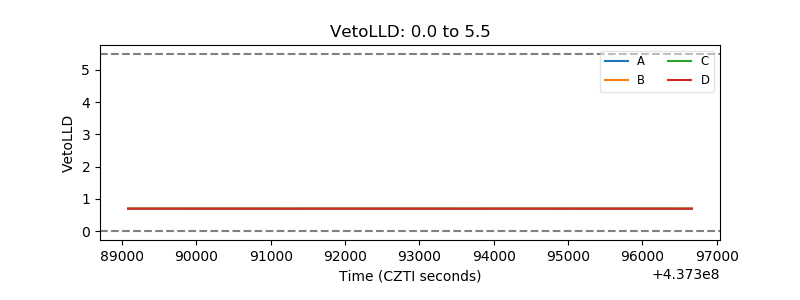 |
| Alpha Counter | 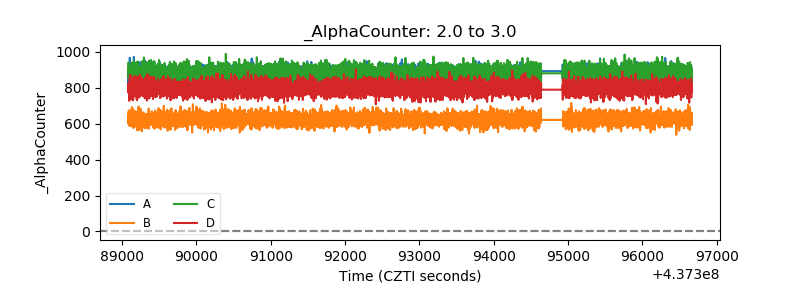 |
| _CPM_Rate | 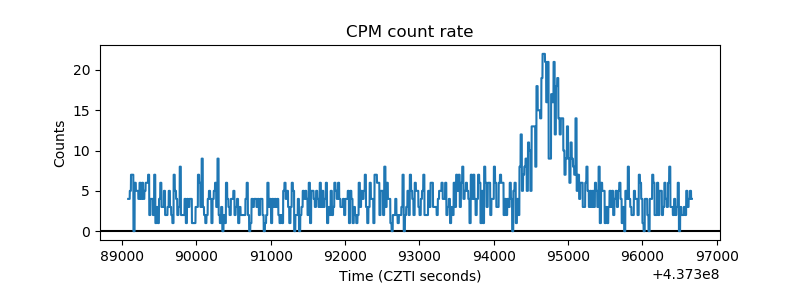 |
| CZT Counter | 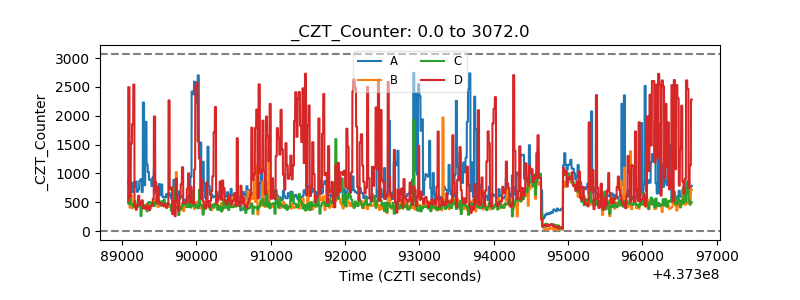 |
| +2.5 Volts monitor | 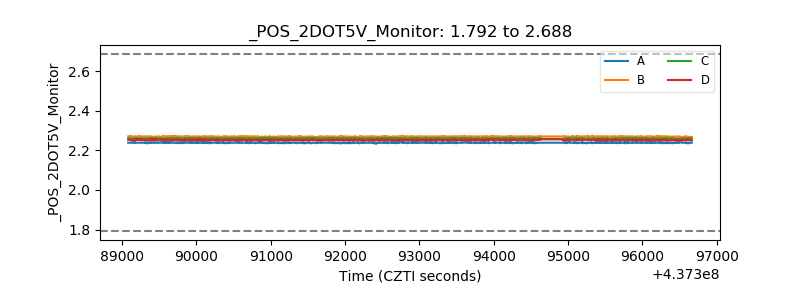 |
| +5 Volts monitor | 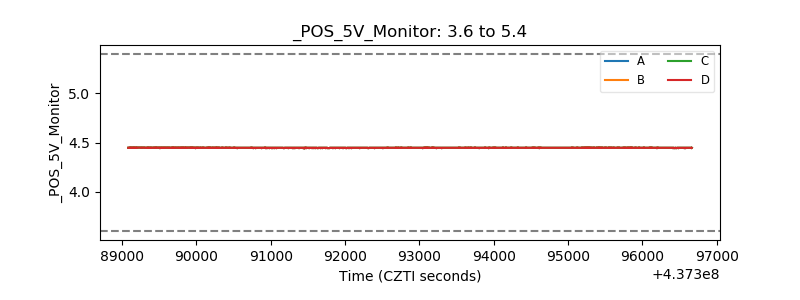 |
| _ROLL_ROT | 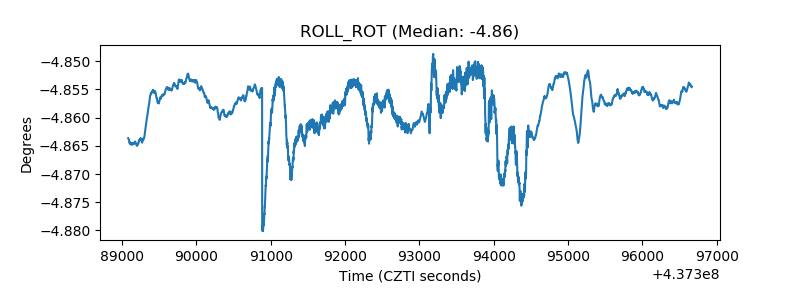 |
| _Roll_DEC | 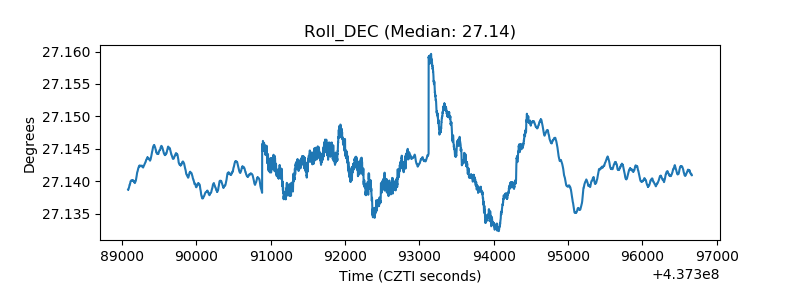 |
| _Roll_RA | 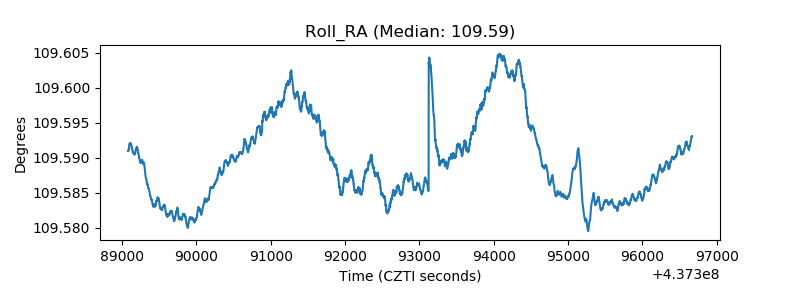 |
| Veto Counter | 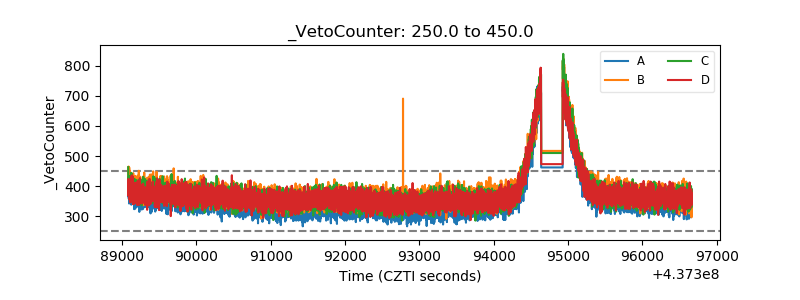 |