| Param | Original file | Final file |
|---|---|---|
| Filename | modeM0/AS1A13_009T02_9000005914_43913cztM0_level2.fits | modeM0/AS1A13_009T02_9000005914_43913cztM0_level2_quad_clean.evt |
| Size (bytes) | 659,257,920 | 127,929,600 |
| Size | 628.7 MB | 122.0 MB |
| Events in quadrant A | 7,165,908 | 840,311 |
| Events in quadrant B | 4,366,630 | 903,423 |
| Events in quadrant C | 4,201,246 | 857,346 |
| Events in quadrant D | 8,032,741 | 701,228 |
| Mode SS | |||
|---|---|---|---|
| Quadrant | BADHDUFLAG | Total packets | Discarded packets |
| A | 0 | 164 | 0 |
| B | 0 | 164 | 0 |
| C | 0 | 164 | 0 |
| D | 0 | 164 | 0 |
| Mode M0 | |||
|---|---|---|---|
| Quadrant | BADHDUFLAG | Total packets | Discarded packets |
| A | 0 | 27634 | 1 |
| B | 0 | 18425 | 1 |
| C | 0 | 18143 | 1 |
| D | 0 | 29598 | 1 |
| Quadrant | Total seconds | Saturated seconds | Saturation percentage |
|---|---|---|---|
| A | 8217 | 704 | 8.567604% |
| B | 8217 | 217 | 2.640866% |
| C | 8218 | 137 | 1.667072% |
| D | 8218 | 1201 | 14.614261% |
Noise dominated data is calculated using 1-second bins in cleaned event files. If a bin has >2000 counts, and if more than 50% of those come from <1% of pixels, then it is considered to be noise-dominated and hence unusable.
| Quadrant | # 1 sec bins | Bins with >0 counts | Bins with >2000 counts | High rate bins dominated by noise | Noise dominated (total time) | Noise dominated (detector-on time) | Marked lightcurve |
|---|---|---|---|---|---|---|---|
| A | 8217 | 8217 | 395 | 395 | 4.81% | 4.81% | 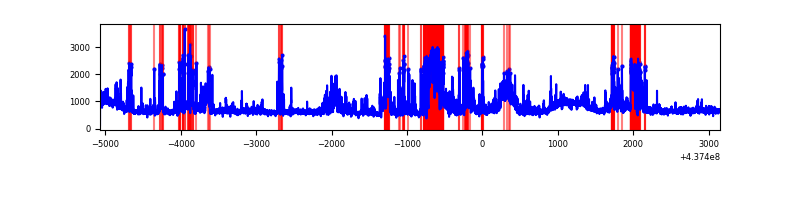 |
| B | 8217 | 8217 | 24 | 24 | 0.29% | 0.29% | 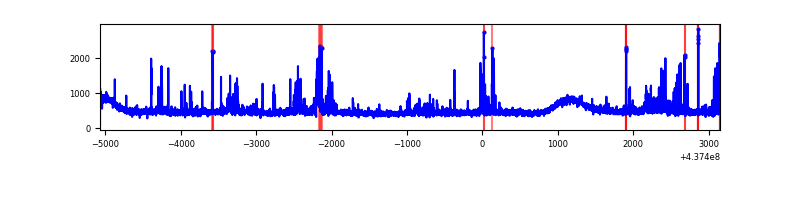 |
| C | 8218 | 8218 | 11 | 11 | 0.13% | 0.13% | 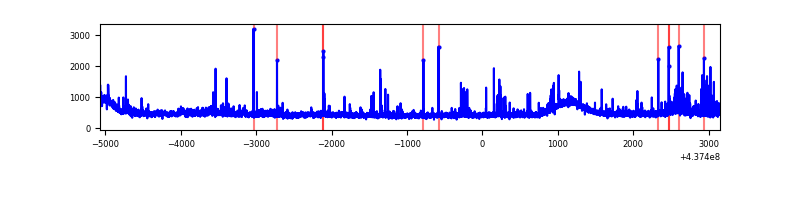 |
| D | 8218 | 8218 | 955 | 955 | 11.62% | 11.62% | 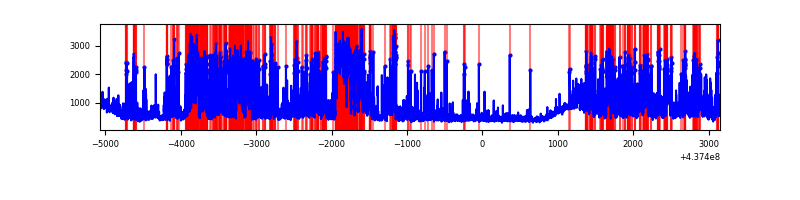 |
Top three noisy pixels from each quadrant. If the there are fewer than three noisy pixels in the level2.evt file, extra rows are filled as -1
| Pixel properties | Quadrant properties | ||||||
|---|---|---|---|---|---|---|---|
| Quadrant | DetID | PixID | Counts | Sigma | Mean | Median | Sigma |
| A | 15 | 223 | 1864960 | 9220.25 | 957 | 936 | 202.2 |
| A | 10 | 83 | 1227413 | 6066.67 | 957 | 936 | 202.2 |
| A | 15 | 222 | 243424 | 1199.45 | 957 | 936 | 202.2 |
| B | 5 | 235 | 172017 | 878.47 | 966 | 936 | 194.7 |
| B | 15 | 36 | 107700 | 548.21 | 966 | 936 | 194.7 |
| B | 5 | 172 | 68445 | 346.65 | 966 | 936 | 194.7 |
| C | 3 | 233 | 254559 | 1122.27 | 951 | 954 | 226.0 |
| C | 15 | 158 | 108464 | 475.76 | 951 | 954 | 226.0 |
| C | 15 | 157 | 55843 | 242.9 | 951 | 954 | 226.0 |
| D | 7 | 80 | 1231389 | 5259.67 | 910 | 877 | 234.0 |
| D | 1 | 52 | 938376 | 4007.22 | 910 | 877 | 234.0 |
| D | 5 | 235 | 616551 | 2631.62 | 910 | 877 | 234.0 |
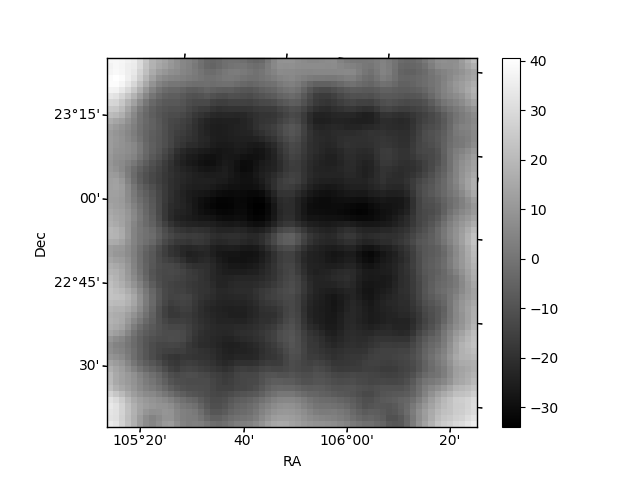
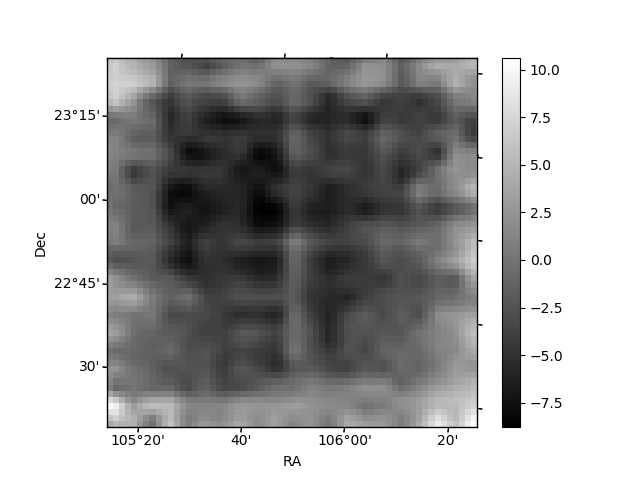
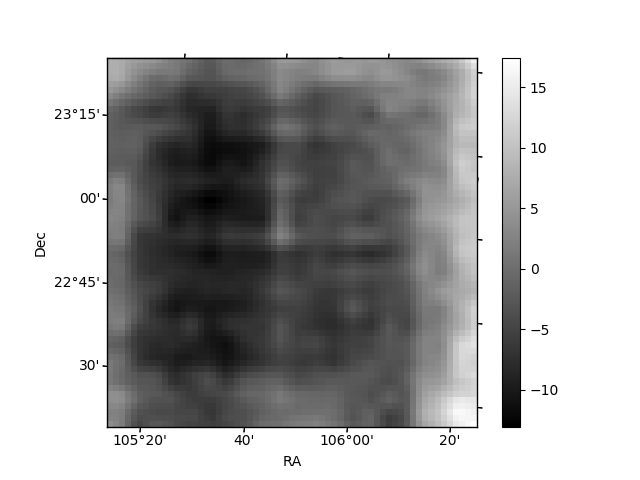
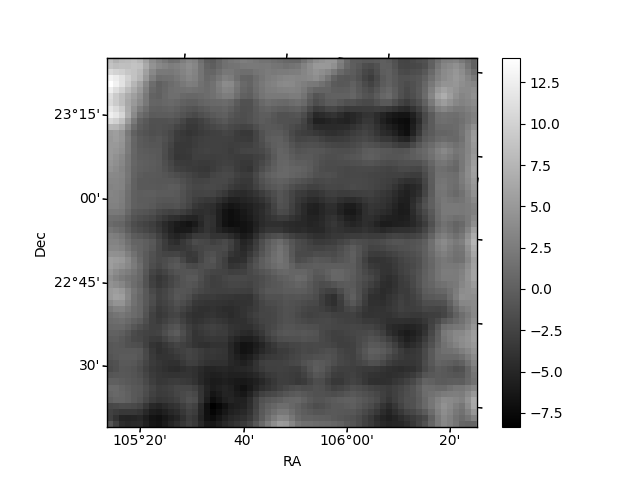
Histogram calculated using DETX and DETY for each event in the final _common_clean file
| Quadrant A | 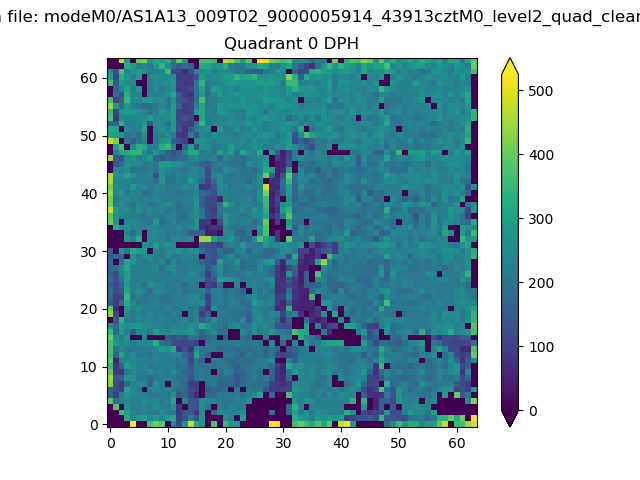 |
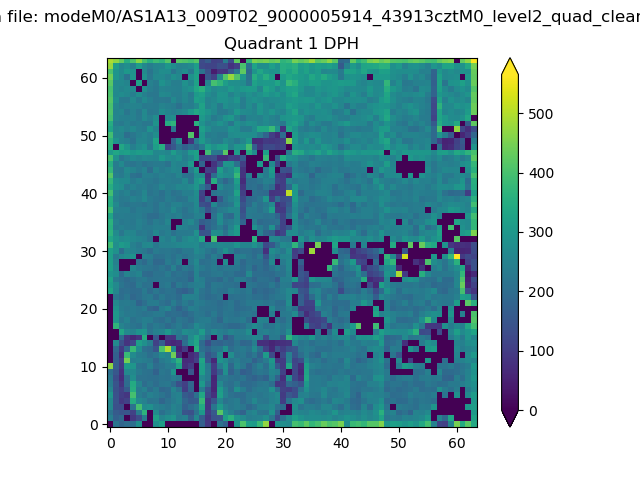 |
Quadrant B |
|---|---|---|---|
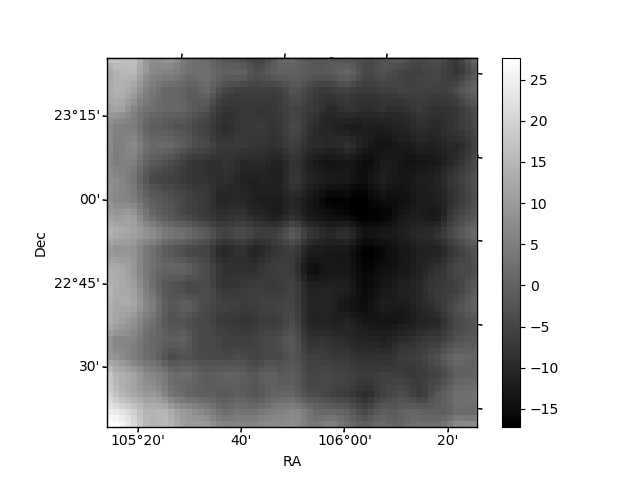
| Quadrant D | 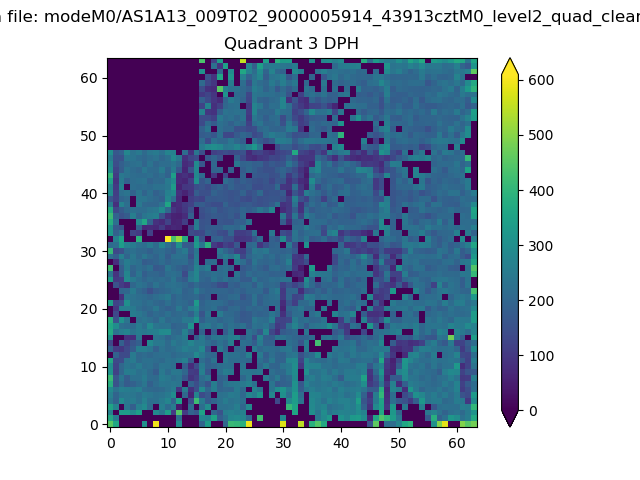 |
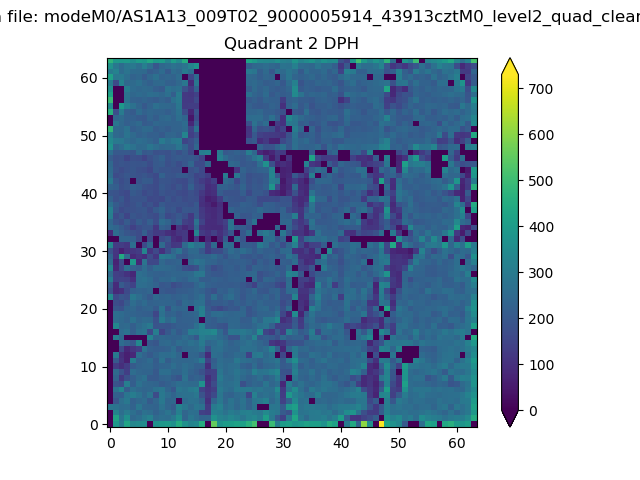 |
Quadrant C |
| Plot type | Count rate plots | Images |
|---|---|---|
| Comparison with Poisson distribution Blue bars denote a histogram of data divided into 1 sec bins. Red curve is a Poisson curve with rate = median count rate of data. |
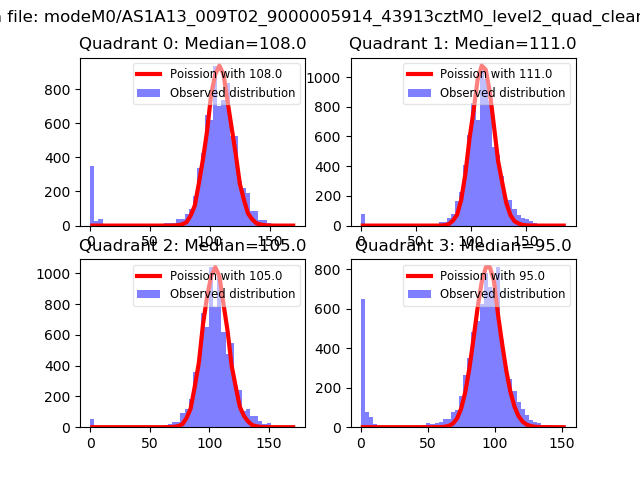 |
 |
| Quadrant-wise count rates Data is divided into 100 sec bins |
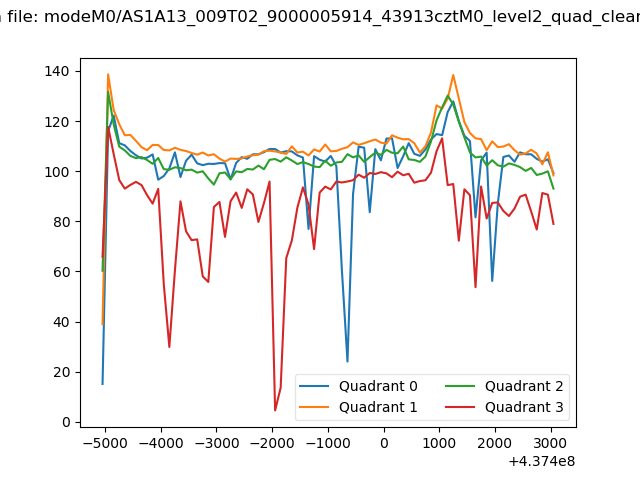 |
|
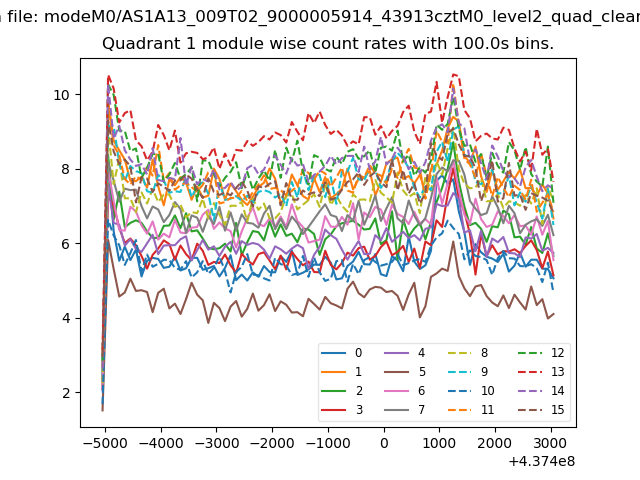
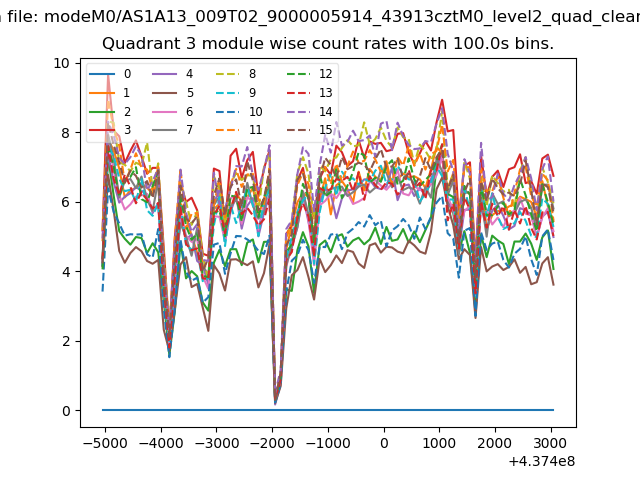
| Module-wise count rates for Quadrant A Data is divided into 100 sec bins |
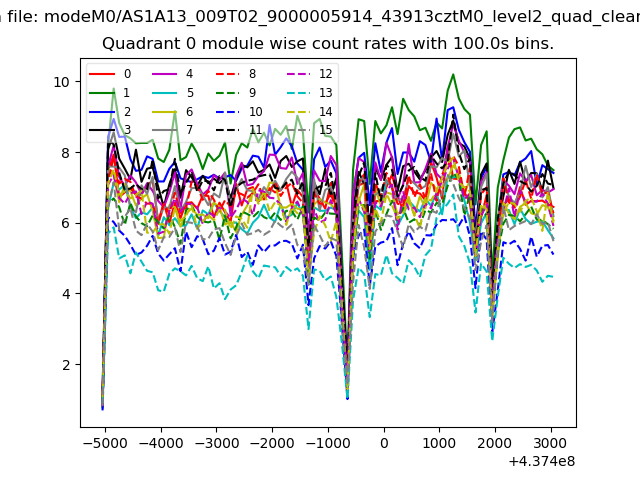 |
 |
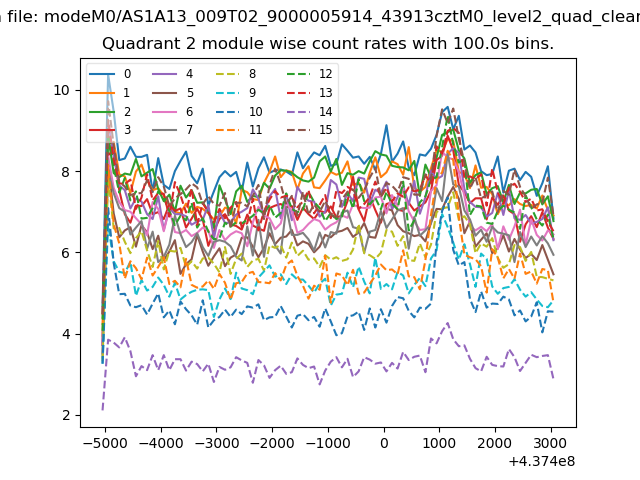
| Module-wise count rates for Quadrant B Data is divided into 100 sec bins |
 |
 |
| Module-wise count rates for Quadrant C Data is divided into 100 sec bins |
 |
 |
| Module-wise count rates for Quadrant D Data is divided into 100 sec bins |
 |
 |
| Parameter | Plot |
|---|---|
| CZT HV Monitor | 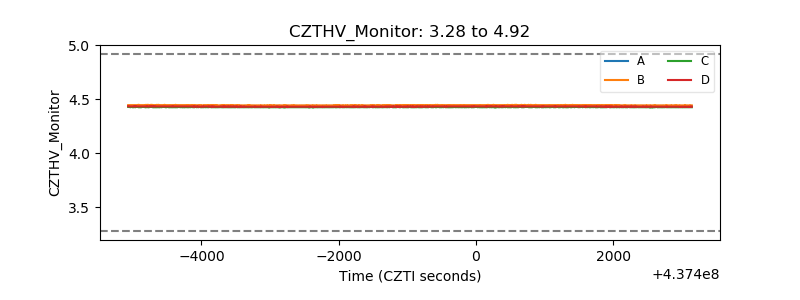 |
| D_VDD | 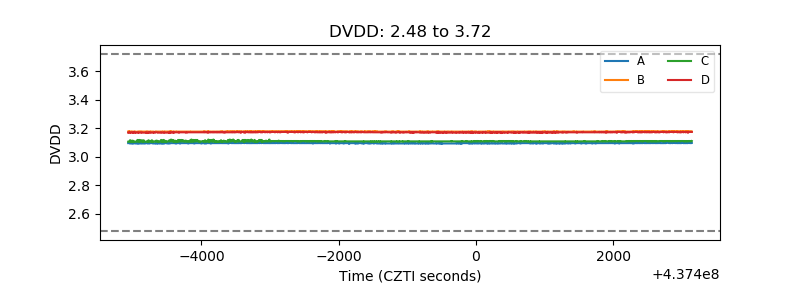 |
| Temperature 1 | 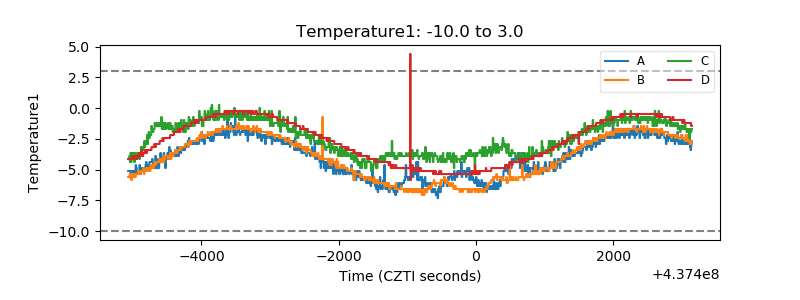 |
| Veto HV Monitor | 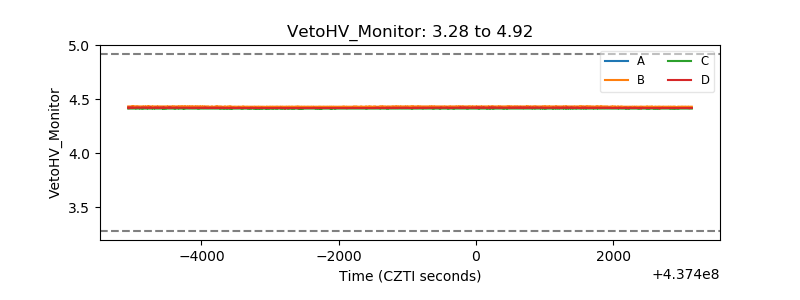 |
| Veto LLD | 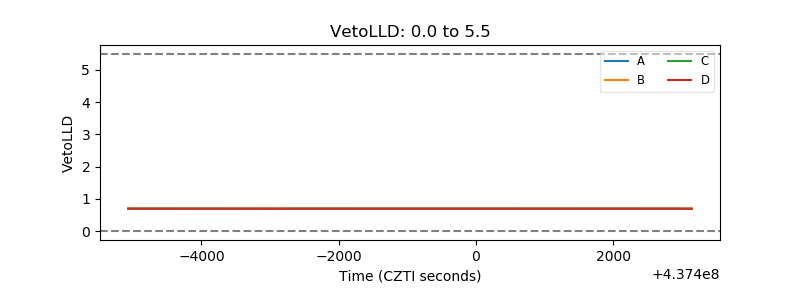 |
| Alpha Counter | 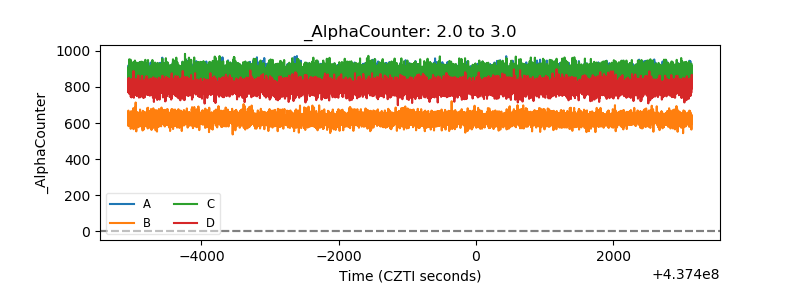 |
| _CPM_Rate | 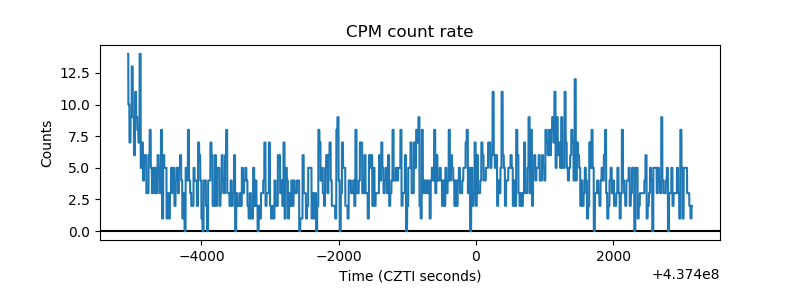 |
| CZT Counter | 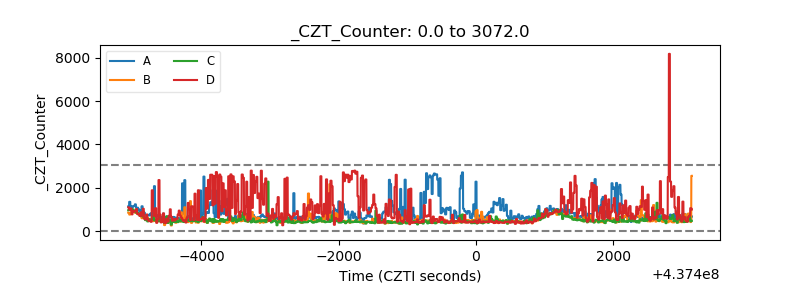 |
| +2.5 Volts monitor | 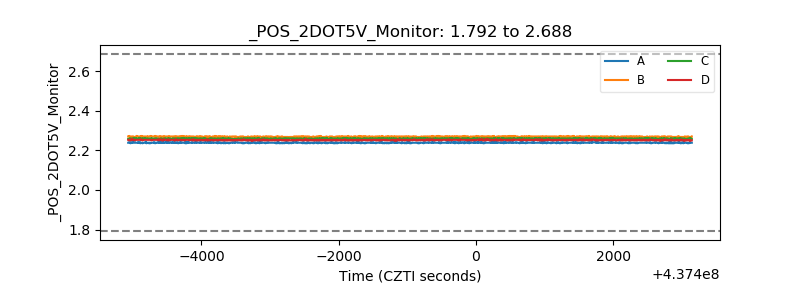 |
| +5 Volts monitor | 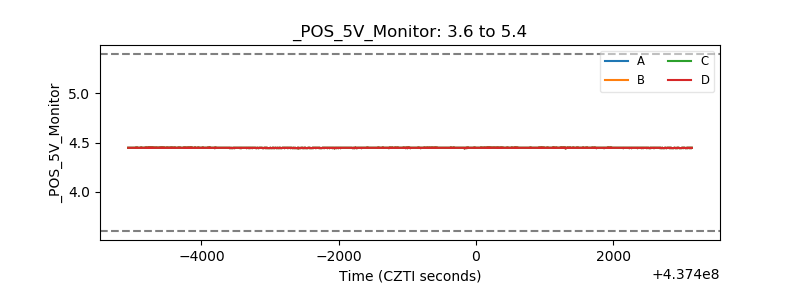 |
| _ROLL_ROT | 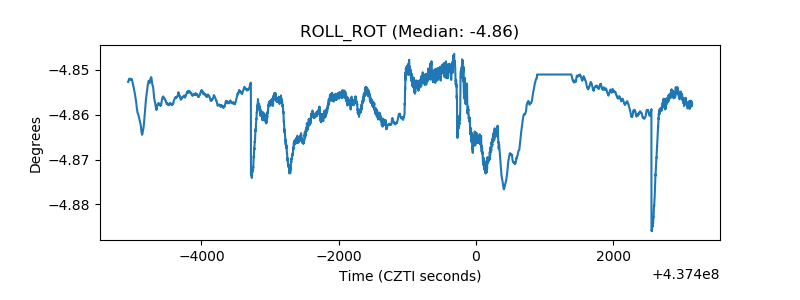 |
| _Roll_DEC | 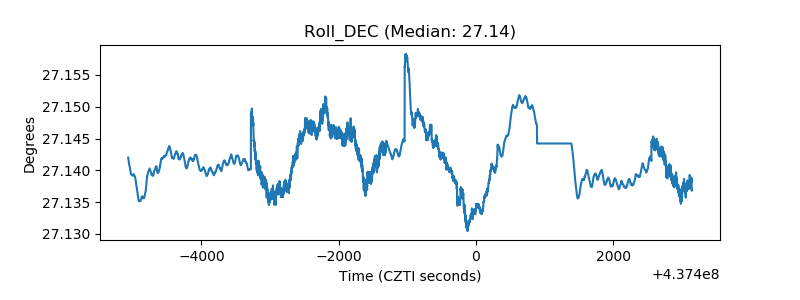 |
| _Roll_RA | 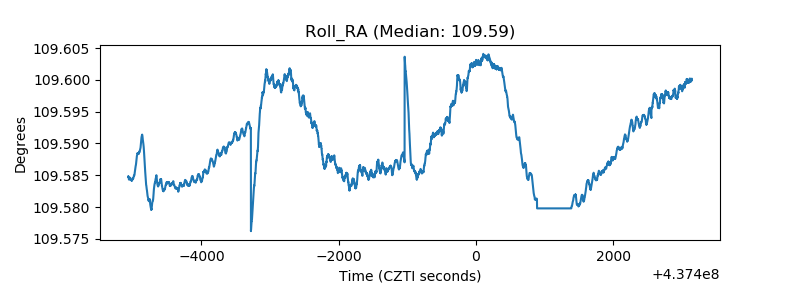 |
| Veto Counter | 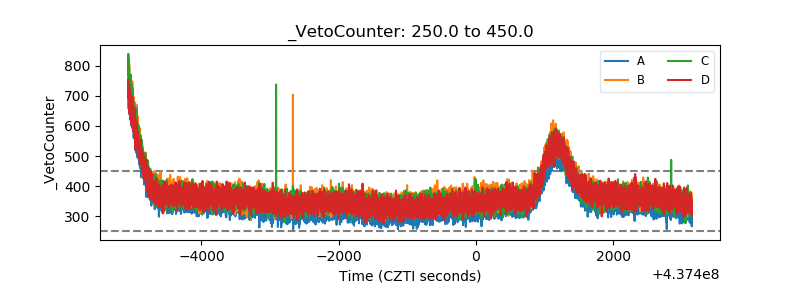 |