| Param | Original file | Final file |
|---|---|---|
| Filename | modeM0/AS1A13_009T02_9000005914_43914cztM0_level2.fits | modeM0/AS1A13_009T02_9000005914_43914cztM0_level2_quad_clean.evt |
| Size (bytes) | 671,811,840 | 121,602,240 |
| Size | 640.7 MB | 116.0 MB |
| Events in quadrant A | 6,297,009 | 824,820 |
| Events in quadrant B | 6,115,298 | 791,165 |
| Events in quadrant C | 5,291,783 | 813,202 |
| Events in quadrant D | 6,554,785 | 704,964 |
| Mode SS | |||
|---|---|---|---|
| Quadrant | BADHDUFLAG | Total packets | Discarded packets |
| A | 0 | 158 | 0 |
| B | 0 | 158 | 0 |
| C | 0 | 158 | 0 |
| D | 0 | 158 | 0 |
| Mode M0 | |||
|---|---|---|---|
| Quadrant | BADHDUFLAG | Total packets | Discarded packets |
| A | 0 | 24834 | 0 |
| B | 0 | 23388 | 0 |
| C | 0 | 20942 | 0 |
| D | 0 | 24848 | 0 |
| Quadrant | Total seconds | Saturated seconds | Saturation percentage |
|---|---|---|---|
| A | 7871 | 371 | 4.713505% |
| B | 7872 | 810 | 10.289634% |
| C | 7872 | 214 | 2.718496% |
| D | 7872 | 665 | 8.447663% |
Noise dominated data is calculated using 1-second bins in cleaned event files. If a bin has >2000 counts, and if more than 50% of those come from <1% of pixels, then it is considered to be noise-dominated and hence unusable.
| Quadrant | # 1 sec bins | Bins with >0 counts | Bins with >2000 counts | High rate bins dominated by noise | Noise dominated (total time) | Noise dominated (detector-on time) | Marked lightcurve |
|---|---|---|---|---|---|---|---|
| A | 7871 | 7871 | 203 | 203 | 2.58% | 2.58% | 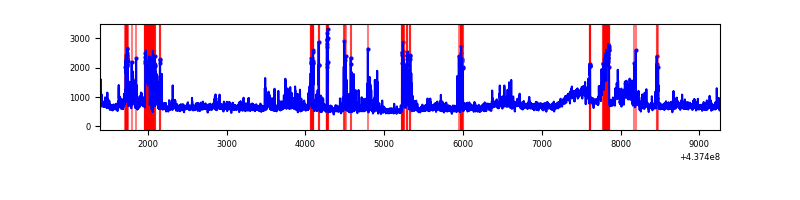 |
| B | 7872 | 7872 | 653 | 653 | 8.30% | 8.30% | 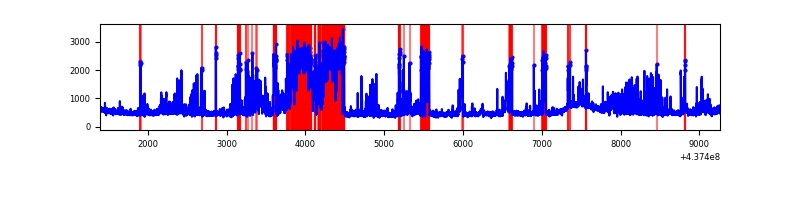 |
| C | 7872 | 7872 | 157 | 157 | 1.99% | 1.99% | 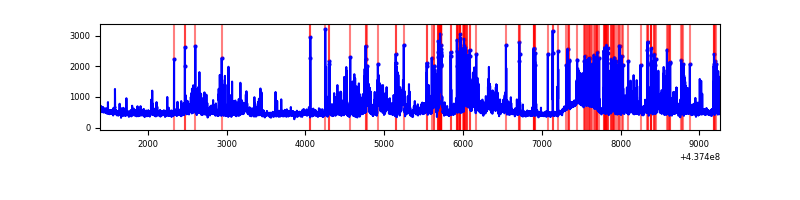 |
| D | 7872 | 7872 | 529 | 529 | 6.72% | 6.72% | 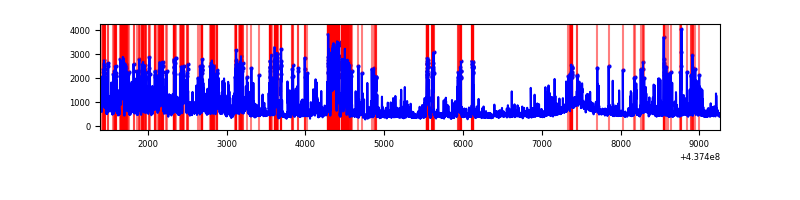 |
Top three noisy pixels from each quadrant. If the there are fewer than three noisy pixels in the level2.evt file, extra rows are filled as -1
| Pixel properties | Quadrant properties | ||||||
|---|---|---|---|---|---|---|---|
| Quadrant | DetID | PixID | Counts | Sigma | Mean | Median | Sigma |
| A | 15 | 223 | 1206636 | 6397.66 | 900 | 880 | 188.5 |
| A | 10 | 83 | 1179401 | 6253.15 | 900 | 880 | 188.5 |
| A | 15 | 222 | 224612 | 1187.11 | 900 | 880 | 188.5 |
| B | 5 | 235 | 2099876 | 12211.55 | 869 | 844 | 171.9 |
| B | 15 | 36 | 216679 | 1255.66 | 869 | 844 | 171.9 |
| B | 5 | 172 | 152205 | 880.57 | 869 | 844 | 171.9 |
| C | 15 | 158 | 912745 | 4404.98 | 876 | 878 | 207.0 |
| C | 3 | 233 | 775683 | 3742.87 | 876 | 878 | 207.0 |
| C | 14 | 254 | 94358 | 451.58 | 876 | 878 | 207.0 |
| D | 1 | 52 | 1155047 | 5182.53 | 864 | 831 | 222.7 |
| D | 12 | 233 | 513953 | 2303.96 | 864 | 831 | 222.7 |
| D | 4 | 234 | 261936 | 1172.38 | 864 | 831 | 222.7 |
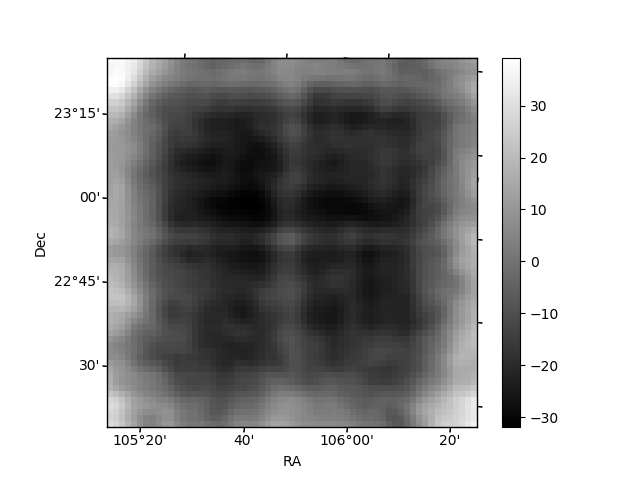
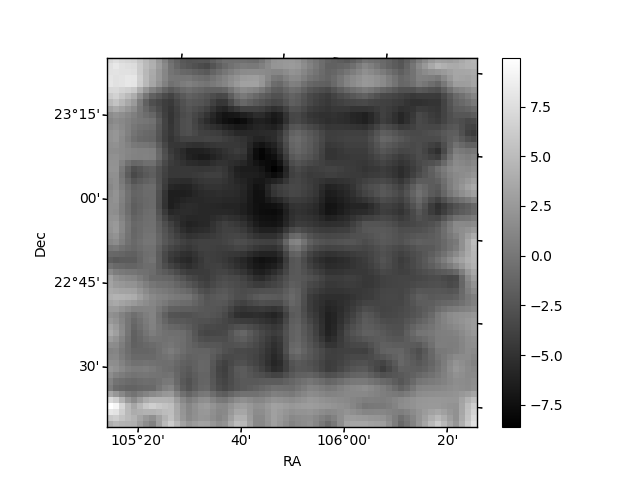
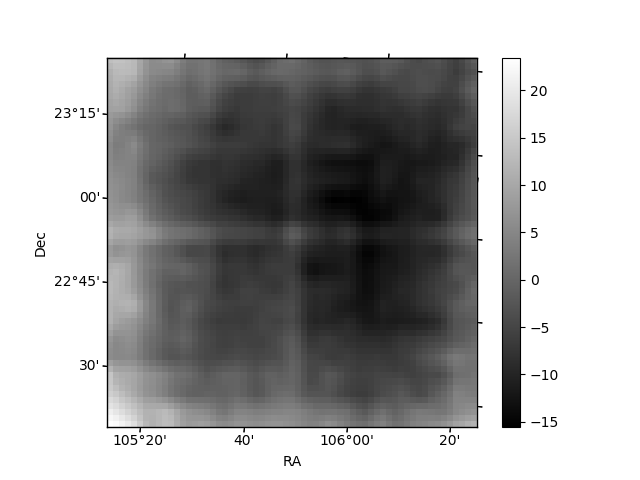
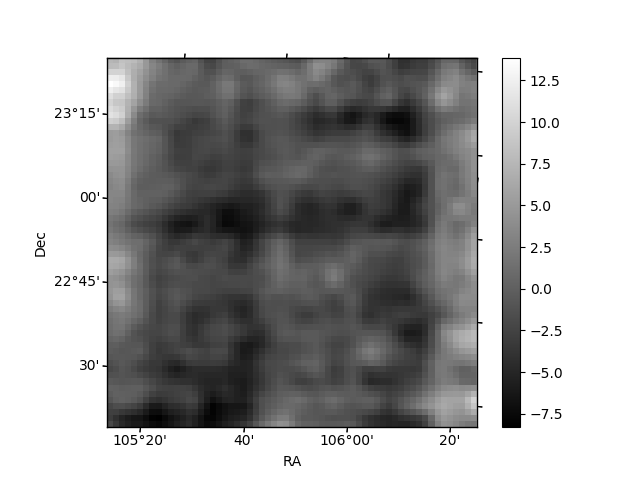
Histogram calculated using DETX and DETY for each event in the final _common_clean file
| Quadrant A | 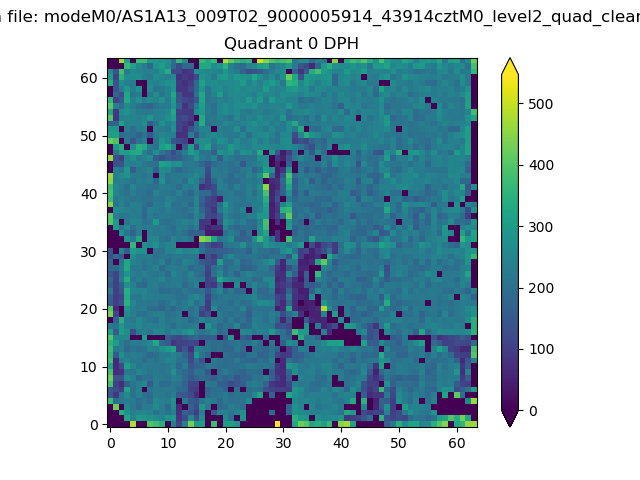 |
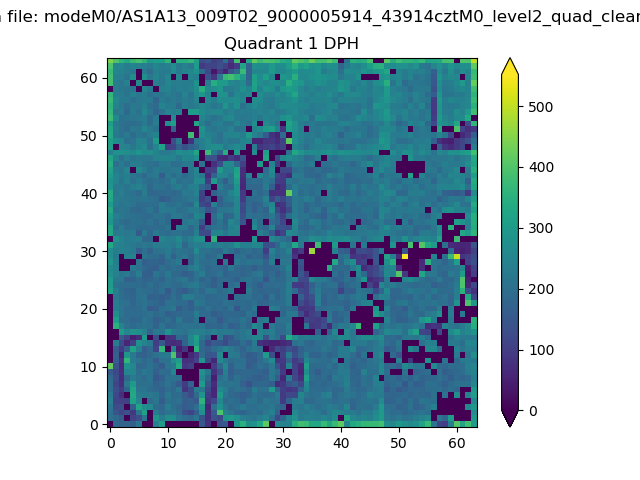 |
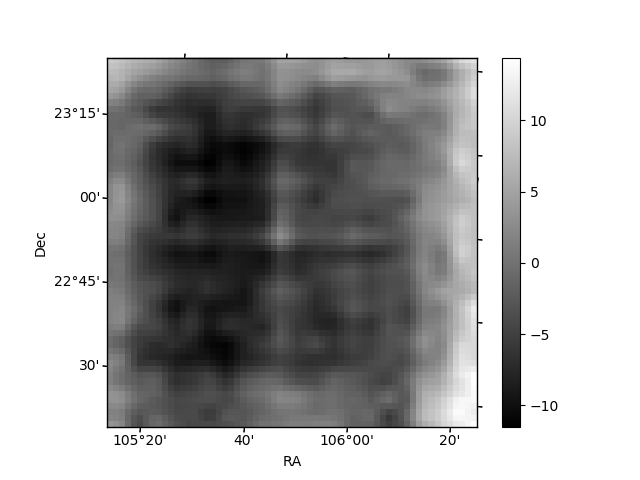
Quadrant B |
|---|---|---|---|
| Quadrant D |  |
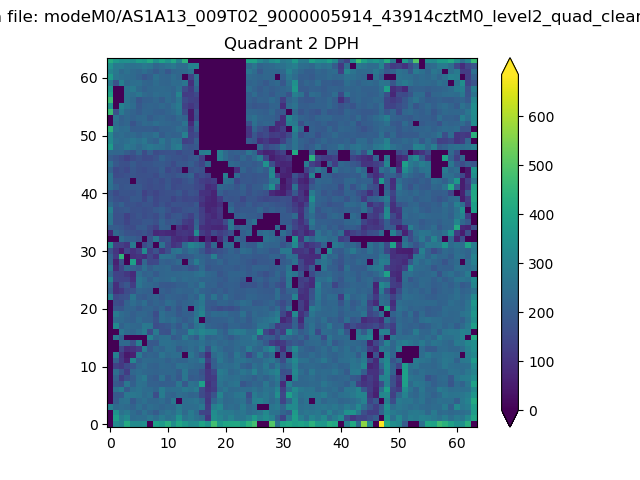 |
Quadrant C |
| Plot type | Count rate plots | Images |
|---|---|---|
| Comparison with Poisson distribution Blue bars denote a histogram of data divided into 1 sec bins. Red curve is a Poisson curve with rate = median count rate of data. |
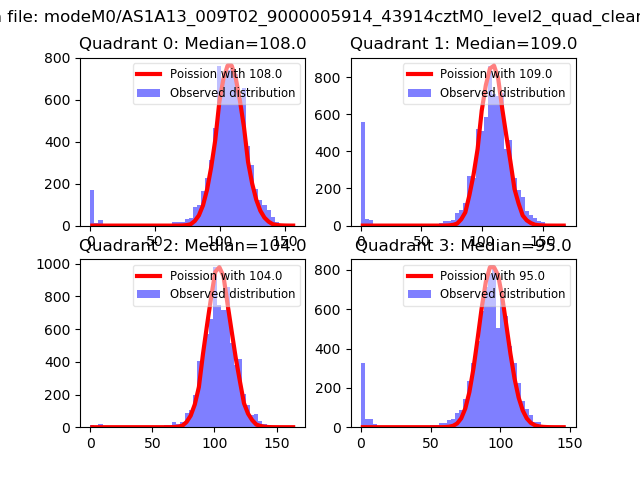 |
 |
| Quadrant-wise count rates Data is divided into 100 sec bins |
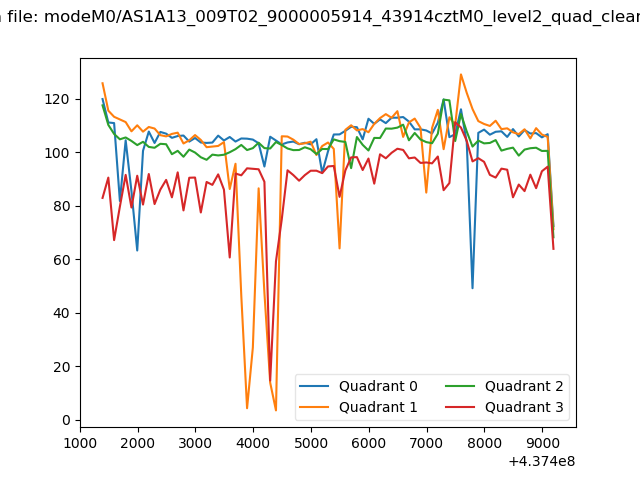 |
|
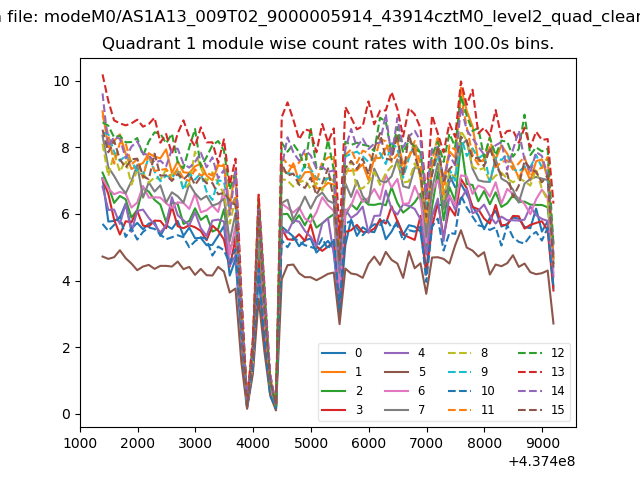
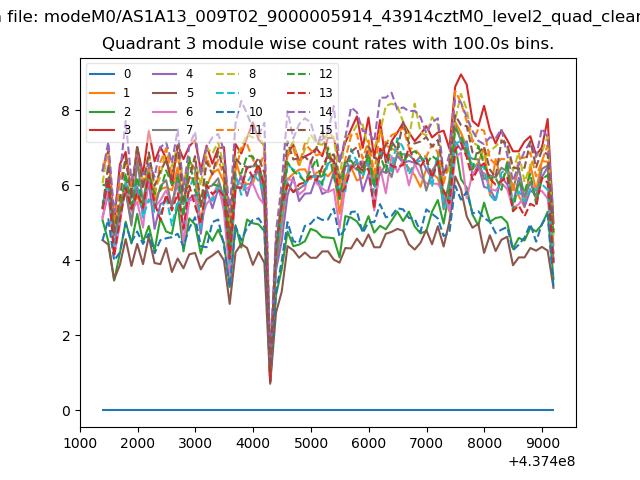
| Module-wise count rates for Quadrant A Data is divided into 100 sec bins |
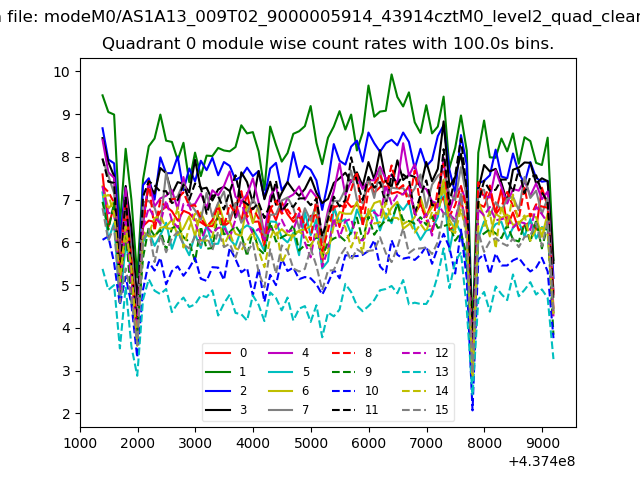 |
 |
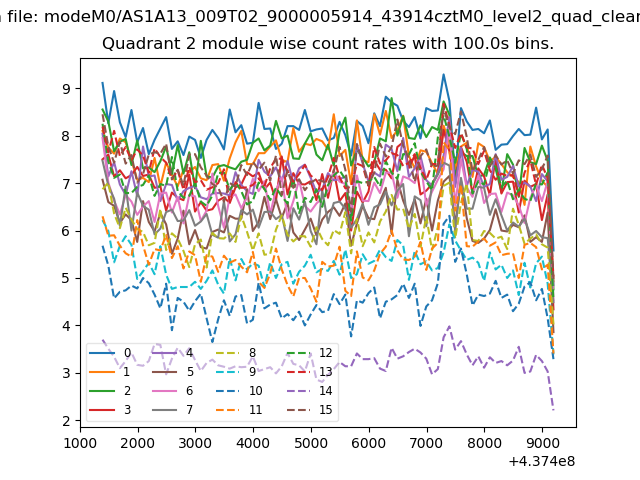
| Module-wise count rates for Quadrant B Data is divided into 100 sec bins |
 |
 |
| Module-wise count rates for Quadrant C Data is divided into 100 sec bins |
 |
 |
| Module-wise count rates for Quadrant D Data is divided into 100 sec bins |
 |
 |
| Parameter | Plot |
|---|---|
| CZT HV Monitor | 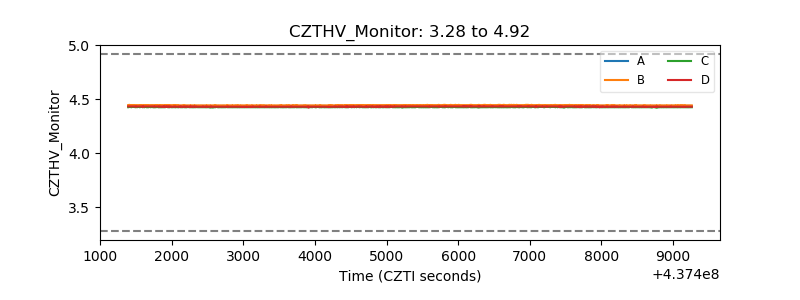 |
| D_VDD | 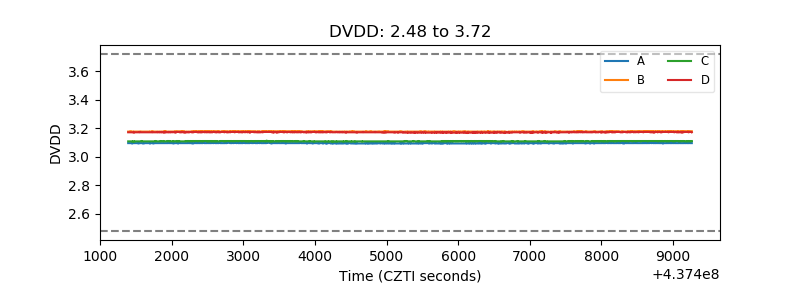 |
| Temperature 1 | 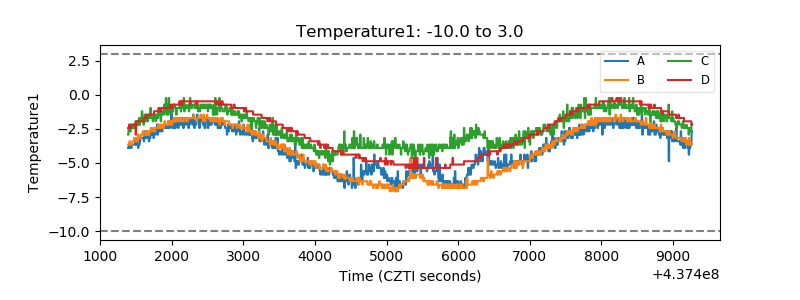 |
| Veto HV Monitor | 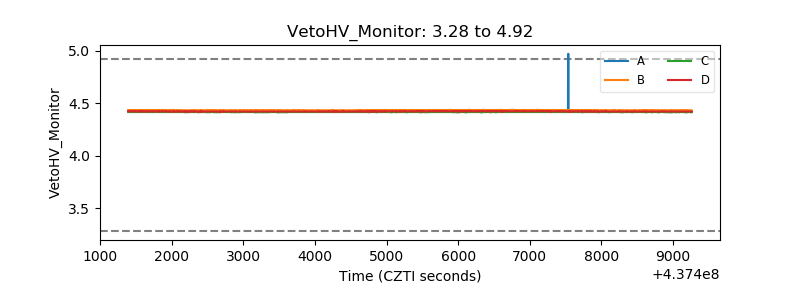 |
| Veto LLD | 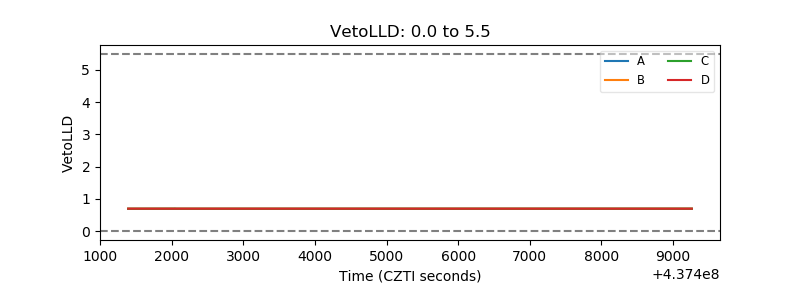 |
| Alpha Counter | 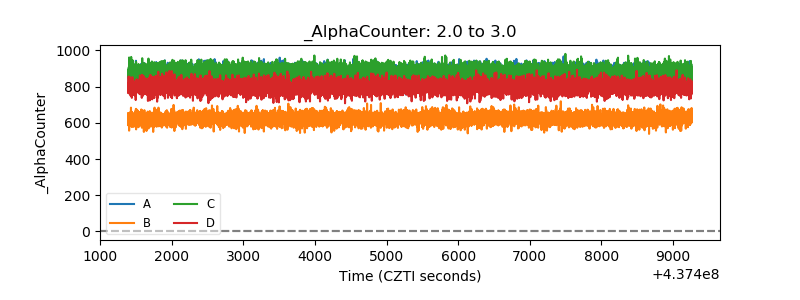 |
| _CPM_Rate | 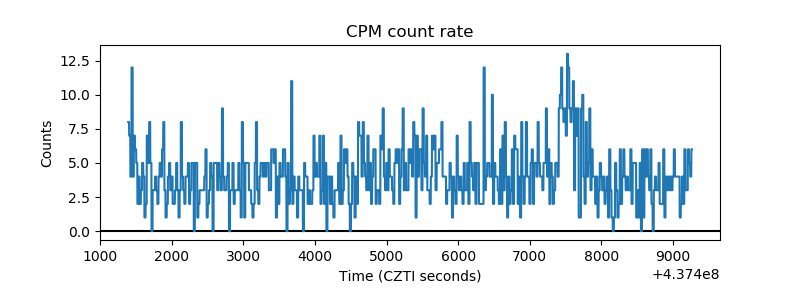 |
| CZT Counter | 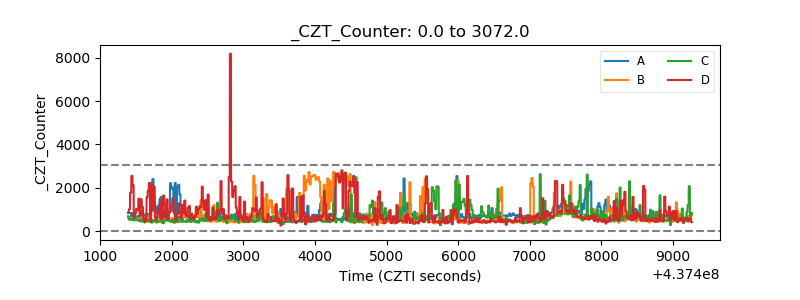 |
| +2.5 Volts monitor | 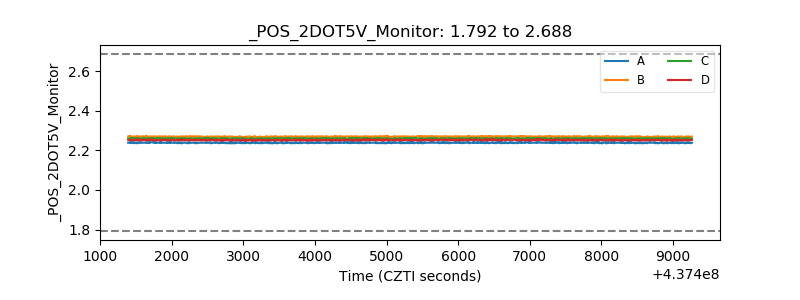 |
| +5 Volts monitor | 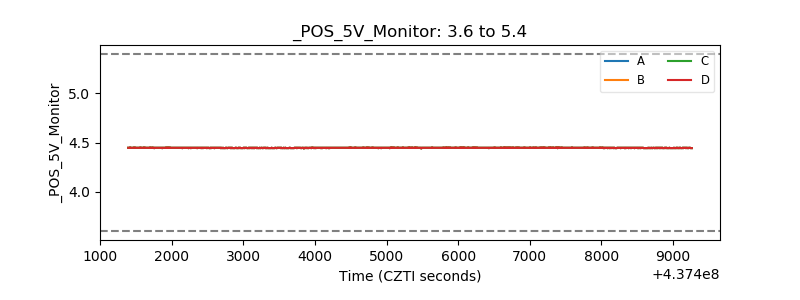 |
| _ROLL_ROT | 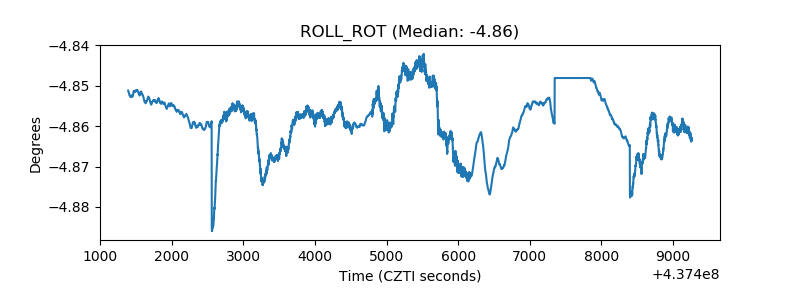 |
| _Roll_DEC | 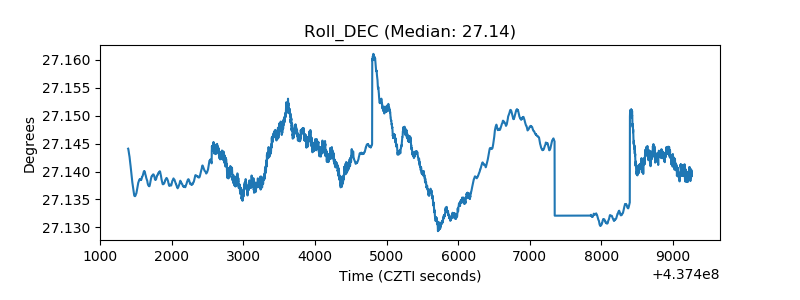 |
| _Roll_RA | 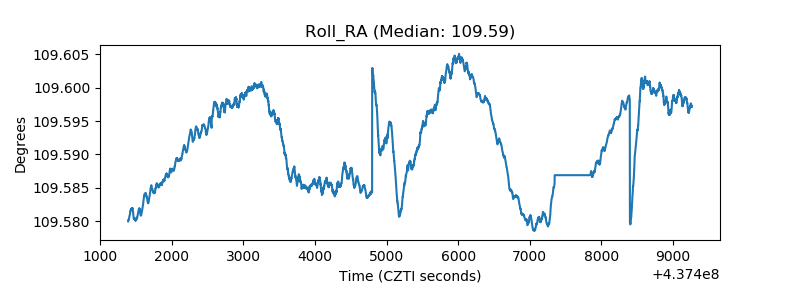 |
| Veto Counter | 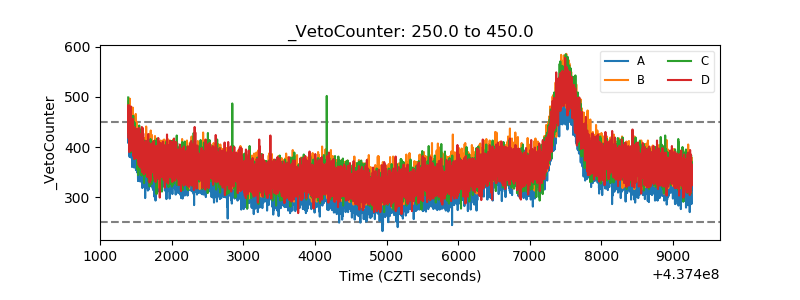 |