| Param | Original file | Final file |
|---|---|---|
| Filename | modeM0/AS1A13_009T02_9000005914_43917cztM0_level2.fits | modeM0/AS1A13_009T02_9000005914_43917cztM0_level2_quad_clean.evt |
| Size (bytes) | 1,213,868,160 | 248,374,080 |
| Size | 1.1 GB | 236.9 MB |
| Events in quadrant A | 13,857,480 | 1,640,951 |
| Events in quadrant B | 9,015,658 | 1,706,465 |
| Events in quadrant C | 9,003,023 | 1,644,725 |
| Events in quadrant D | 11,813,834 | 1,416,905 |
| Mode M9 | |||
|---|---|---|---|
| Quadrant | BADHDUFLAG | Total packets | Discarded packets |
| A | 0 | 6 | 0 |
| B | 0 | 6 | 0 |
| C | 0 | 6 | 0 |
| D | 0 | 6 | 0 |
| Mode SS | |||
|---|---|---|---|
| Quadrant | BADHDUFLAG | Total packets | Discarded packets |
| A | 0 | 328 | 0 |
| B | 0 | 328 | 0 |
| C | 0 | 328 | 0 |
| D | 0 | 328 | 0 |
| Mode M0 | |||
|---|---|---|---|
| Quadrant | BADHDUFLAG | Total packets | Discarded packets |
| A | 0 | 53321 | 2 |
| B | 0 | 37856 | 2 |
| C | 0 | 38036 | 2 |
| D | 0 | 46438 | 2 |
| Quadrant | Total seconds | Saturated seconds | Saturation percentage |
|---|---|---|---|
| A | 16091 | 772 | 4.797713% |
| B | 16091 | 505 | 3.138400% |
| C | 16092 | 344 | 2.137708% |
| D | 16092 | 1212 | 7.531693% |
Noise dominated data is calculated using 1-second bins in cleaned event files. If a bin has >2000 counts, and if more than 50% of those come from <1% of pixels, then it is considered to be noise-dominated and hence unusable.
| Quadrant | # 1 sec bins | Bins with >0 counts | Bins with >2000 counts | High rate bins dominated by noise | Noise dominated (total time) | Noise dominated (detector-on time) | Marked lightcurve |
|---|---|---|---|---|---|---|---|
| A | 16731 | 16094 | 427 | 427 | 2.55% | 2.65% | 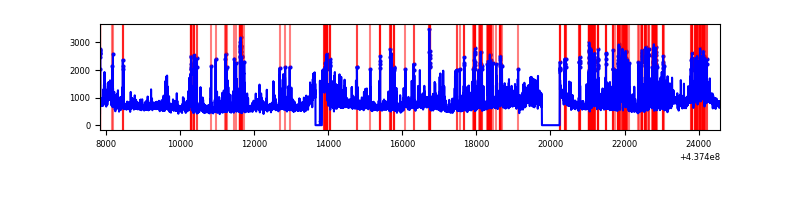 |
| B | 16731 | 16094 | 181 | 181 | 1.08% | 1.12% | 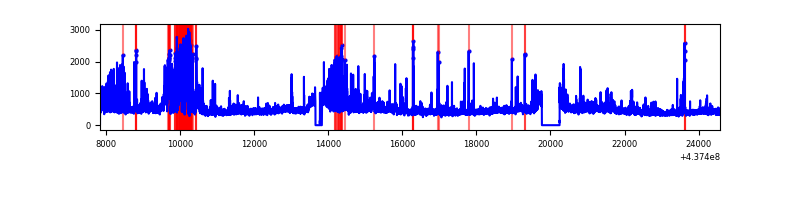 |
| C | 16732 | 16095 | 193 | 193 | 1.15% | 1.20% | 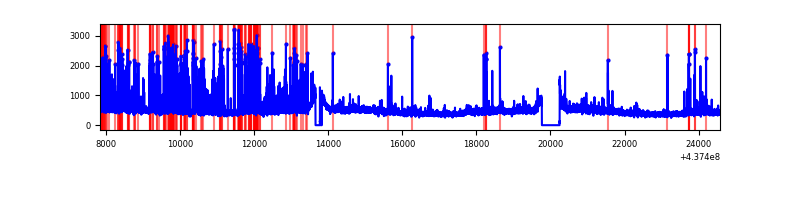 |
| D | 16732 | 16095 | 960 | 960 | 5.74% | 5.96% | 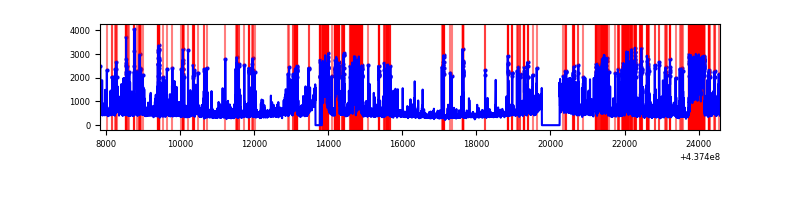 |
Top three noisy pixels from each quadrant. If the there are fewer than three noisy pixels in the level2.evt file, extra rows are filled as -1
| Pixel properties | Quadrant properties | ||||||
|---|---|---|---|---|---|---|---|
| Quadrant | DetID | PixID | Counts | Sigma | Mean | Median | Sigma |
| A | 10 | 83 | 2433277 | 6667.02 | 1760 | 1722 | 364.7 |
| A | 15 | 223 | 1924522 | 5272.08 | 1760 | 1722 | 364.7 |
| A | 15 | 222 | 1798024 | 4925.24 | 1760 | 1722 | 364.7 |
| B | 5 | 235 | 1214788 | 3471.07 | 1768 | 1711 | 349.5 |
| B | 15 | 36 | 287388 | 817.43 | 1768 | 1711 | 349.5 |
| B | 0 | 183 | 117704 | 331.9 | 1768 | 1711 | 349.5 |
| C | 15 | 158 | 1369829 | 3356.97 | 1739 | 1749 | 407.5 |
| C | 3 | 233 | 491396 | 1201.49 | 1739 | 1749 | 407.5 |
| C | 14 | 254 | 141294 | 342.41 | 1739 | 1749 | 407.5 |
| D | 13 | 249 | 900012 | 2073.78 | 1704 | 1652 | 433.2 |
| D | 12 | 233 | 885264 | 2039.74 | 1704 | 1652 | 433.2 |
| D | 7 | 204 | 689760 | 1588.43 | 1704 | 1652 | 433.2 |
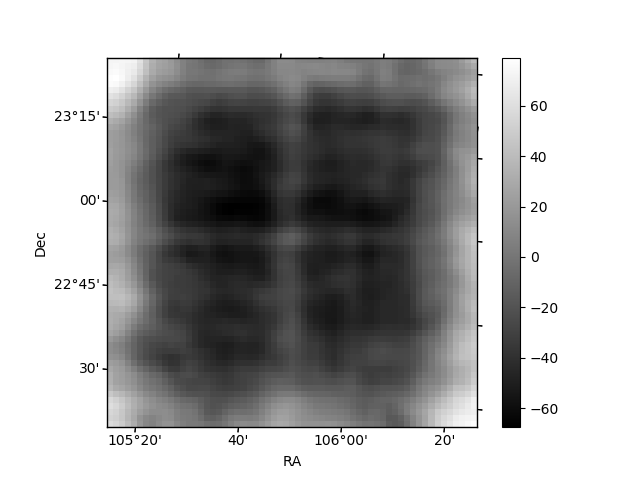
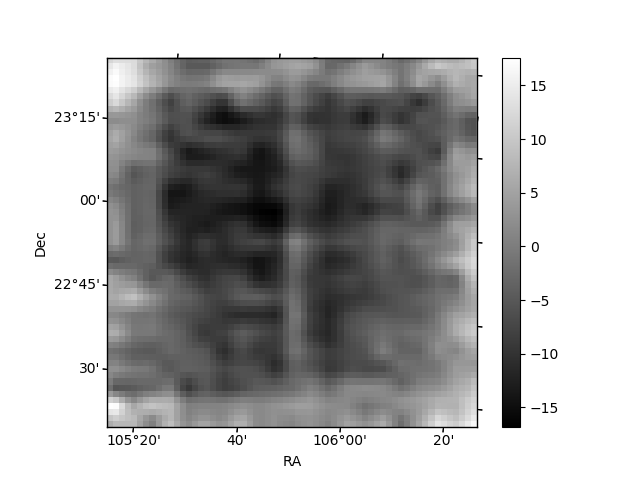
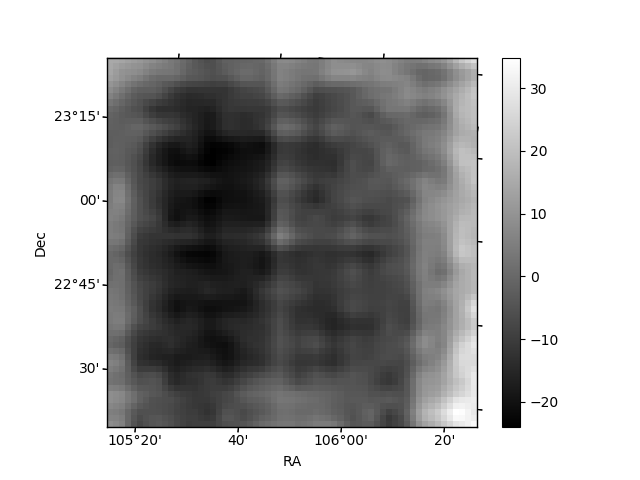
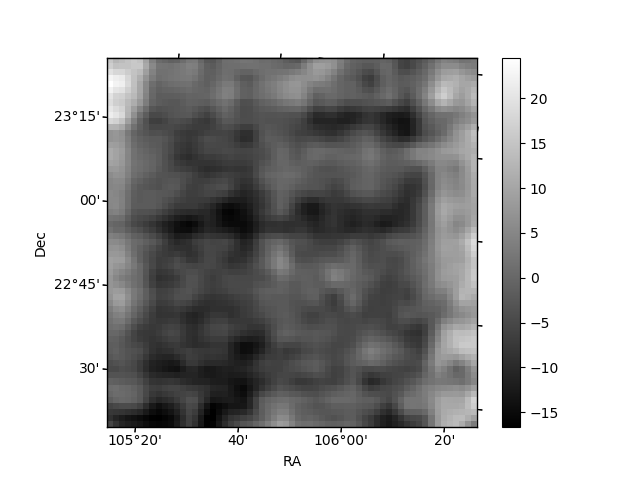
Histogram calculated using DETX and DETY for each event in the final _common_clean file
| Quadrant A | 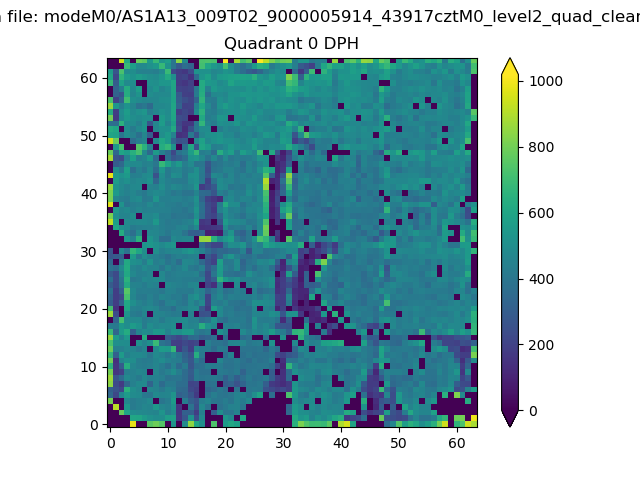 |
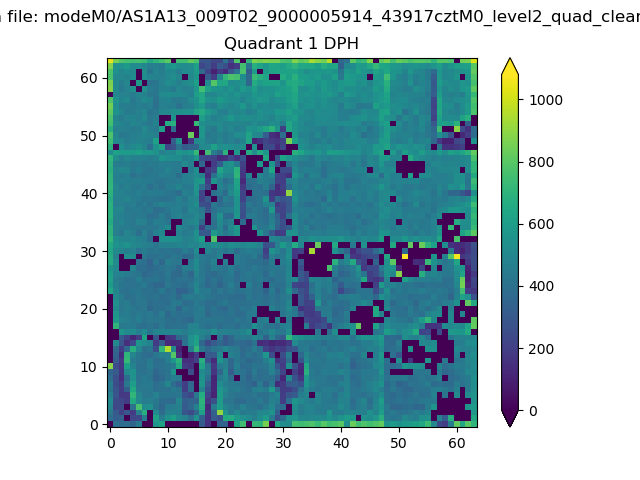 |
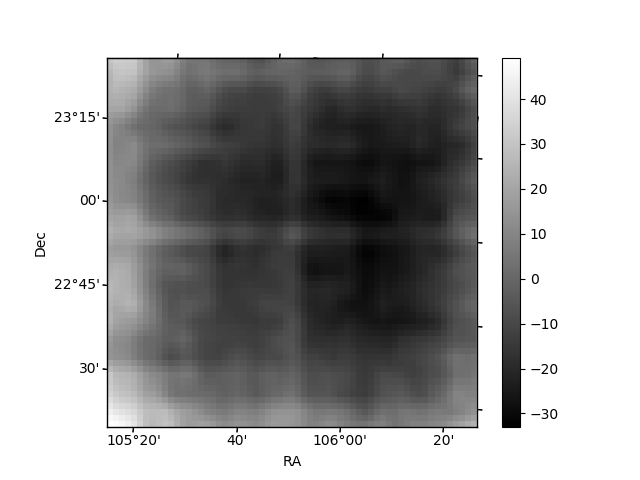
Quadrant B |
|---|---|---|---|
| Quadrant D | 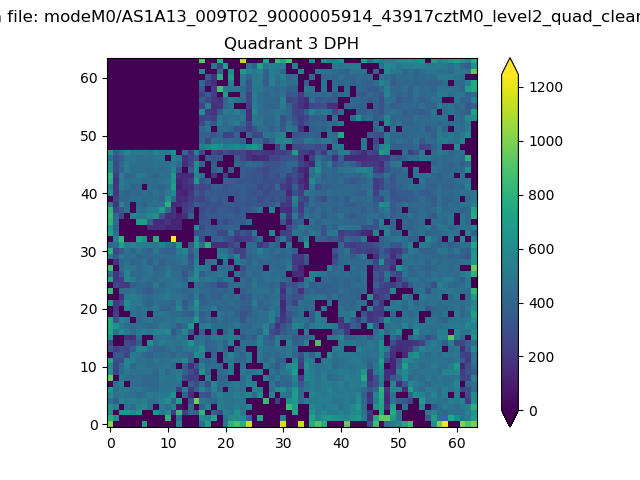 |
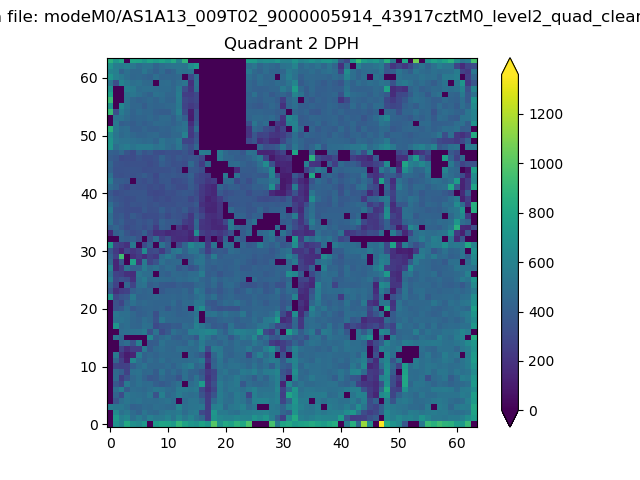 |
Quadrant C |
| Plot type | Count rate plots | Images |
|---|---|---|
| Comparison with Poisson distribution Blue bars denote a histogram of data divided into 1 sec bins. Red curve is a Poisson curve with rate = median count rate of data. |
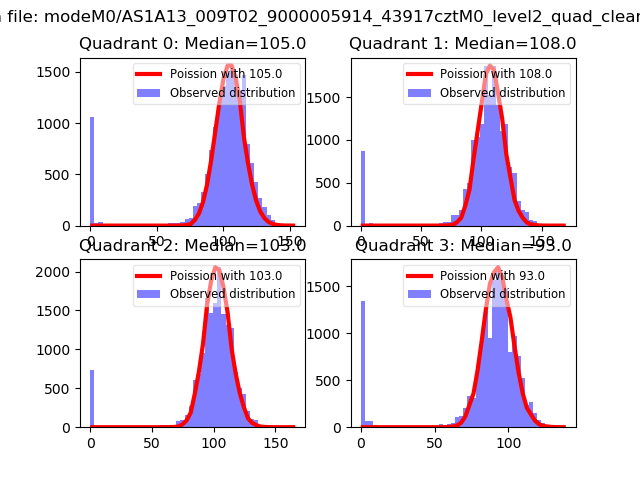 |
 |
| Quadrant-wise count rates Data is divided into 100 sec bins |
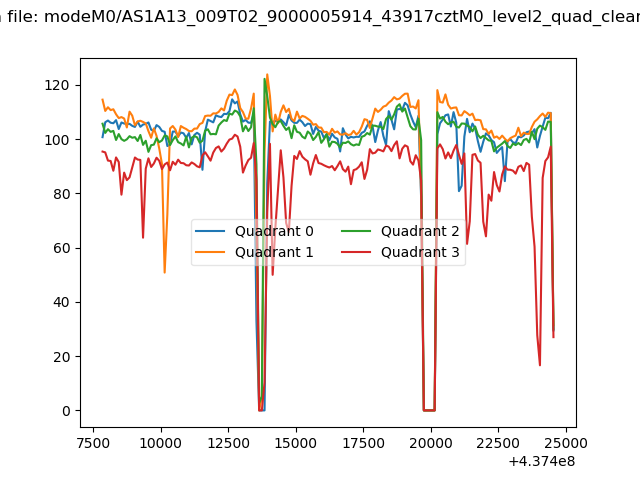 |
|
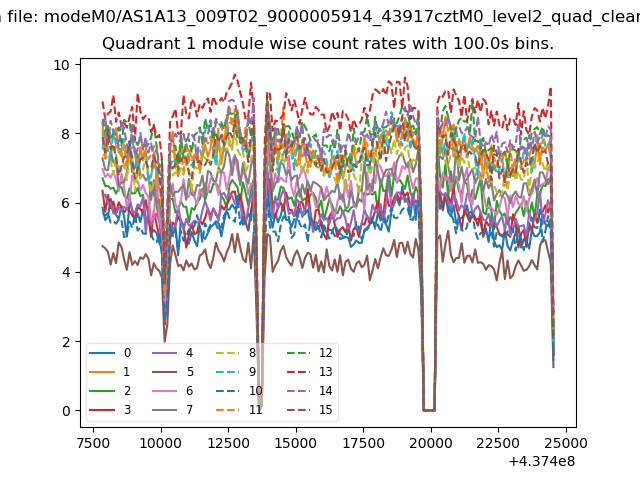
| Module-wise count rates for Quadrant A Data is divided into 100 sec bins |
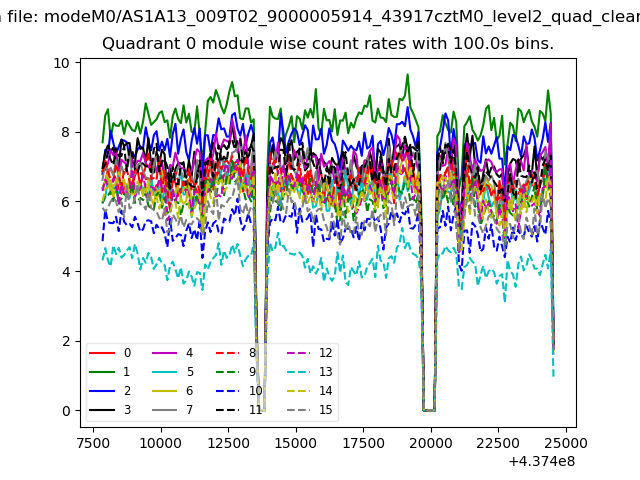 |
 |
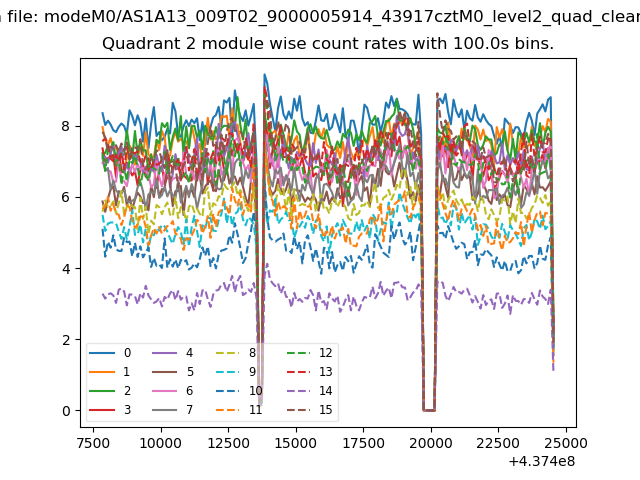
| Module-wise count rates for Quadrant B Data is divided into 100 sec bins |
 |
 |
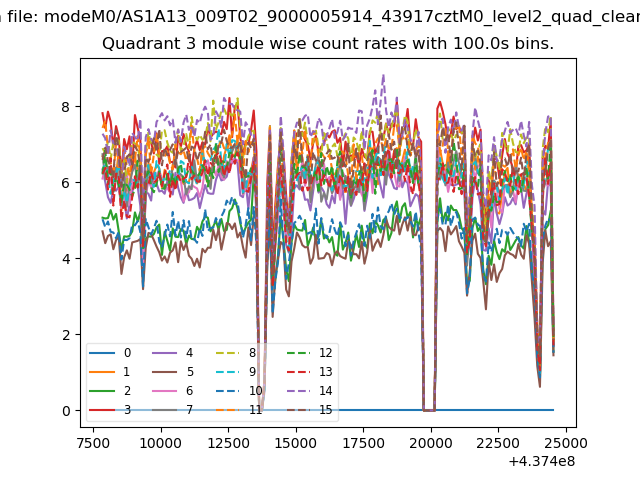
| Module-wise count rates for Quadrant C Data is divided into 100 sec bins |
 |
 |
| Module-wise count rates for Quadrant D Data is divided into 100 sec bins |
 |
 |
| Parameter | Plot |
|---|---|
| CZT HV Monitor | 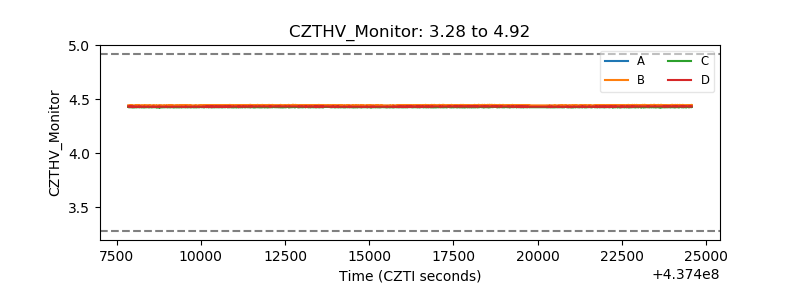 |
| D_VDD | 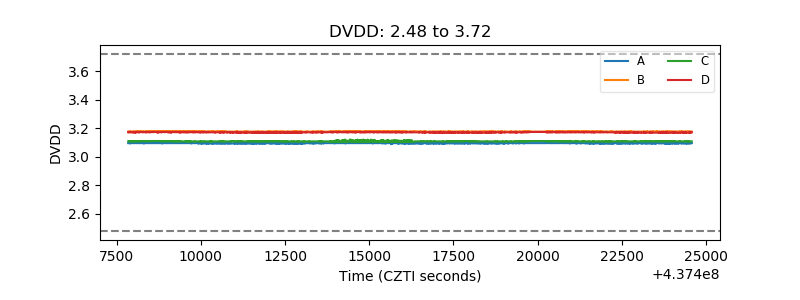 |
| Temperature 1 | 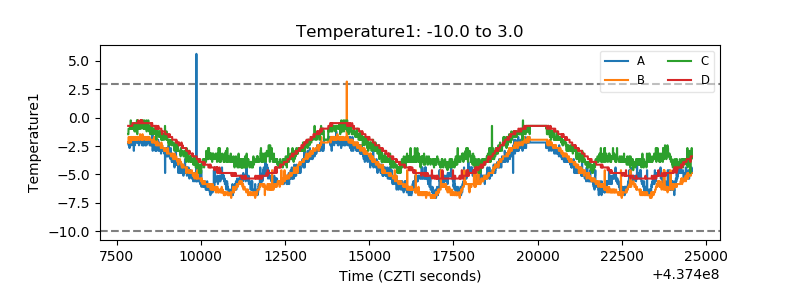 |
| Veto HV Monitor | 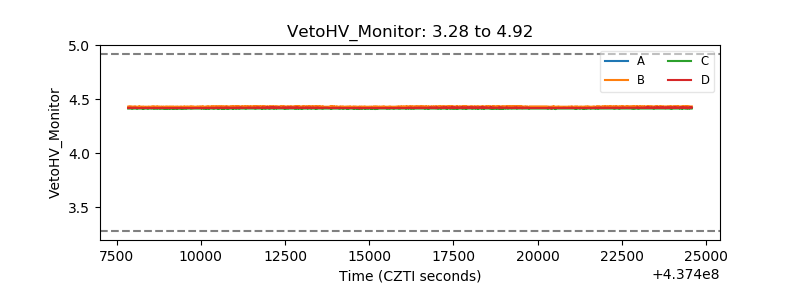 |
| Veto LLD | 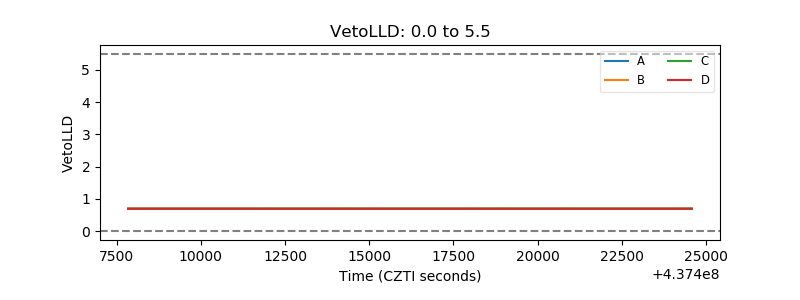 |
| Alpha Counter | 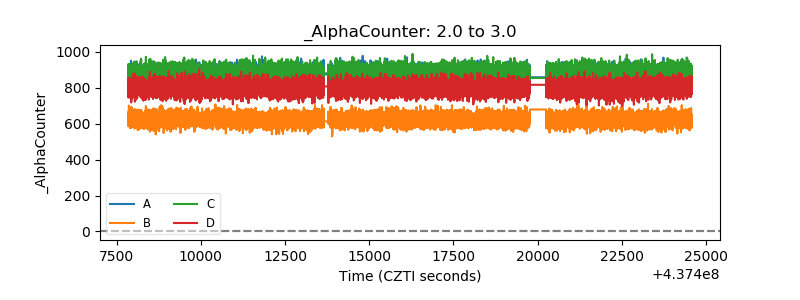 |
| _CPM_Rate | 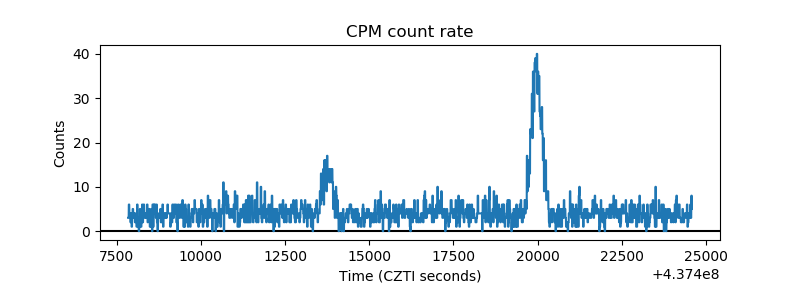 |
| CZT Counter | 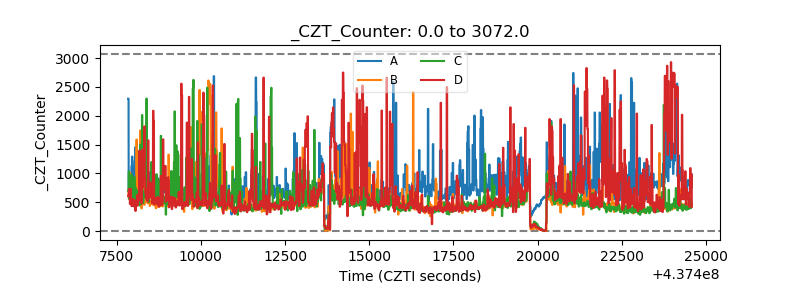 |
| +2.5 Volts monitor | 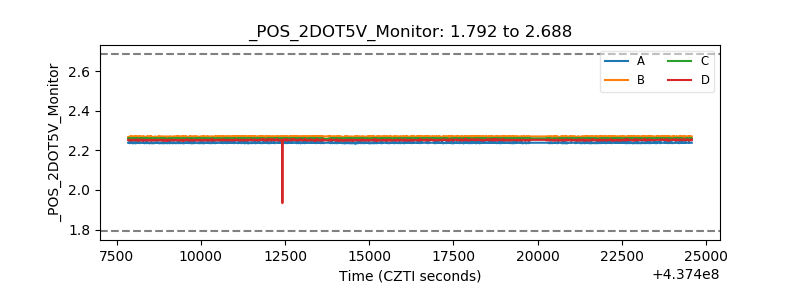 |
| +5 Volts monitor | 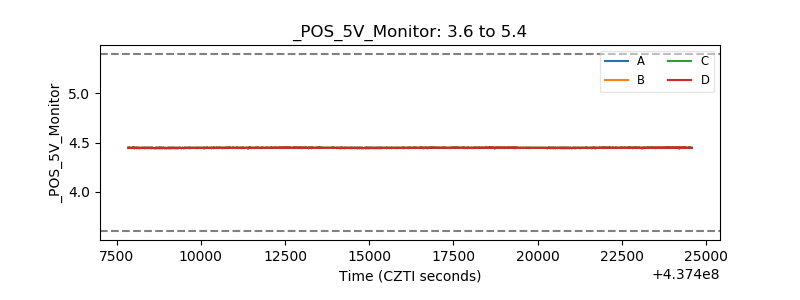 |
| _ROLL_ROT | 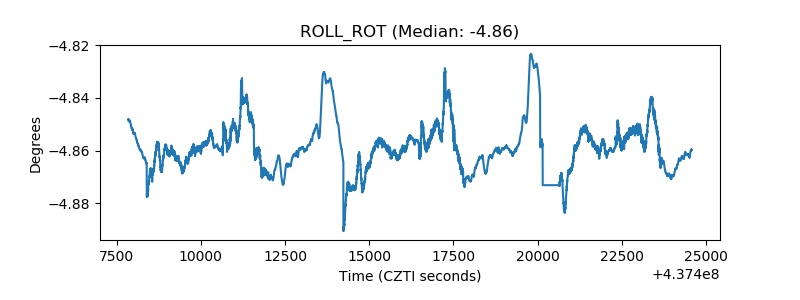 |
| _Roll_DEC | 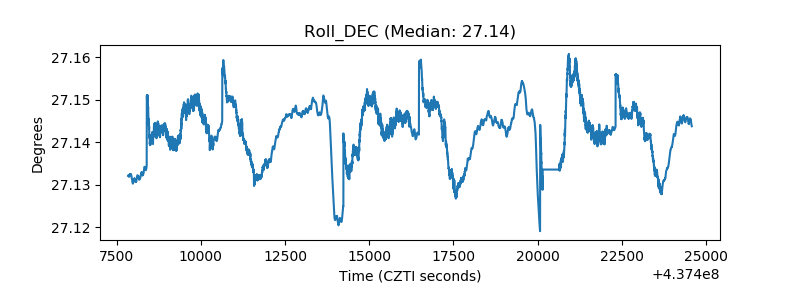 |
| _Roll_RA | 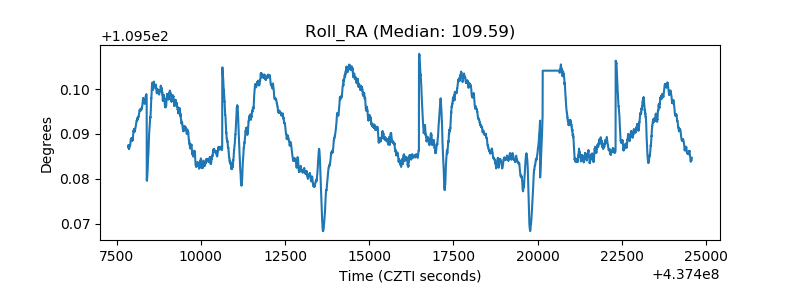 |
| Veto Counter | 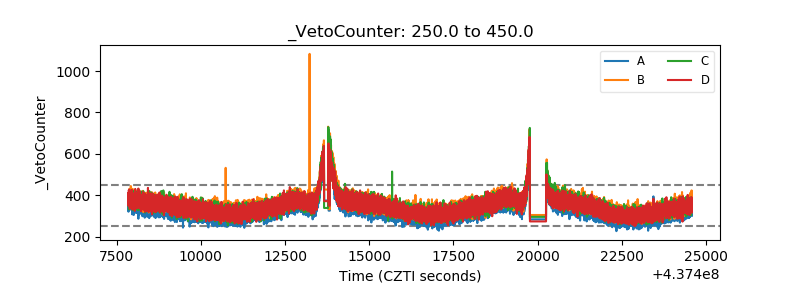 |